
The world's financial markets are waking up to an uncomfortable truth: nature is not infinite, and its decline carries a price tag measured in trillions. As ecosystems shrink and critical services like carbon sequestration, pollination, and water filtration falter, investors, developers, and corporate leaders face an urgent question—how do we measure what we're losing, and what will it cost us? 🌍
In 2026, the intersection of Nature Loss Financial Materiality: Biodiversity Survey Techniques to Quantify Ecosystem Service Decline in 2026 has moved from academic theory to boardroom imperative. The landmark IPBES Business and Biodiversity Assessment, endorsed by over 150 governments in February 2026, confirmed what scientists have warned for decades: every business depends on biodiversity, and every business impacts it.[5] With approximately US$44 trillion of annual economic output relying on nature globally,[1] the financial stakes have never been clearer.
This comprehensive guide explores how biodiversity surveyors, financial analysts, and sustainability professionals are deploying cutting-edge survey techniques to quantify ecosystem service decline—transforming abstract environmental concerns into concrete financial metrics that drive investment decisions, regulatory compliance, and corporate strategy.
Key Takeaways
- Financial materiality of nature loss is now quantifiable through advanced biodiversity survey techniques that translate ecosystem decline into monetary risk assessments, with US$44 trillion in global economic output dependent on nature.[1]
- Restoration finance must quadruple from US$64 billion (2022) to US$296 billion by 2030 to meet global targets, creating urgent demand for robust biodiversity measurement protocols.[6]
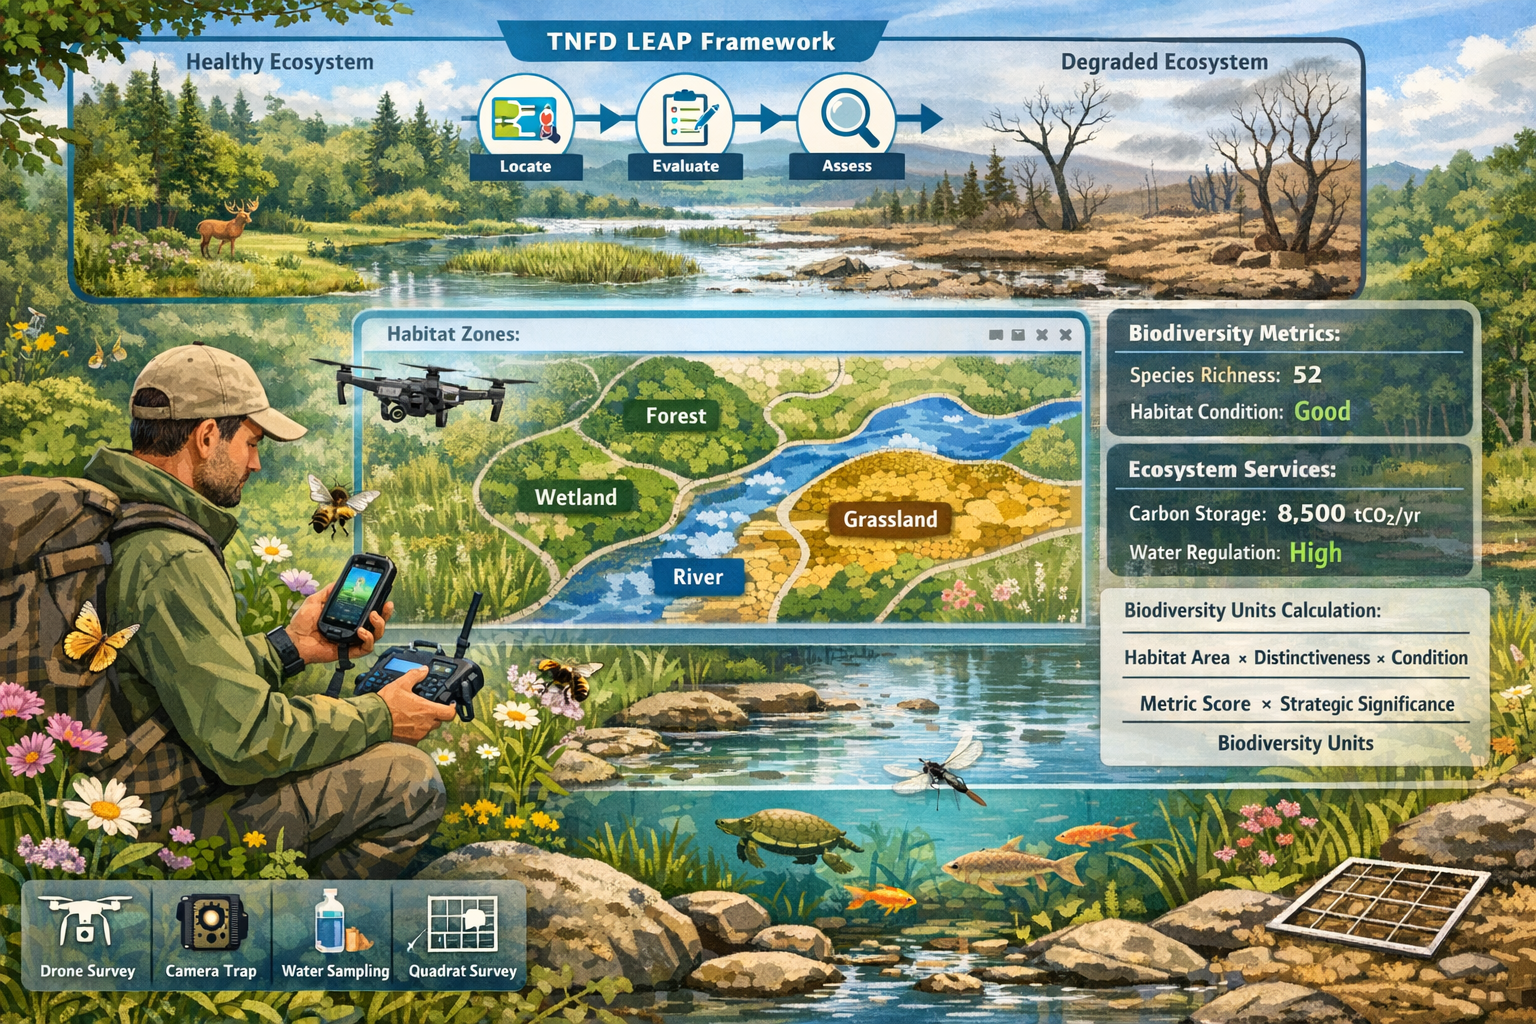
- The TNFD LEAP approach (Locate, Evaluate, Assess, Prepare) has emerged as the standard framework for integrating biodiversity surveys with financial risk management and corporate disclosure.[4]
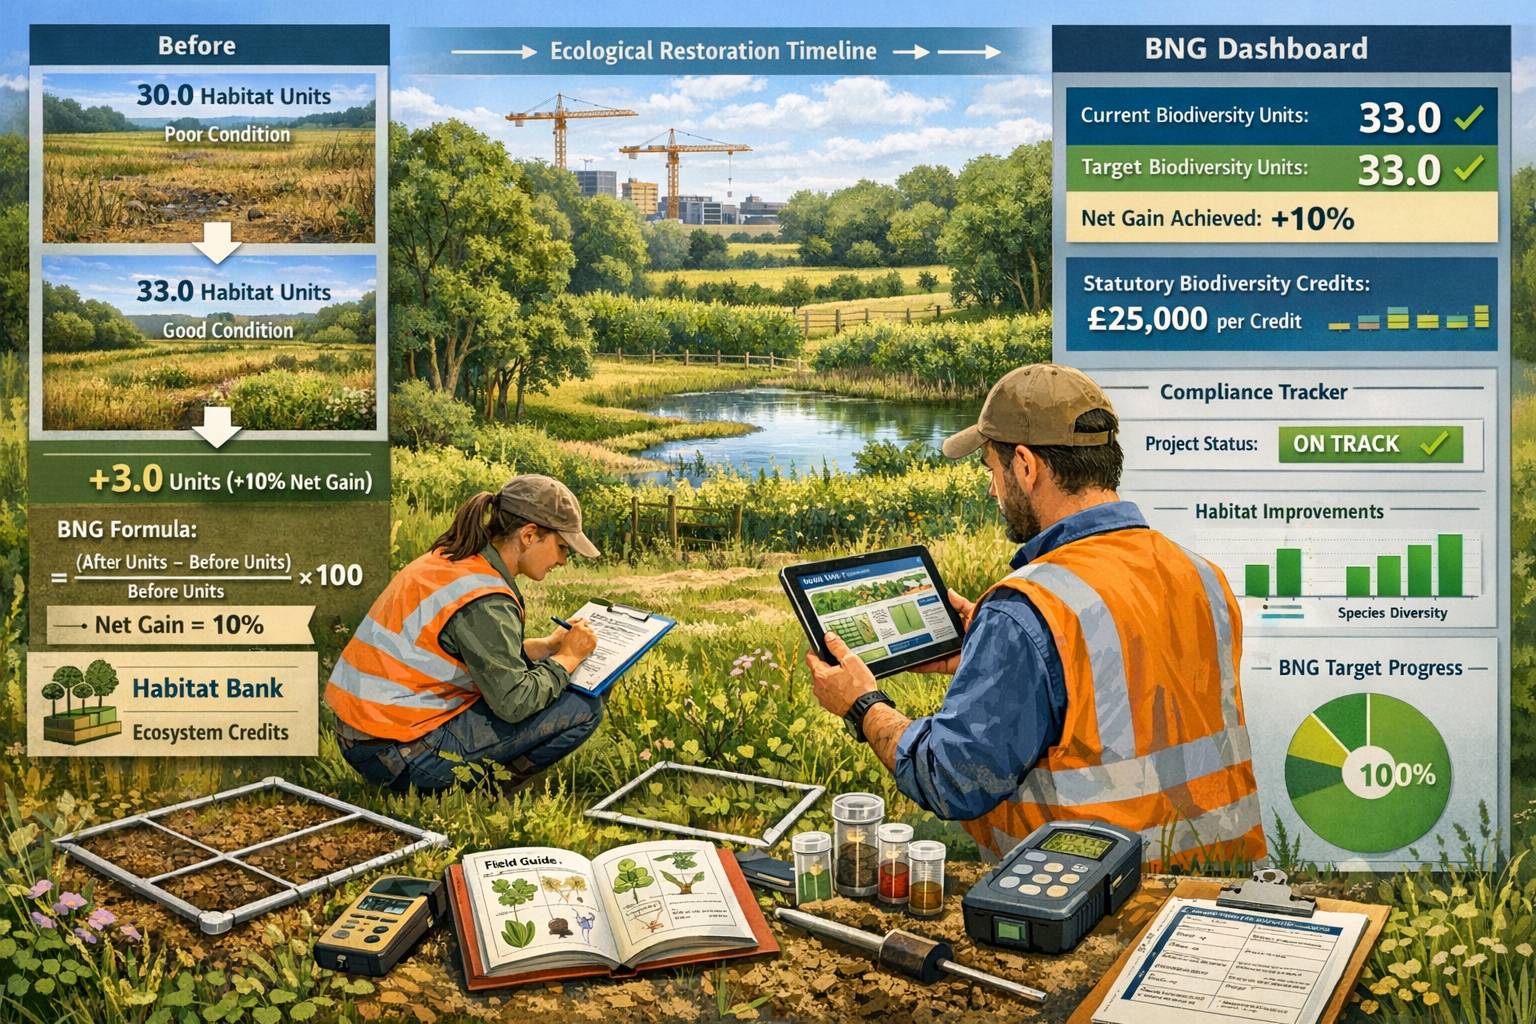
- Biodiversity Net Gain (BNG) protocols provide developers and landowners with standardized methodologies to measure, offset, and enhance biodiversity while meeting regulatory requirements and investor expectations.
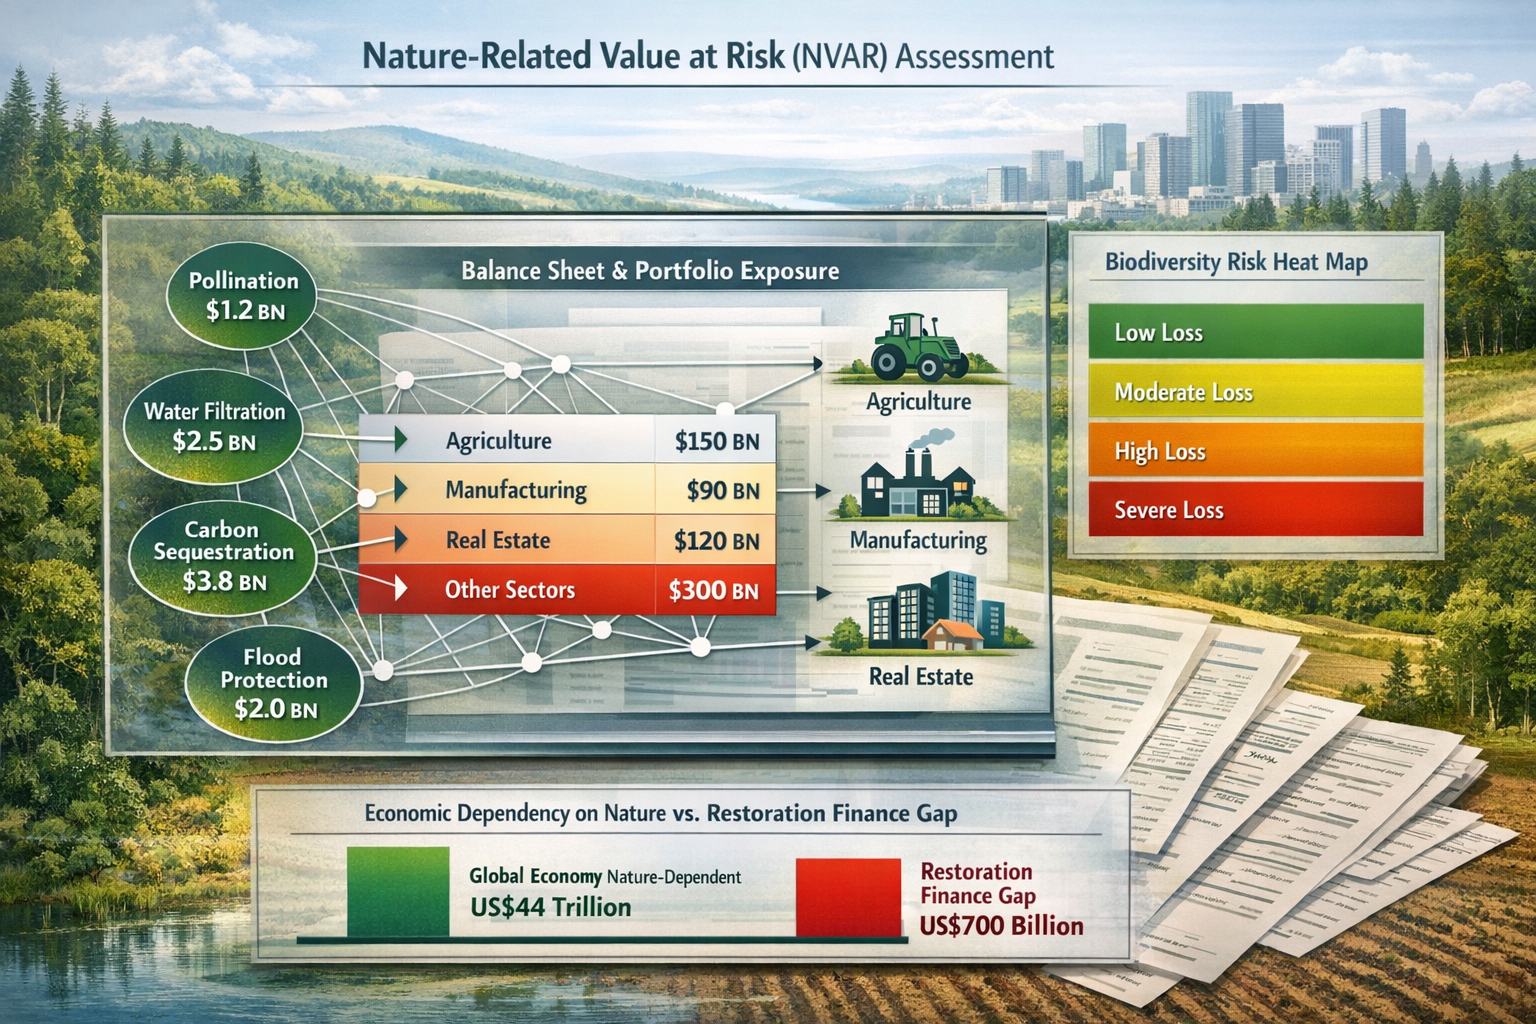
- Nature-related value at risk (NVAR) frameworks enable financial institutions to estimate portfolio exposure to biodiversity loss using macroeconomic modeling combined with ecosystem service valuations.[2]
Understanding Nature Loss as Financial Materiality
The Business Case for Biodiversity Measurement
Financial materiality traditionally focused on factors that directly impact a company's bottom line—revenue, costs, assets, and liabilities. In 2026, biodiversity loss has joined this list as a systemic business risk that maps across virtually every sector of the global economy.[3]
The concept is straightforward yet profound: when ecosystems degrade, they provide fewer services. When services decline, businesses face:
- Operational disruptions from resource scarcity (water, timber, fish stocks)
- Regulatory penalties as governments tighten environmental compliance standards
- Reputational damage from stakeholder scrutiny and consumer backlash
- Supply chain vulnerabilities when agricultural yields drop or raw materials become scarce
- Asset devaluation as nature-dependent properties lose value
The IPBES Business and Biodiversity Assessment released in February 2026 identified over 100 actionable recommendations to help companies, governments, and financial institutions measure, manage, and reduce biodiversity impacts while contributing to restoration.[5] These recommendations emphasize that biodiversity measurement is no longer optional—it's a fiduciary responsibility.
Double Materiality: How Nature Affects Business and Vice Versa
Double materiality assessments have become the gold standard for comprehensive sustainability analysis in 2026.[4] This framework evaluates two critical dimensions:
- Financial materiality: How biodiversity loss affects business performance, profitability, and shareholder value
- Impact materiality: How business operations affect ecosystems, species populations, and ecological functions
For developers and planners working with biodiversity requirements, double materiality provides a structured approach to understanding both regulatory risk and environmental responsibility. A construction project, for example, must assess:
- How habitat destruction affects local pollinator populations (impact materiality)
- How future pollination service decline might affect property values and landscaping costs (financial materiality)
This dual perspective transforms biodiversity from an abstract environmental concern into a concrete business consideration with measurable financial implications.
Quantifying the US$44 Trillion Nature Dependency
The figure of US$44 trillion in nature-dependent economic output represents more than half of global GDP.[1] But how do financial analysts arrive at such numbers, and what does this mean for individual businesses?
Nature dependency mapping breaks down economic sectors by their reliance on specific ecosystem services:
| Sector | Primary Nature Dependencies | Estimated Value at Risk |
|---|---|---|
| Agriculture | Pollination, soil health, water regulation | High |
| Manufacturing | Raw materials, water supply, climate regulation | Medium-High |
| Real Estate | Flood protection, temperature regulation, aesthetic value | Medium |
| Tourism | Biodiversity, scenic landscapes, recreational ecosystems | High |
| Insurance | Climate stability, disaster mitigation services | Very High |
Understanding Nature Loss Financial Materiality: Biodiversity Survey Techniques to Quantify Ecosystem Service Decline in 2026 requires moving beyond sector-level estimates to asset-specific assessments. This is where biodiversity survey techniques become indispensable.
Biodiversity Survey Techniques for Ecosystem Service Valuation
Traditional Ecological Survey Methods
Biodiversity surveys have evolved significantly, but foundational field techniques remain essential for accurate ecosystem service quantification. Professional surveyors employ multiple complementary methods:
🔍 Habitat Classification and Condition Assessment
The first step in any biodiversity net gain assessment involves systematically categorizing habitats according to standardized classification systems. In the UK, this typically means using:
- UK Habitat Classification (UKHab) protocols
- Condition assessment criteria based on species richness, structural diversity, and disturbance indicators
- Spatial mapping using GPS coordinates and GIS software
Each habitat type receives a distinctiveness score (ranging from very low to very high) and a condition score (poor, moderate, good), which together determine its biodiversity value.
🦋 Species Surveys and Population Monitoring
Quantifying ecosystem service decline requires baseline data on species populations. Surveyors use targeted techniques including:
- Point count surveys for bird populations (indicators of insect abundance and habitat health)
- Transect walks for butterfly and pollinator monitoring
- Pitfall traps and sweep netting for invertebrate diversity assessment
- Camera traps for mammal presence and behavior documentation
- Acoustic monitoring for bat species identification and activity patterns
- Environmental DNA (eDNA) sampling for aquatic species detection
These surveys provide quantitative data on species richness (number of different species) and abundance (population sizes), both critical indicators of ecosystem function.
🌱 Vegetation Quadrat Analysis
Quadrat sampling—systematically analyzing small, defined areas—enables precise measurement of:
- Plant species composition and diversity
- Percentage ground cover by vegetation type
- Invasive species presence and spread
- Indicator species that signal specific ecosystem conditions
For financial materiality assessments, vegetation data translates directly to ecosystem service valuations. Dense native vegetation, for example, provides measurable carbon sequestration, erosion control, and water filtration services.
Advanced Technology-Enabled Survey Techniques
In 2026, biodiversity surveying has embraced technological innovation, dramatically improving the speed, accuracy, and cost-effectiveness of ecosystem service quantification.
🛰️ Remote Sensing and Satellite Imagery
Satellite technology enables landscape-scale biodiversity assessment without extensive ground surveys. Key applications include:
- Normalized Difference Vegetation Index (NDVI) analysis to measure vegetation health and biomass
- Land cover change detection to track habitat loss over time
- Thermal imaging to identify water stress and ecosystem degradation
- Multispectral analysis to distinguish habitat types and vegetation communities
Financial institutions increasingly use remote sensing data to assess nature-related value at risk (NVAR) across investment portfolios, identifying properties and assets in regions experiencing rapid ecosystem decline.[2]
🚁 Drone-Based Aerial Surveys
Unmanned aerial vehicles (UAVs) have revolutionized biodiversity surveying by providing:
- High-resolution imagery for habitat mapping and condition assessment
- 3D terrain modeling to calculate habitat area and structural complexity
- Repeat surveys to monitor restoration progress or degradation trends
- Access to difficult terrain without disturbing sensitive species
For developers planning biodiversity net gain strategies, drone surveys offer rapid baseline assessments and ongoing monitoring capabilities at a fraction of traditional survey costs.
🧬 Environmental DNA (eDNA) Analysis
Perhaps the most transformative innovation in biodiversity surveying, eDNA technology detects species presence through genetic material in water, soil, or air samples. Benefits include:
- Non-invasive detection of rare or elusive species
- Comprehensive species inventories from single samples
- Early warning systems for invasive species arrival
- Cost-effective monitoring across large areas or multiple sites
For ecosystem service valuation, eDNA provides robust data on aquatic biodiversity—a critical indicator of water quality services worth billions to downstream users.
📱 Artificial Intelligence and Machine Learning
AI-powered tools are transforming how surveyors process and interpret biodiversity data:
- Automated species identification from photographs and audio recordings
- Predictive modeling of habitat suitability and species distribution
- Pattern recognition to detect ecosystem degradation signals
- Data integration platforms that combine multiple survey types into unified assessments
According to January 2026 case studies, companies increasingly use biodiversity data and screening tools—including public datasets and risk mapping platforms—though primarily for scoping and prioritization rather than operational decision-making.[3] The challenge for 2026 and beyond is closing this gap between data collection and practical application.
The TNFD LEAP Framework for Systematic Assessment
The Task Force on Nature-related Financial Disclosures (TNFD) has established the LEAP approach as the standard science-based process for integrating biodiversity surveys with financial risk management.[4] This framework guides organizations through four phases:
L – Locate: Identify where your operations and value chain intersect with nature, using geospatial analysis to pinpoint high-priority sites.
E – Evaluate: Assess dependencies and impacts at priority locations using biodiversity surveys, ecosystem service valuations, and stakeholder engagement.
A – Assess: Determine material risks and opportunities by combining survey data with scenario analysis and financial modeling.
P – Prepare: Develop disclosure strategies, set targets, and integrate findings into corporate reporting and decision-making.
Understanding biodiversity net gain requirements aligns naturally with the LEAP framework, as both emphasize systematic measurement, transparent reporting, and continuous improvement.
Quantifying Ecosystem Service Decline: From Ecology to Economics
Ecosystem Services Classification and Valuation Methods
Translating biodiversity survey data into financial metrics requires understanding the four categories of ecosystem services:
1. Provisioning Services (direct products from ecosystems)
- Food production (crops, livestock, fish, wild foods)
- Fresh water supply
- Timber and fiber
- Genetic resources and medicines
2. Regulating Services (benefits from ecosystem processes)
- Climate regulation through carbon sequestration
- Water purification and waste treatment
- Pollination of crops
- Flood and erosion control
- Disease regulation
3. Cultural Services (non-material benefits)
- Recreation and ecotourism
- Aesthetic and spiritual values
- Educational opportunities
- Cultural heritage
4. Supporting Services (foundational processes)
- Soil formation and nutrient cycling
- Primary production (photosynthesis)
- Habitat provision for species
For Nature Loss Financial Materiality: Biodiversity Survey Techniques to Quantify Ecosystem Service Decline in 2026, the focus centers on services with clear economic value. The most commonly applied valuation methods include:
💰 Market Price Method
When ecosystem services have direct market equivalents, valuation is straightforward. For example:
- Timber from forests = market lumber prices
- Fish from healthy aquatic ecosystems = seafood market values
- Carbon sequestration = carbon credit market prices
💰 Replacement Cost Method
This approach calculates what it would cost to replace ecosystem services with human-made alternatives:
- Natural water filtration by wetlands vs. water treatment plant costs
- Pollination by wild insects vs. hand-pollination labor costs
- Flood protection by floodplains vs. levee and dam construction
💰 Hedonic Pricing
Property values reflect ecosystem service benefits, allowing analysts to extract nature's contribution:
- Premium prices for properties near parks, green spaces, or water bodies
- Property value increases from urban tree canopy and biodiversity
- Tourism revenue generated by biodiversity-rich destinations
💰 Contingent Valuation
Survey-based methods ask stakeholders what they would pay to preserve specific ecosystem services or what compensation they would accept for their loss. While subjective, this captures cultural and non-use values.
Biodiversity Metrics and Unit Calculations
For developers and landowners, biodiversity net gain protocols provide standardized metrics that translate survey data into quantifiable units. The UK's statutory BNG framework exemplifies this approach:
Biodiversity Unit Calculation Formula:
Biodiversity Units = Habitat Area (hectares) × Habitat Distinctiveness × Habitat Condition × Strategic Significance × Temporal Multiplier
Each component derives from biodiversity survey data:
- Habitat Area: Precisely measured through field surveys or drone mapping
- Habitat Distinctiveness: Scored based on rarity and ecological value (2-8 points)
- Habitat Condition: Assessed through vegetation surveys and species inventories (1-3 multiplier)
- Strategic Significance: Determined by location within ecological networks
- Temporal Multiplier: Accounts for time lag between habitat loss and creation
This formula enables direct comparison between baseline conditions and post-development scenarios, quantifying whether projects achieve the mandatory 10% biodiversity net gain required for planning approval.
Understanding biodiversity unit costs is essential for financial planning, as units can be purchased through statutory credits or off-site habitat banking arrangements when on-site delivery is insufficient.
Measuring Ecosystem Service Decline Over Time
Quantifying decline requires temporal baseline data—comparing current conditions against historical or reference states. Survey techniques for temporal analysis include:
📊 Repeat Survey Protocols
Conducting identical surveys at regular intervals (annually, every 5 years, etc.) to track:
- Species population trends (increasing, stable, declining)
- Habitat extent and condition changes
- Invasive species spread
- Vegetation community shifts
📊 Historical Data Analysis
Comparing current survey results against:
- Historical species records and museum collections
- Aerial photographs from previous decades
- Land use maps and planning documents
- Climate and environmental monitoring data
📊 Reference Site Comparisons
Measuring degraded sites against nearby intact ecosystems to quantify service loss:
- Carbon storage in degraded vs. healthy forests
- Water quality downstream of impacted vs. protected watersheds
- Pollinator abundance in intensive agriculture vs. diverse landscapes
For financial materiality assessments, the rate of decline matters as much as absolute values. Accelerating ecosystem degradation signals increasing business risk and urgent intervention needs.
Financial Risk Assessment and Nature-Related Value at Risk (NVAR)
Understanding NVAR Frameworks
Nature-related value at risk (NVAR) represents the potential financial loss from biodiversity decline and ecosystem service degradation.[2] This framework enables financial institutions to estimate portfolio exposure using macroeconomic modeling combined with ecosystem-specific data.
The NVAR calculation multiplies:
- Economy-level business value dependent on nature (sector-specific dependency percentages)
- Likelihood of nature-related shocks (probability of ecosystem service collapse)
- Potential impact magnitude (severity of service loss on operations)
- Economic resilience capacity (ability to adapt or substitute)
For example, an agricultural investment portfolio might show:
- 80% dependency on pollination services
- 30% probability of severe pollinator decline in next decade
- 40% potential yield reduction if decline occurs
- 20% resilience through alternative crop varieties or managed pollination
NVAR = Investment Value × 0.80 × 0.30 × 0.40 × (1 – 0.20) = 7.68% of portfolio value at risk
Sector-Specific Risk Mapping
Different industries face distinct nature-related financial risks. Biodiversity survey data informs sector-specific assessments:
🏗️ Real Estate and Development
Risks include:
- Regulatory delays from protected species presence
- Increased costs for biodiversity offsetting requirements
- Property devaluation in flood-prone areas losing natural protection
- Reputational damage from habitat destruction
Survey techniques: Habitat assessments, protected species surveys, flood risk modeling
🌾 Agriculture and Food Production
Risks include:
- Crop yield reductions from pollinator decline
- Soil degradation reducing productivity
- Water scarcity from watershed degradation
- Supply chain disruptions from ecosystem collapse
Survey techniques: Pollinator monitoring, soil biodiversity analysis, watershed health assessments
💧 Water-Intensive Industries
Risks include:
- Water supply shortages from aquifer depletion
- Increased treatment costs from declining natural filtration
- Regulatory restrictions in water-stressed regions
- Operational shutdowns during extreme droughts
Survey techniques: Aquatic biodiversity surveys, wetland condition assessments, hydrological monitoring
🏭 Manufacturing and Extractive Industries
Risks include:
- Raw material scarcity from resource depletion
- License denials in biodiverse areas
- Remediation costs for ecosystem damage
- Stakeholder opposition and legal challenges
Survey techniques: Baseline ecological surveys, impact assessments, restoration monitoring
Integrating Biodiversity Data into Investment Decisions
The January 2026 case studies reveal a critical gap: while companies increasingly use biodiversity data and screening tools, they primarily apply these for scoping and prioritization rather than operational decision-making.[3] Closing this gap requires:
🎯 Standardized Reporting Frameworks
Consistent metrics enable comparison across investments:
- TNFD disclosure recommendations
- Science-Based Targets for Nature (SBTN) guidance
- EU Taxonomy alignment for nature-positive activities
- Global Biodiversity Framework indicators
🎯 Geospatial Risk Mapping
Overlaying biodiversity survey data with asset locations:
- Identifying properties in high-biodiversity areas
- Mapping supply chain exposure to ecosystem risks
- Prioritizing due diligence for high-risk investments
- Monitoring portfolio-wide nature trends
🎯 Scenario Analysis and Stress Testing
Modeling how different ecosystem decline scenarios affect portfolio performance:
- Baseline scenario (current trends continue)
- Optimistic scenario (restoration efforts succeed)
- Pessimistic scenario (accelerated degradation)
- Regulatory scenario (strict environmental policies implemented)
Developers seeking to achieve biodiversity net gain can use these same frameworks to demonstrate investment attractiveness and regulatory compliance.
The Restoration Finance Gap and Investment Opportunities
Current State of Nature Finance
The State of Finance for Nature 2026 report reveals a stark reality: restoration finance must quadruple from US$64 billion (2022 levels) to US$296 billion by 2030 to achieve global restoration targets while supporting climate and biodiversity goals.[6]
Currently, governments provide nearly three-quarters of restoration finance, while private capital flows remain insufficient for nature-positive outcomes.[6] This creates both challenges and opportunities:
Challenges:
- Public funding alone cannot bridge the US$232 billion annual gap
- Private investors lack standardized risk-return metrics for nature investments
- Long payback periods deter short-term capital
- Uncertain regulatory frameworks create investment hesitation
Opportunities:
- Growing corporate demand for biodiversity credits and offsets
- Emerging markets for ecosystem service payments
- Green bonds and sustainability-linked loans tied to nature outcomes
- Biodiversity unit trading platforms creating liquidity
Biodiversity Net Gain as an Investment Framework
The UK's statutory Biodiversity Net Gain requirement exemplifies how regulation creates investable opportunities. Developers must demonstrate 10% net gain, which can be achieved through:
On-site Delivery
- Habitat creation and enhancement within development boundaries
- Green infrastructure integration
- Long-term management commitments
Off-site Delivery
- Purchasing biodiversity units from habitat banks
- Investing in landscape-scale restoration projects
- Supporting strategic ecological networks
Statutory Credits
- Government-issued credits as last resort
- Higher cost incentivizes on-site and off-site solutions
- Revenue funds national habitat creation
This creates multiple investment entry points:
- Habitat Banking: Landowners can sell biodiversity units generated through habitat creation and restoration
- Biodiversity Credit Aggregation: Platforms connecting developers with unit suppliers
- Restoration Project Finance: Funding habitat creation with revenue from unit sales
- Advisory Services: Consulting on optimal BNG strategies and implementation
Guidance for landowners emphasizes the long-term revenue potential from biodiversity unit generation, particularly for marginal agricultural land suitable for habitat restoration.
Blended Finance Models for Nature Restoration
Bridging the restoration finance gap requires innovative funding structures that combine public, private, and philanthropic capital:
🌿 Payment for Ecosystem Services (PES) Schemes
Direct payments to landowners for maintaining or enhancing ecosystem services:
- Water utilities paying upstream landowners for watershed protection
- Carbon markets rewarding forest conservation and restoration
- Pollination credits for farmers maintaining pollinator habitat
- Flood risk reduction payments for wetland restoration
🌿 Green Bonds and Sustainability-Linked Instruments
Debt instruments with proceeds earmarked for nature-positive projects:
- Biodiversity bonds financing habitat restoration
- Sustainability-linked loans with interest rates tied to nature metrics
- Conservation impact bonds with returns based on ecological outcomes
🌿 Public-Private Partnerships
Government co-investment reducing private sector risk:
- Matching funds for habitat creation projects
- Risk guarantees for nature-based infrastructure
- Tax incentives for biodiversity investments
- Streamlined permitting for restoration projects
Measuring Return on Investment in Nature
For Nature Loss Financial Materiality: Biodiversity Survey Techniques to Quantify Ecosystem Service Decline in 2026, demonstrating financial returns from nature investments is crucial. Biodiversity surveys provide the data foundation for ROI calculations:
Direct Financial Returns:
- Biodiversity unit sales revenue
- Carbon credit income from restored ecosystems
- Recreational access fees and ecotourism
- Sustainable harvest of forest products
Risk Mitigation Value:
- Avoided regulatory penalties and project delays
- Reduced insurance premiums for natural disaster protection
- Enhanced property values from ecosystem amenities
- Supply chain resilience from diversified natural resources
Reputational and Market Access Benefits:
- Improved ESG ratings attracting investors
- Customer preference for nature-positive brands
- License to operate in sensitive regions
- Competitive advantage in sustainability-conscious markets
Rigorous biodiversity monitoring—using the survey techniques outlined earlier—provides the evidence base for quantifying these returns and attracting capital to restoration projects.
Practical Implementation: From Survey to Strategy
Conducting a Baseline Biodiversity Assessment
For organizations beginning their nature materiality journey, a comprehensive baseline assessment is essential. The process typically follows these steps:
Step 1: Scope Definition
- Identify all sites, operations, and value chain segments to assess
- Determine geographic boundaries and temporal scope
- Select appropriate survey methodologies based on habitats present
- Establish budget and timeline
Step 2: Desk-Based Research
- Review existing ecological data and historical records
- Analyze aerial imagery and land use maps
- Identify designated sites (SSSIs, protected areas, ecological networks)
- Consult statutory biodiversity records and databases
Step 3: Field Surveys
- Conduct habitat classification and condition assessments
- Perform species-specific surveys (breeding birds, bats, great crested newts, etc.)
- Document protected and notable species presence
- Map habitat boundaries with GPS accuracy
- Photograph representative areas and key features
Step 4: Data Analysis and Reporting
- Calculate biodiversity units using standardized metrics
- Identify ecosystem services provided and their estimated values
- Assess compliance with regulatory requirements
- Highlight opportunities for enhancement
- Provide recommendations for impact avoidance and mitigation
Professional biodiversity surveyors bring expertise in survey design, species identification, and regulatory compliance—critical for defensible baseline assessments that withstand scrutiny from planners and investors.
Developing a Nature-Positive Strategy
Armed with baseline data, organizations can develop comprehensive strategies addressing both financial materiality and impact materiality:
🎯 Set Science-Based Targets
Align with global frameworks:
- Contribute to 30×30 goals (protecting 30% of land and sea by 2030)
- Support Global Biodiversity Framework objectives
- Adopt Science-Based Targets for Nature (SBTN) guidance
- Commit to no net loss or net gain outcomes
🎯 Prioritize High-Impact Actions
Focus resources where they matter most:
- Address direct dependencies and impacts first
- Target geographies with highest biodiversity value
- Tackle value chain segments with greatest leverage
- Sequence actions for maximum cumulative benefit
🎯 Integrate Across Functions
Embed nature considerations throughout operations:
- Procurement: Source from nature-positive suppliers
- Design: Incorporate green infrastructure and habitat features
- Operations: Minimize pollution and resource consumption
- Finance: Link executive compensation to nature metrics
- Reporting: Disclose nature risks and opportunities transparently
🎯 Engage Stakeholders
Build coalitions for landscape-scale impact:
- Collaborate with conservation organizations
- Partner with neighboring landowners
- Engage local communities in restoration
- Share best practices with industry peers
Monitoring, Reporting, and Verification
Credible nature claims require robust monitoring systems using the same biodiversity survey techniques employed for baseline assessment:
Annual Monitoring Programs
Regular surveys track progress toward targets:
- Habitat condition assessments
- Key species population trends
- Invasive species management effectiveness
- Restoration project establishment success
Third-Party Verification
Independent audits provide assurance:
- Certified ecologists validate survey methodology
- Biodiversity unit calculations reviewed
- Ecosystem service valuations verified
- Compliance with standards confirmed
Transparent Disclosure
Public reporting builds trust and accountability:
- TNFD-aligned disclosures in annual reports
- Biodiversity net gain registration and monitoring
- Ecosystem service values and trends
- Lessons learned and adaptive management approaches
Achieving biodiversity net gain without risk requires this comprehensive monitoring framework, ensuring legal obligations are met while demonstrating genuine environmental improvement.
Regulatory Landscape and Compliance Requirements
UK Biodiversity Net Gain Mandate
Since February 2024, all qualifying developments in England must deliver 10% biodiversity net gain as a condition of planning permission. In 2026, this requirement has become fully embedded in development practice, with clear implications for financial materiality:
Compliance Costs:
- Professional biodiversity surveys (£3,000-£15,000+ depending on site complexity)
- Habitat creation and management (£10,000-£100,000+ per hectare)
- Biodiversity unit purchases (£42,000-£650,000+ per unit depending on habitat type)
- Long-term monitoring and reporting (ongoing annual costs)
Financial Risks of Non-Compliance:
- Planning application refusal
- Project delays and holding costs
- Enforcement actions and penalties
- Reputational damage affecting future projects
Financial Opportunities:
- Landowners generating biodiversity units for sale
- Developers achieving competitive advantage through exemplary BNG
- Investors accessing nature-positive development opportunities
- Consultants providing specialized BNG services
Small development projects face particular challenges balancing compliance costs against project budgets, making efficient survey techniques and strategic planning essential.
Global Regulatory Trends
The UK's BNG framework exemplifies a global trend toward mandatory nature accounting and disclosure:
European Union:
- Nature Restoration Law requiring ecosystem restoration targets
- Corporate Sustainability Reporting Directive (CSRD) mandating biodiversity disclosure
- EU Taxonomy defining nature-positive economic activities
- Deforestation Regulation restricting imports linked to ecosystem destruction
International Frameworks:
- Kunming-Montreal Global Biodiversity Framework (30×30 targets)
- TNFD recommendations gaining voluntary adoption
- Science-Based Targets for Nature (SBTN) providing corporate guidance
- Taskforce on Nature Markets developing biodiversity credit standards
National Initiatives:
- Australia's Nature Repair Market creating biodiversity trading
- Colombia's Payment for Ecosystem Services programs
- Costa Rica's long-established PES schemes
- Brazil's Environmental Reserve Quota system
For multinational corporations, Nature Loss Financial Materiality: Biodiversity Survey Techniques to Quantify Ecosystem Service Decline in 2026 must account for this evolving patchwork of regulations, requiring flexible survey and reporting systems adaptable to different jurisdictions.
Emerging Disclosure Standards
The Task Force on Nature-related Financial Disclosures (TNFD) released its final recommendations in September 2023, with 2026 seeing rapid adoption across financial institutions and corporations.[8] The framework requires disclosure across four pillars:
Governance:
- Board oversight of nature-related risks and opportunities
- Management's role in assessment and response
- Integration into overall risk management
Strategy:
- Nature-related risks and opportunities over short, medium, and long term
- Impact on business model, strategy, and financial planning
- Resilience under different scenarios
Risk and Impact Management:
- Processes for identifying and assessing nature-related risks
- Processes for managing nature-related risks
- Integration with overall risk management
Metrics and Targets:
- Metrics used to assess nature-related risks and opportunities
- Scope 1, 2, and 3 emissions equivalent for nature (direct and value chain impacts)
- Targets and performance against targets
Biodiversity survey data provides the foundation for credible TNFD disclosure, particularly for metrics related to:
- Ecosystem extent (hectares of habitat types)
- Ecosystem condition (habitat quality scores)
- Species populations (abundance and trends)
- Ecosystem services (provision and value)
Case Studies: Biodiversity Surveys Driving Financial Decisions
Case Study 1: Agricultural Investment Portfolio Reassessment
Challenge: A £500 million agricultural investment fund needed to assess nature-related value at risk across 50 farm properties following IPBES warnings about pollinator decline and soil degradation.[5]
Survey Approach:
- Drone-based habitat mapping across all properties
- Targeted pollinator surveys during peak flowering season
- Soil biodiversity analysis using eDNA techniques
- Ecosystem service valuation for pollination, carbon storage, and water regulation
Findings:
- 35% of properties showed severe pollinator decline
- Estimated £15 million annual value at risk from reduced pollination services
- Soil degradation threatening long-term productivity on 40% of holdings
- Total NVAR calculated at 12% of portfolio value over 10-year horizon
Financial Response:
- Implemented pollinator-friendly management across all properties
- Invested £2 million in habitat creation and restoration
- Negotiated agri-environment scheme payments offsetting costs
- Enhanced portfolio resilience and ESG ratings
- Avoided estimated £15 million in productivity losses
Outcome: Biodiversity surveys transformed abstract environmental concerns into quantified financial risks, justifying proactive investment in nature-positive management.
Case Study 2: Real Estate Development BNG Compliance
Challenge: A 50-hectare mixed-use development required 10% biodiversity net gain, with site surveys revealing presence of protected species and high-value habitats.
Survey Approach:
- Phase 1 habitat survey identifying habitat types and condition
- Protected species surveys (great crested newts, badgers, breeding birds, bats)
- Biodiversity metric calculation showing baseline of 85 biodiversity units
- Assessment of on-site enhancement potential
Findings:
- Development would result in 60 biodiversity unit loss
- 10% net gain required delivering 93.5 units post-development
- Total requirement: 153.5 units (60 lost + 93.5 for net gain)
- On-site delivery could provide maximum 40 units
- Off-site requirement: 113.5 units
Financial Response:
- Purchased biodiversity units from nearby habitat bank (£48,000 per unit = £5.45 million)
- Integrated green infrastructure providing 40 on-site units
- Secured planning permission without delays
- Enhanced property values through biodiversity features
- Differentiated development in competitive market
Outcome: Comprehensive biodiversity surveys enabled accurate financial planning for BNG compliance, avoiding costly delays and demonstrating environmental leadership.
Case Study 3: Supply Chain Biodiversity Risk Assessment
Challenge: A global food manufacturer needed to assess biodiversity risks across its cocoa supply chain following investor pressure for TNFD disclosure.
Survey Approach:
- Remote sensing analysis of 500+ supplier farms
- Ground-truth surveys at representative sample sites
- Ecosystem service dependency mapping
- Scenario modeling for deforestation and climate impacts
Findings:
- 40% of suppliers operating in high-biodiversity areas
- Deforestation trends threatening 25% of supply base
- Water scarcity risks affecting 30% of suppliers
- Estimated £80 million value at risk from ecosystem degradation
Financial Response:
- Launched supplier certification program requiring biodiversity standards
- Invested £5 million in agroforestry and habitat restoration
- Diversified sourcing to reduce geographic concentration
- Developed TNFD-aligned disclosure demonstrating risk management
- Enhanced brand reputation and investor confidence
Outcome: Biodiversity surveys across the value chain revealed material financial risks, driving strategic sourcing changes and transparent disclosure.
Future Directions: Innovation in Biodiversity Measurement
Artificial Intelligence and Automated Monitoring
The integration of AI with biodiversity survey techniques is accelerating in 2026, with transformative implications for financial materiality assessment:
🤖 Automated Species Identification
- Camera trap images processed instantly for species recognition
- Audio recordings analyzed for bird and bat species presence
- Insect monitoring using AI-powered image recognition
- Continuous monitoring replacing periodic manual surveys
🤖 Predictive Ecosystem Modeling
- Machine learning algorithms forecasting ecosystem trajectories
- Early warning systems for degradation thresholds
- Scenario analysis for climate and land use change impacts
- Optimization tools for restoration investment allocation
🤖 Real-Time Risk Dashboards
- Integration of satellite data, weather patterns, and biodiversity trends
- Automated alerts when ecosystem metrics cross thresholds
- Portfolio-level aggregation of nature-related risks
- Dynamic NVAR calculations updating with new data
These technologies promise to dramatically reduce the cost and increase the frequency of biodiversity monitoring, enabling more responsive risk management and investment decisions.
Blockchain and Biodiversity Credit Verification
Emerging blockchain applications aim to solve transparency and verification challenges in biodiversity markets:
- Immutable monitoring records preventing greenwashing
- Automated smart contracts for biodiversity credit transactions
- Transparent supply chains tracking nature-positive claims
- Fractional ownership of restoration projects enabling smaller investments
Integration with Climate and Social Metrics
The convergence of nature, climate, and social considerations is reshaping sustainability strategy:
🌡️ Nature-Climate Co-Benefits
- Restoration projects delivering both biodiversity and carbon outcomes
- Integrated accounting for ecosystem carbon storage
- Climate adaptation through nature-based solutions
- Synergistic target-setting across environmental dimensions
👥 Just Transition and Biodiversity
- Community engagement in restoration projects
- Livelihood opportunities from ecosystem service payments
- Indigenous knowledge integration in biodiversity monitoring
- Equitable benefit-sharing from nature finance
📊 Unified ESG Frameworks
- Single reporting systems covering E, S, and G dimensions
- Integrated materiality assessments
- Holistic risk management approaches
- Investor tools evaluating comprehensive sustainability performance
Conclusion: Turning Nature Loss into Financial Action
The evidence is unequivocal: nature loss represents material financial risk that no investor, developer, or corporate leader can afford to ignore in 2026. With US$44 trillion in economic output dependent on biodiversity,[1] and restoration finance needing to quadruple to US$296 billion annually by 2030,[6] the business case for action has never been stronger.
Nature Loss Financial Materiality: Biodiversity Survey Techniques to Quantify Ecosystem Service Decline in 2026 provides the methodological foundation for transforming this challenge into opportunity. From traditional field surveys to cutting-edge eDNA analysis and AI-powered monitoring, biodiversity measurement techniques have evolved to deliver the precision, scalability, and cost-effectiveness required for financial decision-making.
The IPBES Business and Biodiversity Assessment's 100+ actionable recommendations[5] chart a clear path forward, while frameworks like TNFD LEAP[4] and statutory requirements like UK Biodiversity Net Gain provide structured implementation pathways. The tools exist; what's needed now is widespread adoption and integration into core business processes.
Actionable Next Steps
For organizations ready to address nature-related financial materiality:
✅ Immediate Actions (Next 30 Days):
- Conduct initial screening of operations and value chains for nature dependencies and impacts
- Engage professional biodiversity surveyors for baseline assessments at priority sites
- Review existing environmental data for gaps in ecosystem service information
- Assess regulatory requirements including BNG obligations and disclosure standards
- Establish internal working group bringing together finance, operations, sustainability, and legal functions
✅ Short-Term Actions (Next 3-6 Months):
- Complete comprehensive biodiversity surveys using techniques appropriate to your context
- Calculate biodiversity metrics and ecosystem service values for material sites
- Conduct NVAR assessment to quantify financial exposure to nature-related risks
- Develop nature-positive strategy with science-based targets and clear timelines
- Integrate findings into financial planning and risk management systems
- Begin stakeholder engagement with investors, regulators, and conservation partners
✅ Long-Term Actions (Next 12-24 Months):
- Implement monitoring programs tracking biodiversity and ecosystem service trends
- Disclose nature-related risks and opportunities following TNFD recommendations
- Invest in restoration and enhancement projects delivering measurable outcomes
- Participate in biodiversity markets as appropriate (purchasing or selling units)
- Share lessons learned contributing to industry best practices
- Advocate for supportive policies enabling nature-positive business models
The transition to a nature-positive economy is underway, driven by scientific evidence, regulatory momentum, and investor pressure. Organizations that proactively measure, manage, and disclose their nature-related financial materiality will gain competitive advantage, access capital more easily, and build resilience against ecosystem degradation.
Professional biodiversity surveyors stand ready to support this transition with the technical expertise, survey methodologies, and strategic guidance needed to turn environmental responsibility into financial opportunity. The question is no longer whether nature matters to business—it's how quickly organizations can develop the measurement systems and management strategies to thrive in a nature-constrained world.
The time for action is now. The techniques are proven. The financial imperative is clear. Nature loss financial materiality demands nothing less than a fundamental reimagining of how we value, measure, and manage our relationship with the living world upon which all prosperity ultimately depends. 🌍
References
[1] Financial Materiality Briefings – https://www.cisl.cam.ac.uk/resources/sustainable-finance-publications/financial-materiality-briefings
[2] Nature Risk Financial Portfolios – https://www.pwc.com/gx/en/issues/business-model-reinvention/how-we-fund-and-insure/nature-risk-financial-portfolios.html
[3] New Reports Show How Biodiversity Data Can Move Business From Commitment To Action – https://www.biodiversa.eu/2026/01/22/new-reports-show-how-biodiversity-data-can-move-business-from-commitment-to-action/
[4] Nature Related Financial Risk Sustainability Strategy Usa – https://cse-net.org/nature-related-financial-risk-sustainability-strategy-usa/
[5] New Global Science Highlights Business Risks Nature Loss 2026 02 10 En – https://environment.ec.europa.eu/news/new-global-science-highlights-business-risks-nature-loss-2026-02-10_en
[6] The State Of Finance For Nature Report Series – https://www.eld-initiative.org/en/projects/the-state-of-finance-for-nature-report-series
[7] Media Release – https://www.ipbes.net/bba-report/media-release
[8] Action On Nature What Can Financial Institutions Expect In 2026 – https://www.unepfi.org/themes/ecosystems/action-on-nature-what-can-financial-institutions-expect-in-2026/
[9] Ipbes Four Key Takeaways On How Nature Loss Threatens The Global Economy – https://www.carbonbrief.org/ipbes-four-key-takeaways-on-how-nature-loss-threatens-the-global-economy/
