
Groundbreaking research published in February 2026 has overturned decades of conservation practice: artificial light at twilight—not midnight—inflicts the greatest harm on nocturnal wildlife, yet current mitigation strategies focus on the wrong hours entirely[3]. This revelation arrives precisely as ecologists face mounting pressure to deliver accurate Biodiversity Net Gain (BNG) baselines across England's expanding urban fringes, where artificial light increasingly compromises habitat quality for moths, bats, and night-active plants.
Light Pollution Mapping in Nocturnal Biodiversity Surveys: Tools for Ecologists in 2026 Urban Fringe BNG has evolved from an optional enhancement to an essential protocol. As development projects push into peri-urban zones—those critical transition areas between cities and countryside—the ability to quantify artificial light impacts directly influences whether projects can demonstrate the mandatory 10% biodiversity gain now required under UK law.
Key Takeaways
- 🌅 Twilight sensitivity window: Recent research identifies twilight hours as the most critical period for nocturnal wildlife vulnerability to artificial light, requiring revised survey timing protocols
- 📊 Baseline accuracy imperative: Light pollution mapping is now essential for establishing credible biodiversity baselines in urban fringe BNG assessments, affecting habitat unit calculations
- 🛠️ Accessible technology: Sky Quality Meters, smartphone apps, and satellite data provide ecologists with practical tools ranging from £100 handheld devices to free global monitoring platforms
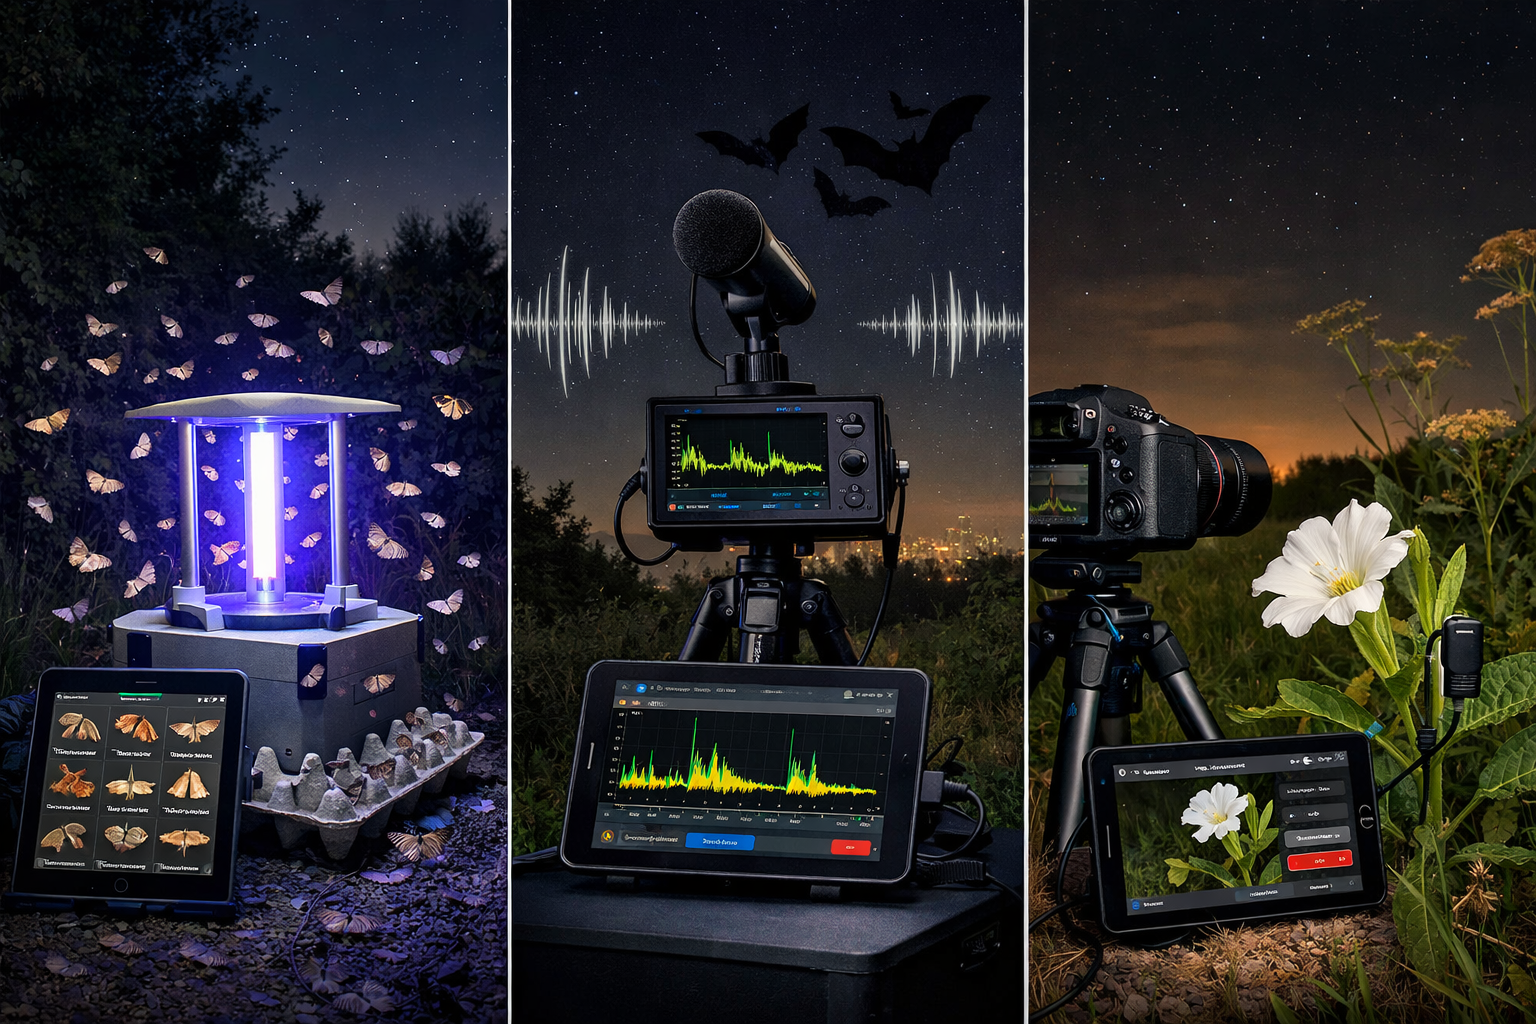
- 🦇 Multi-taxa approach: Effective surveys must integrate light measurements with species-specific monitoring for moths, bats, and plants to capture full ecological impacts
- ⚡ Rapid reversibility: European dimming trends demonstrate that light pollution can be reduced quickly through policy interventions, offering hope for mitigation strategies
Understanding Light Pollution's Role in Urban Fringe Biodiversity
The urban fringe represents one of the most ecologically complex landscapes in modern Britain. These transitional zones—where housing estates meet hedgerows, industrial parks border ancient woodlands, and street lighting bleeds into bat foraging corridors—present unique challenges for biodiversity assessment.
Artificial light fundamentally alters nocturnal ecosystems. Research confirms that light pollution disrupts natural behaviors across species: sea turtle hatchlings become disoriented and head away from oceans, birds collide with illuminated buildings or abandon traditional roosting sites, and nocturnal pollinators avoid lit areas entirely[5]. For ecologists conducting biodiversity impact assessments, these disruptions translate directly into reduced habitat quality and lower biodiversity unit values.
The Twilight Discovery That Changed Everything
The February 2026 study published in Current Biology fundamentally challenges conventional mitigation approaches. Researchers demonstrated that artificial light at typical street lighting levels simultaneously suppresses early-night activity and disrupts navigation in nocturnal insects and spiders[3]. The critical finding: wildlife vulnerability peaks during twilight hours, not the post-midnight periods that most current policies target.
This mismatch between ecological sensitivity and existing mitigation strategies has profound implications for BNG delivery. Developments that promise to "dim lights after midnight" or "switch off lamps during low-traffic hours" offer minimal protection to the species most affected by light pollution[3].
Why Urban Fringe Zones Demand Special Attention
Urban fringe habitats support disproportionately high biodiversity compared to both urban cores and intensively farmed countryside. These zones often contain:
- Remnant hedgerows serving as dark corridors for bat commuting
- Brownfield sites with rare invertebrate assemblages sensitive to light
- Woodland edges where moths and other nocturnal pollinators concentrate
- Water bodies attracting light-sensitive amphibians and aquatic insects
When developments occur in these areas, Biodiversity Net Gain assessments must account for light pollution as a habitat degradation factor. Failure to map and quantify artificial light impacts results in inflated baseline habitat quality scores—making it appear easier to achieve the required 10% gain than reality permits.
Essential Tools for Light Pollution Mapping in Nocturnal Biodiversity Surveys: 2026 Technology Guide
Modern ecologists have access to an unprecedented array of tools for quantifying artificial light. The technology landscape spans from sophisticated satellite systems to affordable handheld meters, each suited to different survey scales and budgets.
Satellite-Based Monitoring Systems
NASA's VIIRS (Visible Infrared Imaging Radiometer Suite) has revolutionized large-scale light pollution assessment. Analysis of 1.16 million satellite images collected over nine years demonstrates that sensors can now resolve individual light sources down to toll-booth scale on dark highways[4]. This resolution enables ecologists to:
✅ Map light pollution gradients across entire development sites
✅ Identify specific light sources contributing to skyglow
✅ Track temporal changes in artificial brightness
✅ Compare baseline conditions against regional trends
The ADRISKY regional project in the Adriatic-Ionian region demonstrates practical application of satellite data integration. This collaborative initiative leverages NASA imagery alongside the Anecdata platform for ground-truth data collection, supporting effective mitigation strategy development[1]. Similar approaches are now being adopted across UK urban fringe zones.
Global monitoring capabilities have matured significantly. Annual global light pollution change monitoring maps are now produced to evaluate impacts on biodiversity in cities and ecological protection areas, with users including UNEP and environmental protection organizations[2]. These datasets provide crucial context for local BNG assessments, showing whether a site experiences light pollution levels typical for its region or represents an outlier requiring special consideration.
Ground-Based Measurement Equipment
For site-specific surveys required in BNG assessments, ground-based instruments provide the precision necessary for habitat unit calculations:
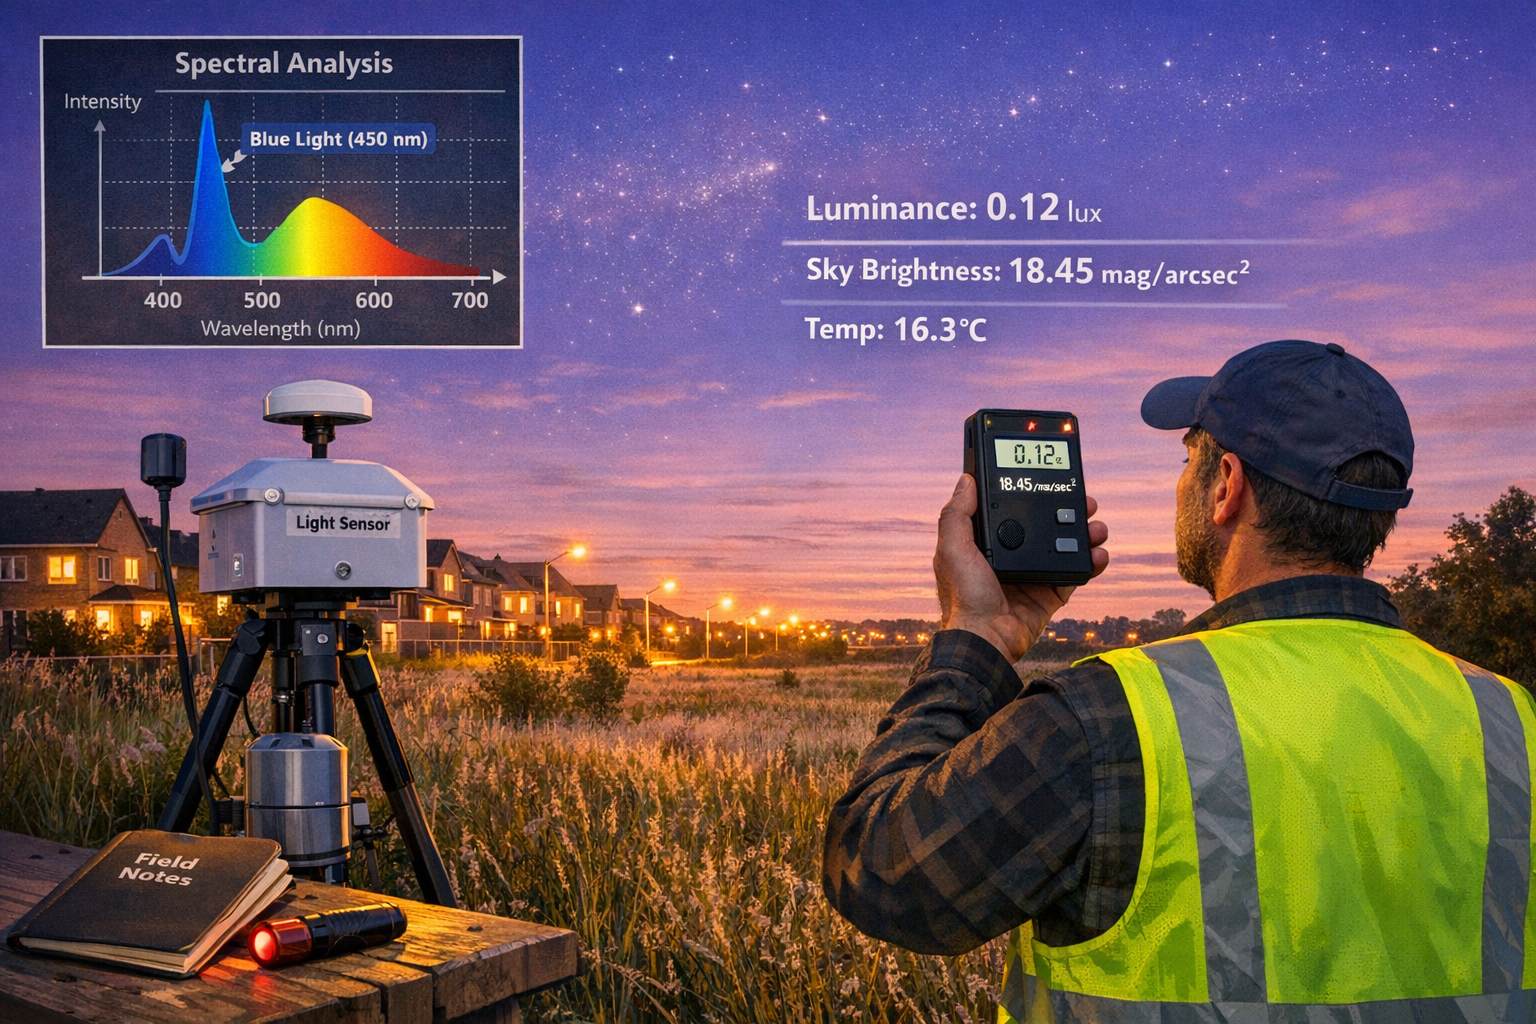
Sky Quality Meters (SQM) remain the gold standard for measuring night sky brightness. These handheld devices (£100-£400) measure sky luminance in magnitudes per square arcsecond—the standard unit for astronomical darkness. Darker skies produce higher magnitude readings (20+ mag/arcsec² indicates pristine dark sky; 15 mag/arcsec² indicates heavy light pollution).
Illuminance Meters measure horizontal and vertical light levels in lux, directly quantifying the light reaching vegetation, ground surfaces, and vertical features like hedgerows. Professional models (£200-£800) offer:
- Cosine-corrected sensors for accurate directional measurements
- Spectral response matching human photopic vision
- Data logging capabilities for continuous monitoring
- Waterproof housings for extended field deployment
Spectroradiometers (£1,500-£5,000) represent the premium option, measuring light intensity across specific wavelengths. This capability is crucial because the 2026 research emphasizes that LED spectra—particularly short-wavelength emissions—cause disproportionate ecological harm[3]. Spectral data enables ecologists to distinguish between different lighting technologies and recommend specific mitigation measures.
Smartphone Applications and Citizen Science Tools
Budget-conscious surveys can leverage smartphone applications with surprising accuracy:
- Loss of the Night (free): Guides users through naked-eye star visibility assessments, producing standardized light pollution measurements
- Dark Sky Meter (free): Uses smartphone cameras to estimate sky brightness, though accuracy varies by device
- Light Pollution Map (free): Provides crowd-sourced light pollution data and atlas overlays
While less precise than professional equipment, these tools enable rapid reconnaissance surveys and community engagement in monitoring programs—valuable for establishing biodiversity net gain strategies with local stakeholder buy-in.
Recommended Equipment Packages by Survey Scale
| Survey Scale | Primary Equipment | Cost Range | Best For |
|---|---|---|---|
| Reconnaissance | Smartphone apps, visual assessment | £0-£50 | Initial site screening, community surveys |
| Standard BNG | SQM, basic illuminance meter, GPS | £300-£600 | Typical development site baselines |
| Complex Sites | SQM, professional illuminance meter, data loggers | £800-£1,500 | Large developments, sensitive habitats |
| Research Grade | Spectroradiometer, automated monitoring stations | £2,000-£8,000 | Long-term monitoring, mitigation validation |
Light Pollution Mapping Protocols for Key Nocturnal Taxa in BNG Surveys
Light Pollution Mapping in Nocturnal Biodiversity Surveys: Tools for Ecologists in 2026 Urban Fringe BNG requires taxa-specific protocols that integrate light measurements with species monitoring. Different nocturnal groups respond to artificial light in distinct ways, demanding tailored survey approaches.
Moths and Nocturnal Invertebrates
Moths serve as indicator species for nocturnal invertebrate communities and represent a significant component of biodiversity unit calculations in grassland and woodland habitats. Light pollution affects moths through:
- Attraction and exhaustion: Moths drawn to artificial lights expend energy reserves and become vulnerable to predation
- Navigation disruption: Artificial light interferes with natural navigation using celestial cues
- Habitat avoidance: Many species avoid lit areas, effectively fragmenting habitat
Survey Protocol for Moths:
-
Establish transect routes from development site core through urban fringe to dark reference sites (minimum 500m from artificial light sources)
-
Measure light conditions at each survey point:
- Record sky brightness (SQM reading)
- Measure horizontal illuminance at ground level
- Document nearest light sources (type, distance, direction)
- Conduct surveys during twilight window (30 minutes before sunset to 2 hours after) based on 2026 sensitivity research[3]
-
Deploy standardized moth traps:
- Use consistent trap types (Robinson or Skinner traps)
- Position traps at varying light pollution levels
- Record ambient light conditions at each trap location
- Run traps for minimum 3 hours starting at dusk
-
Analyze abundance and diversity patterns:
- Compare species richness across light pollution gradient
- Identify light-sensitive indicator species
- Calculate diversity indices (Shannon, Simpson) for each light level
- Document rare or protected species distributions
Bats and Aerial Insectivores
Bats represent high-value species in BNG calculations due to legal protections and ecological importance. Different bat species show varying responses to artificial light:
- Light-tolerant species (pipistrelles): May exploit insect concentrations around lights
- Light-avoiding species (Myotis, horseshoe bats): Strictly avoid illuminated areas, leading to habitat fragmentation
- Context-dependent species (noctules, serotines): Response varies by light intensity and spectrum
Survey Protocol for Bats:
-
Conduct walked transects with bat detectors during activity peak periods:
- Begin surveys 15 minutes after sunset (aligned with twilight sensitivity window)
- Walk standardized routes at 1-2 km/hour
- Record continuous GPS tracks with synchronized detector data
-
Measure light conditions simultaneously:
- Use illuminance meter mounted on detector pole
- Log light readings every 10 seconds with GPS coordinates
- Note light source types and directions
-
Deploy static detectors at key locations:
- Position detectors along dark corridors (hedgerows, woodland edges)
- Place comparison detectors in lit areas
- Run for minimum 5 consecutive nights
- Record ambient light conditions at each location
-
Analyze activity patterns:
- Map bat activity intensity against light pollution levels
- Identify critical dark corridors requiring protection
- Quantify habitat quality reduction in lit areas
- Model connectivity between roosts and foraging areas
Night-Active Plants and Pollinators
Plant species with nocturnal flowering or pollination strategies suffer indirect impacts from light pollution when their pollinators avoid lit areas. This aspect is frequently overlooked in BNG assessments but can significantly affect habitat quality scores for species-rich grasslands and woodland edges.
Survey Protocol for Night-Pollinated Plants:
-
Identify target species during daytime botanical surveys:
- Night-flowering species (evening primrose, night-scented stock)
- Moth-pollinated species (honeysuckle, bladder campion)
- Species with nocturnal scent emission
-
Conduct nocturnal observation sessions:
- Visit plants during peak flowering (typically June-August)
- Record pollinator visits during twilight and early night
- Measure light conditions at plant locations
- Compare pollinator activity between lit and dark areas
-
Assess reproductive success:
- Count seed set in lit versus dark locations
- Measure fruit production differences
- Document population viability across light gradient
Integrated Multi-Taxa Survey Design
Efficient BNG surveys integrate multiple taxa within unified field sessions:
Night 1 (New Moon Period):
- Deploy moth traps at dusk
- Conduct bat detector transects (1-3 hours after sunset)
- Record light measurements at all survey points
- Check moth traps at 2-hour intervals
Night 2-4:
- Run static bat detectors continuously
- Conduct plant pollinator observations
- Repeat light measurements to assess variability
- Document weather conditions affecting results
Analysis Phase:
- Create GIS layers showing light pollution gradient
- Overlay species distribution and activity data
- Calculate habitat quality multipliers based on light impacts
- Model potential gains from lighting mitigation measures
This integrated approach ensures biodiversity impact assessments capture the full ecological consequences of artificial light while maintaining survey efficiency.
Integrating Light Pollution Data into BNG Calculations and Mitigation Strategies
The ultimate purpose of Light Pollution Mapping in Nocturnal Biodiversity Surveys: Tools for Ecologists in 2026 Urban Fringe BNG is translating field data into actionable BNG calculations and effective mitigation designs. This integration determines whether developments can achieve the mandatory 10% biodiversity net gain requirement.
Adjusting Habitat Condition Scores
The UK Biodiversity Metric 4.0 uses habitat condition assessments to calculate biodiversity units. Light pollution affects multiple condition criteria:
Habitat Connectivity: Artificial light fragments nocturnal habitat networks. When light pollution mapping reveals:
- Illuminance >1 lux along hedgerows: Reduce connectivity score by 1 level
- Illuminance >5 lux: Reduce by 2 levels (severe fragmentation)
- Dark corridors maintained (<0.5 lux): Maintain or increase connectivity score
Vegetation Structure: Night-active pollinators contribute to plant reproduction. Evidence of reduced pollinator activity in lit areas justifies:
- Reduced structural diversity scores in grasslands
- Lower regeneration potential in woodland edges
- Decreased habitat distinctiveness for moth-dependent plant communities
Disturbance Levels: Artificial light constitutes a disturbance factor. Document light pollution in condition assessment sheets:
- Quantify illuminance levels at habitat boundaries
- Note light source types and spectra
- Record temporal patterns (continuous vs. motion-activated)
Calculating Biodiversity Unit Impacts
Light pollution typically reduces baseline biodiversity units through:
- Lower habitat condition scores (as detailed above)
- Reduced habitat area (excluding heavily lit zones from calculations)
- Decreased strategic significance (when light pollution compromises ecological networks)
Example Calculation:
A 2-hectare species-rich hedgerow with moderate light pollution (3 lux average):
- Base distinctiveness: 6 (species-rich hedgerow)
- Condition without light consideration: Good (3.0)
- Condition adjusted for light impacts: Moderate (2.5)
- Strategic significance: Medium (1.15)
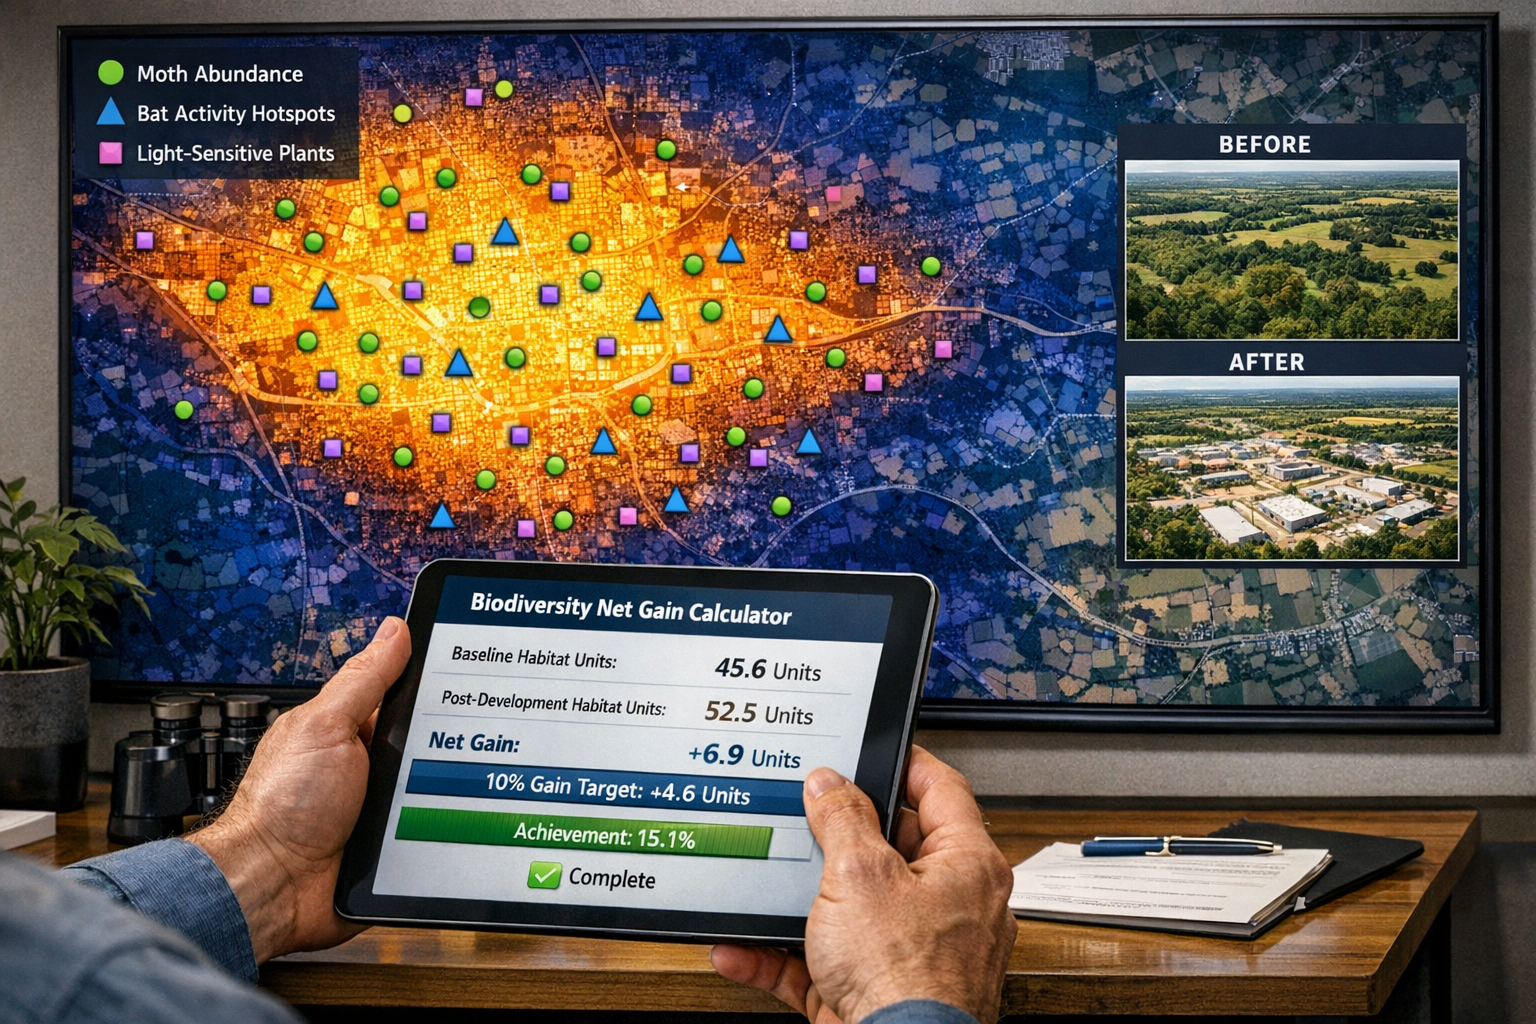
Without light adjustment: 2 ha × 6 × 3.0 × 1.15 = 41.4 biodiversity units
With light adjustment: 2 ha × 6 × 2.5 × 1.15 = 34.5 biodiversity units
The 6.9-unit difference (17% reduction) significantly affects the development's ability to demonstrate net gain. This underscores why accurate light pollution mapping is essential for credible biodiversity net gain assessments.
Evidence-Based Mitigation Design
The 2026 research provides clear guidance for effective mitigation measures that protect wildlife without compromising human safety[3]:
Twilight-Focused Interventions:
- Delay lighting activation until 2 hours after sunset (beyond peak wildlife sensitivity)
- Implement modest brightness reductions (30-50%) during twilight hours
- Use adaptive lighting that responds to actual human presence
Spectral Optimization:
- Specify warm-white LEDs (<3000K color temperature)
- Eliminate short-wavelength emissions where possible
- Use amber or red lighting in ecologically sensitive zones
Directional Control:
- Install full-cutoff fixtures preventing upward light spill
- Shield lights to eliminate horizontal light trespass
- Direct illumination only where human activity occurs
Spatial Planning:
- Maintain dark corridors along hedgerows and woodland edges
- Cluster lighting in core development areas
- Create buffer zones (minimum 50m) between lights and sensitive habitats
Monitoring and Adaptive Management
BNG delivery requires 30-year monitoring and management plans. For developments in urban fringe locations, these plans should include:
Year 1-3 (Establishment):
- Verify lighting installations meet specifications
- Conduct post-development light pollution mapping
- Compare nocturnal species activity against baseline
Year 4-10 (Early Management):
- Annual light measurements at key locations
- Biennial moth and bat surveys
- Adjust lighting protocols based on wildlife response
Year 11-30 (Long-term Monitoring):
- Five-yearly comprehensive surveys
- Technology upgrades as LED efficiency improves
- Adaptive management responding to climate change effects on species distributions
Off-Site Compensation Considerations
When on-site mitigation cannot achieve required gains, developers may need to purchase biodiversity units from off-site providers. Light pollution considerations affect this process:
- Dark sky restoration projects offer premium unit values in urban fringe contexts
- Nocturnal habitat creation (dark corridors, unlit woodland) provides targeted compensation
- Strategic off-site locations in genuinely dark areas maximize ecological benefit
Understanding the cost of biodiversity units helps developers evaluate whether on-site lighting mitigation or off-site compensation offers better value.
Regional Trends and Policy Context for 2026
Light Pollution Mapping in Nocturnal Biodiversity Surveys: Tools for Ecologists in 2026 Urban Fringe BNG operates within a rapidly evolving policy and technological landscape. Understanding regional trends helps ecologists contextualize site-specific findings and anticipate future requirements.
Divergent Global Trends in Artificial Light
Between 2015-2024, global nighttime light patterns showed dramatic regional variations. While nighttime light surged in China and northern India alongside urban development, European nations achieved significant dimming: France decreased 33%, the UK 22%, and the Netherlands 21%[4]. These reductions resulted partly from LED adoption and energy conservation measures—demonstrating that light pollution is reversible through policy intervention.
The energy crisis of 2022 following the Russia-Ukraine conflict accelerated European dimming trends, with nights becoming notably darker as energy conservation became a priority[4]. This natural experiment proved that light pollution can be reduced rapidly when political will and economic incentives align.
For UK ecologists, these trends mean:
✅ Baseline conditions are improving in many urban fringe areas, potentially increasing habitat quality
✅ LED transition continues, requiring updated spectral measurements in repeat surveys
✅ Policy momentum exists for further reductions, making ambitious mitigation proposals more feasible
✅ Precedents are established for temporary lighting reductions during sensitive periods
UK BNG Legislation and Light Pollution
While the Environment Act 2021 and secondary BNG legislation don't explicitly mandate light pollution assessment, the requirement for "measurable biodiversity outcomes" effectively necessitates it in urban fringe contexts. Planning authorities increasingly recognize that developments claiming net gain while ignoring light impacts lack credibility.
Emerging best practices include:
- Local planning authorities requesting light pollution assessments as part of BNG submissions
- Ecological consultancies routinely including light measurements in nocturnal surveys
- Lighting designers collaborating with ecologists during masterplanning phases
- Post-development monitoring including light pollution verification
The 8 key things planners need to know about BNG increasingly include understanding how artificial light affects habitat quality calculations.
Dark Sky Week and Public Awareness
The annual Dark Sky Week initiative (April 13-20, 2026) coincided with increased public awareness of light pollution solutions[5]. This growing consciousness creates opportunities for:
- Community engagement in biodiversity monitoring programs
- Public support for dark-sky-friendly development designs
- Stakeholder buy-in for lighting restrictions that might otherwise face resistance
- Citizen science contributions to baseline data collection
Ecologists can leverage this awareness when presenting BNG proposals to planning committees and local communities.
Technological Advances on the Horizon
Several emerging technologies promise to enhance light pollution mapping capabilities:
Hyperspectral satellite sensors under development will enable remote spectral analysis of artificial light sources, potentially allowing ecologists to identify problematic LED spectra without ground surveys.
Automated monitoring networks using low-cost sensors and IoT connectivity will enable continuous light pollution tracking across entire regions, providing unprecedented temporal resolution.
AI-powered image analysis of satellite and drone imagery will automate light source identification and classification, reducing field survey time requirements.
Integrated sensor platforms combining light, sound (for bat detectors), and environmental sensors will streamline multi-taxa nocturnal surveys.
These advances will make Light Pollution Mapping in Nocturnal Biodiversity Surveys: Tools for Ecologists in 2026 Urban Fringe BNG more efficient and comprehensive, supporting better conservation outcomes.
Practical Implementation: Case Study Approach
To illustrate practical application of light pollution mapping in BNG contexts, consider a hypothetical 10-hectare mixed-use development on the urban fringe of a medium-sized UK city:
Site Context:
- Former agricultural land with species-rich hedgerows
- Adjacent to ancient woodland (SSSI designation)
- Known bat commuting routes along hedgerows
- Existing light pollution from nearby housing estate (2-4 lux at boundaries)
Survey Approach:
-
Baseline Assessment (Spring-Summer):
- Sky Quality Meter readings at 20 grid points
- Illuminance measurements along all hedgerows
- Bat detector transects (5 nights)
- Moth trapping at varying light levels (3 nights)
- Plant pollinator observations (2 nights)
-
Data Analysis:
- Created GIS heat map showing light pollution gradient
- Identified critical dark corridor along western hedgerow
- Documented 40% reduction in bat activity in lit areas
- Recorded 60% lower moth diversity at illuminance >3 lux
-
BNG Calculation Adjustments:
- Reduced hedgerow condition scores in lit areas
- Excluded heavily lit zones from high-quality habitat calculations
- Baseline: 42 biodiversity units (without light adjustment: 51 units)
-
Mitigation Design:
- Lighting-free buffer zone (50m) along western hedgerow
- Warm-white LEDs (<3000K) throughout development
- Motion-activated lighting in peripheral areas
- Twilight dimming protocol (50% reduction first 2 hours after sunset)
- Dark corridor enhancement with additional hedgerow planting
-
Post-Development Prediction:
- Maintained dark corridor increases connectivity score
- Enhanced hedgerow planting increases habitat area
- Lighting controls minimize condition score reductions
- Projected outcome: 48 biodiversity units (14% net gain)
This approach demonstrates how comprehensive light pollution mapping enables both accurate baseline assessment and effective mitigation design—essential components of credible biodiversity net gain delivery.
Conclusion
Light Pollution Mapping in Nocturnal Biodiversity Surveys: Tools for Ecologists in 2026 Urban Fringe BNG has transitioned from specialized niche to essential practice. The February 2026 discovery that twilight hours represent the critical sensitivity window for nocturnal wildlife fundamentally changes how ecologists must approach surveys and mitigation design[3]. Conventional strategies focusing on late-night dimming offer minimal protection during the periods when bats, moths, and other nocturnal species are most vulnerable.
For ecologists working in urban fringe contexts—where development pressure meets high biodiversity value—the implications are clear:
🔍 Accurate baselines require light pollution quantification. Habitat condition scores that ignore artificial light impacts overestimate biodiversity units, creating false confidence in net gain achievement.
🛠️ Accessible tools enable comprehensive assessment. From £100 Sky Quality Meters to free satellite data platforms, ecologists have unprecedented capacity to map light pollution at scales from individual hedgerows to entire regions.
🦇 Taxa-specific protocols deliver actionable data. Integrating light measurements with moth trapping, bat detector surveys, and plant pollinator observations reveals the full ecological consequences of artificial light.
📊 Evidence-based mitigation works. European dimming trends demonstrate that light pollution is rapidly reversible through policy and technology interventions[4]. Twilight-focused strategies, spectral optimization, and spatial planning can protect nocturnal biodiversity without compromising human safety.
Actionable Next Steps for Ecologists
-
Invest in basic equipment: A Sky Quality Meter and illuminance meter (£300-£600) provide sufficient capability for standard BNG surveys
-
Revise survey protocols: Ensure nocturnal surveys capture the twilight sensitivity window, beginning 30 minutes before sunset and extending 2-3 hours after
-
Integrate light data into condition assessments: Document illuminance levels in habitat condition sheets and justify score adjustments based on measured impacts
-
Collaborate with lighting designers early: Engage during masterplanning phases to incorporate dark corridor preservation and spectral optimization from the outset
-
Establish monitoring baselines: Collect comprehensive light pollution data during baseline surveys to enable meaningful post-development comparisons
-
Leverage satellite resources: Utilize free global monitoring platforms to contextualize site-specific findings within regional trends
-
Educate clients and planners: Share the 2026 twilight sensitivity research to build support for evidence-based mitigation strategies
The convergence of mandatory BNG requirements, improved scientific understanding of light pollution impacts, and accessible mapping technology creates unprecedented opportunity to protect nocturnal biodiversity in urban fringe landscapes. Ecologists who master Light Pollution Mapping in Nocturnal Biodiversity Surveys: Tools for Ecologists in 2026 Urban Fringe BNG will deliver more accurate assessments, design more effective mitigation, and achieve better conservation outcomes.
For developers seeking to navigate BNG requirements in urban fringe contexts, partnering with ecological consultancies that incorporate comprehensive light pollution assessment ensures robust, defensible biodiversity impact assessments that satisfy planning requirements while delivering genuine environmental benefits. The tools, protocols, and evidence base now exist to make light-sensitive development design the standard rather than the exception.
References
[1] Advancing Light Pollution M En – https://keep.eu/projects/29909/Advancing-Light-Pollution-M-EN/
[2] Night Time Light Remote Sensing For Sustainable Development Goals – https://earthobservations.org/groups/night-time-light-remote-sensing-for-sustainable-development-goals
[3] 2026 02 Twilight Action Pollution Impact Biodiversity – https://phys.org/news/2026-02-twilight-action-pollution-impact-biodiversity.html
[4] Nasa Night Light Imagery Tracks Us Energy Transition Global Volatility – https://science.nasa.gov/earth/human-dimensions/earth-at-night/nasa-night-light-imagery-tracks-us-energy-transition-global-volatility/
[5] Rediscover Night During Dark Sky Week – https://www.neefusa.org/story/sustainability/rediscover-night-during-dark-sky-week
[6] sciencedaily – https://www.sciencedaily.com/releases/2026/04/260409101057.htm
