
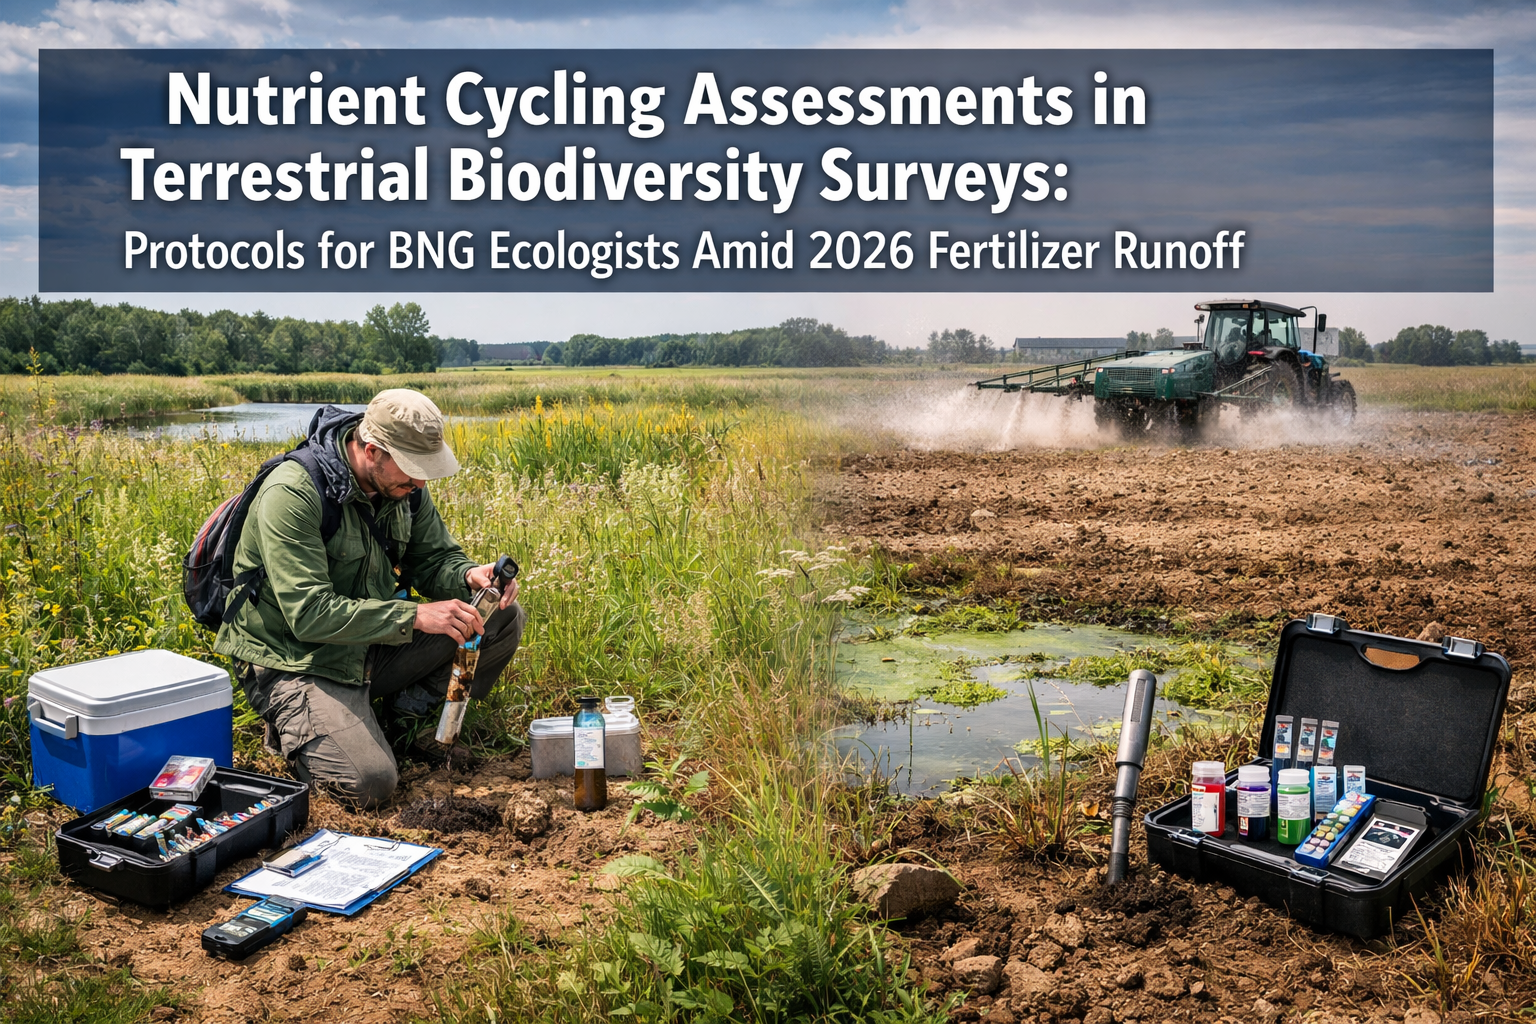
Agricultural fertilizer applications have increased nitrogen and phosphorus loads in UK watersheds by 40% over the past decade, fundamentally altering baseline biogeochemical cycling patterns in terrestrial ecosystems[4]. As Biodiversity Net Gain (BNG) requirements become mandatory across England in 2026, ecologists face a critical challenge: how to accurately assess nutrient cycling dynamics in landscapes increasingly affected by fertilizer runoff while delivering credible habitat enhancement predictions.
Nutrient Cycling Assessments in Terrestrial Biodiversity Surveys: Protocols for BNG Ecologists Amid 2026 Fertilizer Runoff represents an emerging frontier in ecological surveying. Drawing from nutrient cycle studies, surveyors now track phosphorus and nitrogen flows to predict BNG outcomes with greater accuracy. This approach integrates soil core sampling and isotope analysis methods into compliance reporting frameworks, providing developers and landowners with robust data for Biodiversity Net Gain assessments.
Key Takeaways
- Biomolecular composition rather than elemental nutrient concentrations determines actual cycling rates in terrestrial food webs[1]
- Soil core sampling combined with isotope analysis provides quantifiable data for BNG habitat condition assessments
- Fertilizer runoff from agricultural watersheds has altered baseline biogeochemical cycling, requiring updated survey protocols[4]
- Multiple stressor interactions including hydrological variability and temperature must be considered in nutrient cycling assessments[3]
- Belowground biodiversity directly influences nutrient cycling dynamics and ecosystem resilience[2]
Understanding Nutrient Cycling in BNG Context
The Shift from Elemental to Biomolecular Assessment
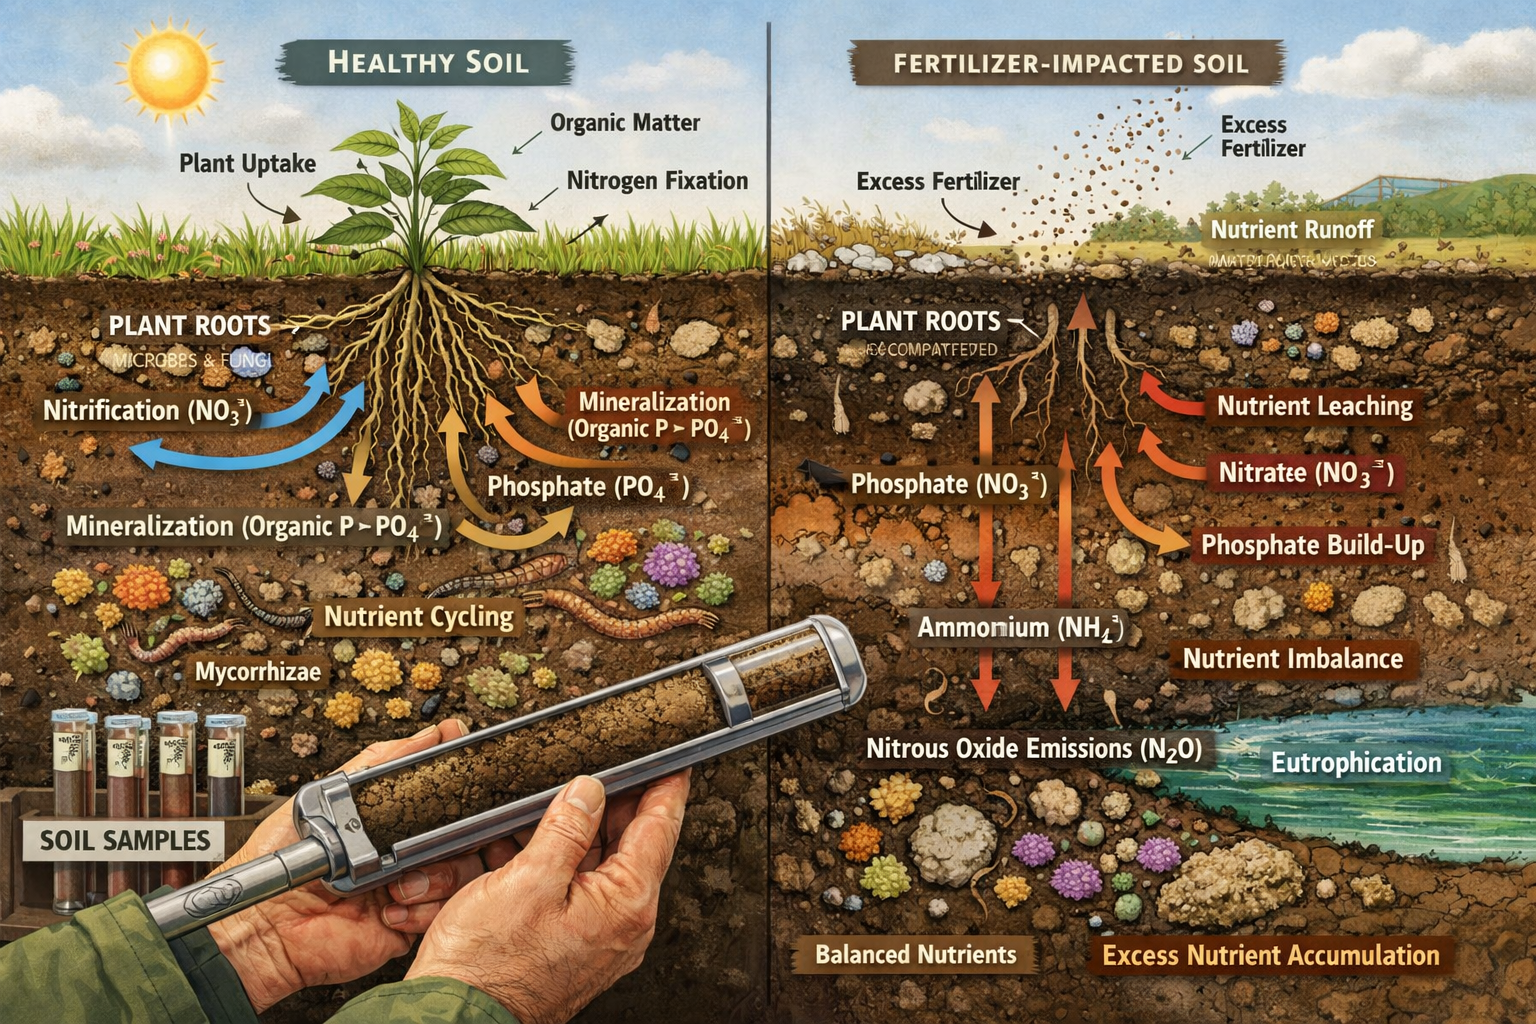
Traditional terrestrial biodiversity surveys have focused on elemental nutrient concentrations—measuring total carbon, nitrogen, and phosphorus in soil samples. However, groundbreaking research in 2026 reveals that nutrient delivery through specific biomolecular packages rather than raw elemental forms determines actual cycling rates in ecological food webs[1]. This paradigm shift has profound implications for BNG ecologists conducting habitat assessments.
For Biodiversity Net Gain projects, this means moving beyond simple soil chemistry panels toward characterizing:
- Amino acid composition and protein quality in organic matter
- Lipid profiles indicating energy transfer efficiency
- Carbohydrate complexity affecting decomposition rates
- Nucleic acid availability for microbial community function
Why Nutrient Cycling Matters for BNG Compliance
The UK's mandatory 10% Biodiversity Net Gain requirement demands accurate habitat condition assessments. Nutrient cycling dynamics directly influence:
✅ Vegetation community composition and species richness
✅ Soil microbial diversity supporting ecosystem function
✅ Carbon sequestration potential in restored habitats
✅ Resilience to environmental stressors including climate change
✅ Long-term habitat sustainability beyond initial establishment
When conducting a biodiversity impact assessment, understanding baseline nutrient cycling provides critical context for predicting whether proposed enhancement measures will achieve stated outcomes over 30-year monitoring periods.
Agricultural Fertilizer Runoff: The 2026 Challenge
Agricultural watersheds across England are experiencing documented shifts in baseline biogeochemical cycling due to increased fertilizer inputs[4]. This creates several complications for BNG ecologists:
| Impact Category | Effect on Surveys | Protocol Adjustment |
|---|---|---|
| Elevated nitrogen loads | Altered plant community composition | Extended vegetation sampling beyond standard quadrats |
| Phosphorus accumulation | Changed soil chemistry baselines | Multiple depth soil cores (0-15cm, 15-30cm, 30-60cm) |
| Eutrophication signals | Reduced habitat condition scores | Integration of water quality data from adjacent systems |
| Microbial community shifts | Modified decomposition rates | Soil respiration measurements and enzyme assays |
The 2026 freshwater wetland research highlights how significant agricultural fertilizer inputs have fundamentally altered biogeochemical cycling in aquatic ecosystems[4], with similar patterns now documented in terrestrial habitats receiving runoff.
Nutrient Cycling Assessments in Terrestrial Biodiversity Surveys: Field Protocol Development
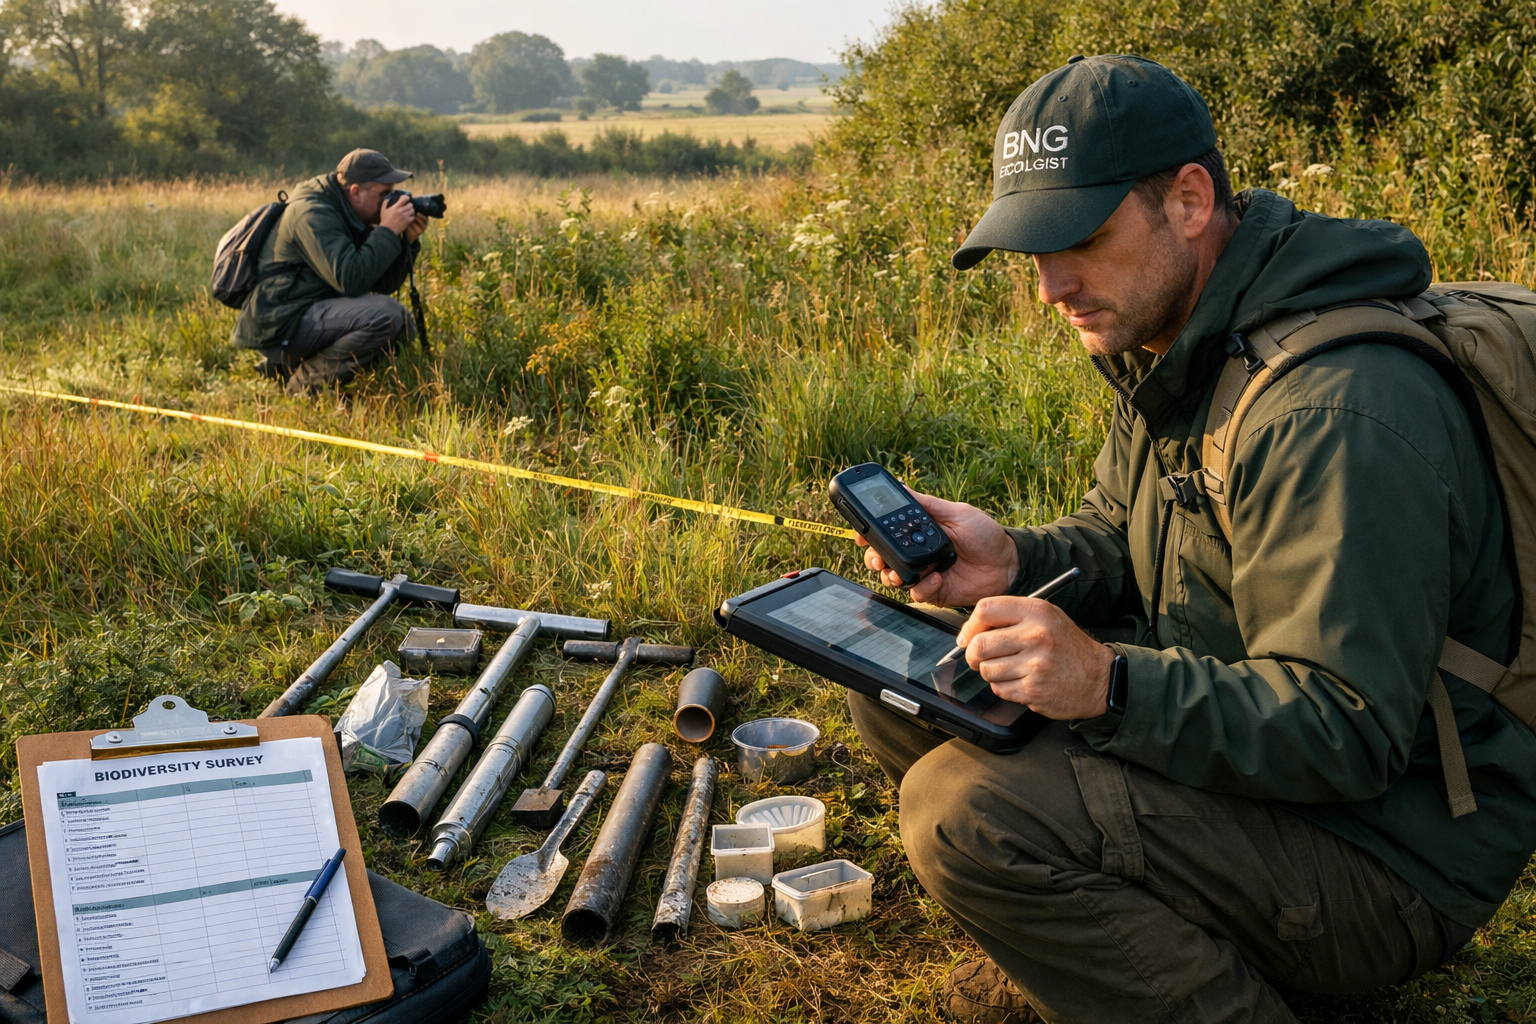
Soil Core Sampling Methodology
Effective Nutrient Cycling Assessments in Terrestrial Biodiversity Surveys: Protocols for BNG Ecologists Amid 2026 Fertilizer Runoff begin with systematic soil sampling. The following protocol integrates nutrient cycling quantification with standard habitat condition assessments:
Pre-Survey Planning
- Desktop assessment of historical land use and fertilizer application records
- Watershed analysis identifying potential runoff pathways
- Topographic mapping to locate accumulation zones
- Baseline data compilation from Environment Agency nutrient monitoring
Field Sampling Protocol
Sample Point Selection:
- Minimum 5 sampling points per habitat parcel
- Stratified random design within homogeneous vegetation units
- Additional targeted samples in suspected accumulation zones
- Avoid obvious disturbance features (tracks, recent excavations)
Core Collection Technique:
- Use stainless steel soil augers (avoiding contamination)
- Collect cores to 60cm depth minimum
- Separate samples by depth increment (0-15cm, 15-30cm, 30-60cm)
- Record GPS coordinates, vegetation cover, and soil moisture
- Maintain cold chain for microbial analysis samples
Field Measurements:
- Soil temperature at each depth
- Soil pH using calibrated field meter
- Volumetric water content
- Visual assessment of soil structure and organic matter content
Integration with Biodiversity Metric Calculations
Nutrient cycling data enhances the accuracy of achieving 10% Biodiversity Net Gain by providing objective evidence for habitat condition scoring. The Defra Biodiversity Metric 4.0 considers soil condition within habitat distinctiveness ratings, but standard assessments lack quantitative nutrient cycling data.
Enhanced Condition Assessment Criteria:
🔬 Poor Condition Indicators:
- Nitrogen concentration >0.4% (excess fertilizer influence)
- Phosphorus >50mg/kg (accumulation from runoff)
- Low microbial biomass carbon (<200mg/kg)
- Simplified organic matter composition
🌱 Moderate Condition Indicators:
- Nitrogen 0.2-0.4% (moderate enrichment)
- Phosphorus 20-50mg/kg (elevated but functional)
- Moderate microbial activity
- Diverse organic matter pools
🌿 Good Condition Indicators:
- Nitrogen <0.2% (appropriate for habitat type)
- Phosphorus <20mg/kg (natural background)
- High microbial biomass and diversity
- Complex biomolecular nutrient packages[1]
Isotope Analysis Methods for Advanced Assessment
Stable isotope analysis provides powerful tools for tracing nutrient sources and quantifying cycling rates. New techniques being developed in 2026 focus on quantifying soil organic matter decomposition rates and nitrogen availability at the root-soil interface[7].
Nitrogen Isotope Analysis (δ¹⁵N):
- Distinguishes synthetic fertilizer (δ¹⁵N ≈ 0‰) from organic sources (δ¹⁵N = +3 to +10‰)
- Identifies fertilizer runoff contamination in "natural" habitats
- Tracks nitrogen transformation processes (nitrification, denitrification)
- Provides evidence for nutrient source attribution
Carbon Isotope Analysis (δ¹³C):
- Traces organic matter sources and decomposition pathways
- Distinguishes C3 versus C4 plant inputs
- Quantifies soil carbon turnover rates
- Supports carbon sequestration claims in BNG proposals
Phosphorus Fractionation:
- Sequential extraction determining bioavailable versus stable phosphorus pools
- Iron and manganese interactions affecting nutrient stability[3]
- Critical for wetland and riparian habitat assessments
Nutrient Cycling Assessments in Terrestrial Biodiversity Surveys: Laboratory Analysis and Data Interpretation
Laboratory Processing Standards
Once field samples reach the laboratory, standardized processing ensures data quality for BNG compliance reporting:
Sample Preparation:
- Air-dry or freeze-dry depending on analysis requirements
- Sieve to remove coarse material (>2mm)
- Grind to fine powder for isotope analysis
- Maintain sample integrity through chain-of-custody documentation
Analytical Suite for BNG Nutrient Cycling:
| Analysis Type | Parameter Measured | BNG Application |
|---|---|---|
| Total C/N/P | Elemental concentrations | Baseline fertility assessment |
| δ¹⁵N and δ¹³C | Isotopic signatures | Source attribution and cycling rates |
| Microbial biomass C/N | Active biological pool | Functional capacity indicator |
| Enzyme activities | Decomposition potential | Nutrient cycling velocity |
| Extractable nutrients | Plant-available pools | Vegetation establishment prediction |
| Organic matter fractionation | Biomolecular composition | Advanced cycling assessment[1] |
Interpreting Results in Context of Fertilizer Runoff
The 2026 challenge of widespread fertilizer runoff requires careful interpretation of nutrient cycling data. Scottish forest restoration research demonstrates that tree genetic variation, soil microbial communities, and biogeochemical cycling are intimately linked[2], with similar relationships evident in grassland, heathland, and wetland habitats.
Red Flags for Fertilizer Contamination:
⚠️ Nitrogen concentrations exceeding habitat-specific thresholds
⚠️ δ¹⁵N values near 0‰ indicating synthetic fertilizer
⚠️ Phosphorus accumulation in surface horizons
⚠️ Simplified microbial community structure
⚠️ Elevated nitrate in soil solution
⚠️ Vegetation shifts toward nitrophilous species
Adaptive Management Implications:
When nutrient cycling assessments reveal fertilizer influence, BNG proposals must incorporate:
- Extended establishment periods to allow nutrient depletion
- Active nutrient management through biomass removal
- Buffer zone creation to intercept ongoing runoff
- Alternative habitat creation in less impacted locations
- Revised condition trajectories reflecting contamination recovery timelines
Linking Nutrient Cycling to Belowground Biodiversity
The 2026 UKCEH/CENTA project examining Scottish Caledonian pinewoods provides a model for integrating belowground biodiversity assessment with nutrient cycling quantification[2]. This approach recognizes that soil microbial communities are both indicators and drivers of nutrient cycling dynamics.
Belowground Assessment Components:
🦠 Microbial Community Analysis:
- DNA metabarcoding of bacterial and fungal communities
- Functional gene profiling (nitrogen fixation, phosphorus solubilization)
- Mycorrhizal colonization assessment
- Microbial biomass and activity measurements
🪱 Soil Fauna Surveys:
- Earthworm abundance and diversity
- Collembola and mite communities
- Nematode functional groups
- Macrofauna diversity indices
🌱 Root System Characterization:
- Fine root biomass and turnover
- Root exudate composition
- Rhizosphere nutrient dynamics
- Plant-microbe interactions
For off-site BNG delivery, understanding these belowground components ensures that receptor sites have appropriate functional capacity to support proposed habitat creation.
Multiple Stressor Considerations in 2026 Assessments
Recent research examining riparian wetlands highlights how hydrological variability combined with nutrient enrichment and rising temperatures influences organic matter reactivity and nutrient cycling dynamics[3]. BNG ecologists must consider these multiple stressor interactions when conducting nutrient cycling assessments.
Climate Change and Nutrient Cycling
Temperature increases affect:
- Microbial decomposition rates (Q₁₀ temperature coefficient)
- Soil moisture regimes altering nutrient availability
- Vegetation growing season length and nutrient demand
- Extreme precipitation events mobilizing accumulated nutrients
Hydrological Regime Alterations
Changes in water movement patterns influence:
- Nutrient transport pathways and accumulation zones
- Redox conditions affecting nitrogen and phosphorus cycling
- Groundwater-surface water interactions
- Seasonal flooding duration and frequency
Invasive Species Effects
Terrestrial biodiversity assessments must recognize that invasive alien plants alter nutrient cycling and soil conditions[5], requiring consideration in habitat restoration protocols. Common invasive species effects include:
- Himalayan balsam: Rapid biomass accumulation and decomposition altering nitrogen cycling
- Japanese knotweed: Deep rhizome systems modifying soil structure and nutrient distribution
- Rhododendron ponticum: Acidification and nutrient immobilization under dense canopies
- Cotoneaster species: Altered litter quality affecting decomposition rates
Practical Implementation for BNG Projects
Integrating Nutrient Cycling into Standard Survey Workflows
For developers seeking to understand what is in a Biodiversity Net Gain assessment, nutrient cycling components add valuable depth without excessive complexity:
Phase 1: Desktop Assessment
- Review agricultural land use history
- Identify fertilizer application records
- Map potential runoff pathways
- Compile existing nutrient monitoring data
Phase 2: Field Survey
- Conduct standard habitat condition assessments
- Collect soil cores at representative locations
- Perform field measurements (pH, moisture, temperature)
- Document vegetation composition and structure
Phase 3: Laboratory Analysis
- Process samples for nutrient concentrations
- Conduct isotope analysis where fertilizer influence suspected
- Assess microbial biomass and activity
- Characterize organic matter composition
Phase 4: Data Integration
- Interpret results in context of habitat condition scores
- Adjust BNG metric calculations based on nutrient status
- Develop targeted enhancement recommendations
- Establish monitoring protocols for nutrient trajectory
Cost-Benefit Analysis for Enhanced Assessments
Standard BNG Survey:
- Habitat mapping and condition assessment: £2,000-5,000
- Basic soil sampling (pH, texture): £500-1,000
- Metric calculation and reporting: £1,500-3,000
- Total: £4,000-9,000
Enhanced Nutrient Cycling Assessment:
- All standard components: £4,000-9,000
- Advanced soil sampling (multiple depths, isotopes): £2,000-4,000
- Laboratory analysis suite: £1,500-3,000
- Specialized interpretation and reporting: £1,000-2,000
- Total: £8,500-18,000
For large development projects where biodiversity credits may cost £50,000-500,000+, the additional investment in nutrient cycling assessment (5-10% of credit costs) provides significant risk reduction by ensuring habitat creation success.
Case Study Applications
Scenario 1: Grassland Creation on Former Arable Land
A developer proposes creating species-rich grassland on former arable fields as part of their BNG strategy. Standard surveys show appropriate soil type and topography, but nutrient cycling assessment reveals:
- Nitrogen concentration: 0.6% (3× natural grassland levels)
- δ¹⁵N: +2‰ (recent synthetic fertilizer application)
- Phosphorus: 85mg/kg (very high, legacy accumulation)
Outcome: BNG proposal revised to include 3-year nutrient depletion phase with hay cropping before wildflower establishment, preventing expensive failure and ensuring 10% BNG achievement.
Scenario 2: Wetland Restoration Adjacent to Agricultural Land
Wetland creation planned in valley bottom receiving runoff from intensive dairy farming. Nutrient cycling assessment identifies:
- Elevated nitrogen in groundwater (15mg/L nitrate)
- Phosphorus accumulation in upper soil horizons
- Simplified microbial community structure
- Evidence of ongoing fertilizer inputs
Outcome: Design modified to include upstream buffer zone with nutrient-stripping vegetation, subsurface flow pathways, and adaptive management triggers based on water quality monitoring.
Quality Assurance and Reporting Standards
Accreditation and Competency Requirements
BNG ecologists conducting Nutrient Cycling Assessments in Terrestrial Biodiversity Surveys: Protocols for BNG Ecologists Amid 2026 Fertilizer Runoff should possess:
- CIEEM membership (Chartered Institute of Ecology and Environmental Management)
- Soil science training in sampling methodology and interpretation
- Understanding of biogeochemical cycling principles
- Experience with laboratory liaison and quality control
- Knowledge of agricultural systems and fertilizer practices
Laboratory Selection Criteria
Choose accredited laboratories with:
✓ UKAS accreditation (ISO 17025) for soil analysis
✓ Isotope analysis capability (IRMS – Isotope Ratio Mass Spectrometry)
✓ Rapid turnaround times (2-4 weeks standard)
✓ Quality control protocols with certified reference materials
✓ Experience with ecological applications beyond agricultural testing
Reporting Framework for BNG Submissions
Nutrient cycling assessment reports should include:
-
Executive Summary
- Key findings and BNG implications
- Fertilizer influence assessment
- Recommendations for habitat creation/enhancement
-
Methodology Section
- Sampling design and rationale
- Field protocols and GPS locations
- Laboratory methods and quality assurance
- Data analysis approaches
-
Results and Interpretation
- Nutrient concentration data with habitat-specific context
- Isotope analysis results and source attribution
- Microbial community and activity findings
- Comparison to reference conditions
-
BNG Metric Integration
- Habitat condition score justification
- Nutrient status influence on trajectory predictions
- Risk assessment for proposed interventions
- Monitoring recommendations
-
Appendices
- Raw laboratory data
- Site photographs and sampling locations
- Quality control documentation
- Reference literature
Future Developments and Research Needs
Emerging Technologies
The field of nutrient cycling assessment continues to evolve rapidly in 2026:
Portable Analysis Systems:
- Field-deployable spectrometers for real-time nutrient measurement
- Handheld isotope analyzers (laser-based systems)
- Rapid microbial activity assays
- Smartphone-integrated soil sensors
Remote Sensing Integration:
- Hyperspectral imagery for foliar nutrient status
- LiDAR-derived terrain analysis for runoff prediction
- Satellite-based vegetation indices correlating with soil fertility
- Drone-mounted sensors for precision sampling design
Artificial Intelligence Applications:
- Machine learning models predicting nutrient cycling rates from environmental variables
- Image recognition for soil structure assessment
- Automated species identification linked to nutrient preferences
- Predictive modeling of BNG trajectory success
Research Priorities
Critical knowledge gaps requiring attention:
- Reference condition databases for nutrient cycling parameters across UK habitat types
- Fertilizer runoff models specific to UK agricultural systems and climate
- Recovery timelines for nutrient-impacted habitats under different management regimes
- Microbial community benchmarks for habitat condition assessment
- Cost-effective screening methods for rapid fertilizer influence detection
Conclusion
Nutrient Cycling Assessments in Terrestrial Biodiversity Surveys: Protocols for BNG Ecologists Amid 2026 Fertilizer Runoff represents a necessary evolution in ecological surveying practice. As agricultural fertilizer inputs continue to alter baseline biogeochemical cycling across UK landscapes[4], standard habitat assessments alone cannot provide the predictive accuracy required for successful Biodiversity Net Gain delivery.
The integration of soil core sampling, isotope analysis, and biomolecular nutrient characterization[1] into standard survey workflows enables ecologists to:
✅ Accurately assess baseline habitat condition in fertilizer-influenced landscapes
✅ Predict habitat creation success with greater confidence
✅ Design targeted interventions addressing nutrient contamination
✅ Establish appropriate monitoring protocols for long-term trajectory assessment
✅ Reduce financial risk for developers and landowners
The Scottish forest restoration framework demonstrates that linking belowground biodiversity assessment with nutrient cycling quantification[2] provides comprehensive understanding of ecosystem function—an approach equally applicable to grassland, heathland, wetland, and woodland BNG projects.
Actionable Next Steps for BNG Practitioners
For Ecologists:
- Develop soil sampling competency through training courses
- Establish relationships with accredited laboratories offering isotope analysis
- Create site-specific sampling protocols addressing fertilizer runoff risk
- Integrate nutrient cycling data into standard BNG reporting templates
- Build reference condition databases for local habitat types
For Developers:
- Request nutrient cycling assessment for sites with agricultural land use history
- Budget appropriately for enhanced survey work (additional £4,000-9,000)
- Factor nutrient depletion phases into project timelines where necessary
- Consider off-site BNG options if on-site contamination severe
- Engage early with ecologists to optimize survey scope
For Landowners:
- Document historical fertilizer application rates and timing
- Consider nutrient cycling enhancement as value-add for selling biodiversity units
- Implement buffer zones to protect high-quality habitats from runoff
- Participate in research projects advancing assessment methodologies
- Maintain long-term monitoring data supporting habitat condition claims
The 2026 fertilizer runoff challenge is significant, but with appropriate assessment protocols and adaptive management approaches, BNG projects can successfully deliver measurable biodiversity enhancement even in nutrient-impacted landscapes. By tracking phosphorus and nitrogen flows through soil core sampling and isotope analysis, ecologists provide developers with the robust compliance reporting necessary for successful Biodiversity Net Gain delivery in an increasingly complex regulatory environment.
References
[1] we.copernicus – https://we.copernicus.org/articles/26/27/2026/
[2] 2026 Ukceh04 Digging Up The Dirt On Ecological Restoration Critical Links Between Belowground Biodiversity And Forest Resilience In A Changing World – https://centa.ac.uk/studentship/2026-ukceh04-digging-up-the-dirt-on-ecological-restoration-critical-links-between-belowground-biodiversity-and-forest-resilience-in-a-changing-world/
[3] 2026 27 Projects – https://ecowild.site.hw.ac.uk/2026-27-projects/
[4] Special Sessions – https://www.sfsannualmeeting.org/special-sessions
[5] Appendix G09 Terrestrial Biodiversity Scoping Report – https://www.wsp.com/-/media/service/south-africa/2026-documents/za0058322-7774—eskom-nuclear-dsr/appendix-g09—terrestrial-biodiversity-scoping-report.pdf
[7] Viewpublicabstract – https://pamspublic.science.energy.gov/WebPAMSExternal/Interface/Common/ViewPublicAbstract.aspx?rv=1975997f-7069-4e5b-b736-d936e6ee8e07&rtc=24&PRoleId=10
