
{"cover":"Professional landscape format (1536×1024) hero image with bold text overlay 'Pollinator Decline Surveys for BNG Compliance: Field Protocols for Ecologists Tracking 2026 Insect Population Crashes' in extra large 70pt white sans-serif font with dark shadow effect, positioned in upper third center. Background shows ecologist in high-visibility vest kneeling in wildflower meadow examining colorful pan traps filled with captured pollinators, with tablet device displaying AI species recognition interface. Foreground features native wildflowers (poppies, cornflowers) with visiting bees and butterflies. Composition uses rule of thirds with survey equipment visible including sweep nets and specimen containers. Color palette: vibrant greens, yellows, blues with high contrast white text. Magazine cover quality, editorial style, sharp focus on both text and field research activity, professional conservation science aesthetic","content":["Landscape format (1536×1024) detailed field scene showing three types of pollinator survey equipment arranged on grass: bright yellow, blue, and white pan traps (bowl-shaped collection vessels) filled with soapy water containing captured bee specimens, alongside modern digital tablet displaying AI-powered insect identification software with split-screen showing bee photograph and species match results. Background shows ecologist's gloved hands holding magnifying loupe examining specimen. Include labeled diagram overlay showing pan trap placement pattern in grid formation. Bright natural daylight, shallow depth of field, professional scientific documentation style, conservation research aesthetic with measurement tools and data sheets visible","Landscape format (1536×1024) close-up composition of ecologist conducting transect walk survey through Biodiversity Net Gain habitat site, wearing professional field gear with clipboard mounted tablet showing digital survey form interface. Foreground shows sweep net mid-motion through flowering vegetation capturing flying insects, with motion blur on wings. Middle ground displays diverse native wildflower species (oxeye daisies, red clover, bird's-foot trefoil) with multiple pollinator species visible including bumblebees, solitary bees, and hoverflies on flowers. Background shows habitat boundary markers and survey transect rope line. Golden hour lighting, vibrant colors, professional ecological survey documentation style, UK countryside setting","Landscape format (1536×1024) split-screen infographic style image showing BNG compliance monitoring workflow. Left side displays field ecologist using smartphone with AI image recognition app photographing bee on flower, with augmented reality overlay showing species identification and confidence percentage. Right side shows office workspace with laptop displaying biodiversity metric calculator spreadsheet, habitat condition assessment forms, and pollinator population trend graphs with declining red arrows for 2026 data. Center includes workflow diagram connecting field data collection to BNG reporting. Clean professional design, data visualization elements, charts showing population baselines, modern conservation technology aesthetic, high contrast colors for clarity"]
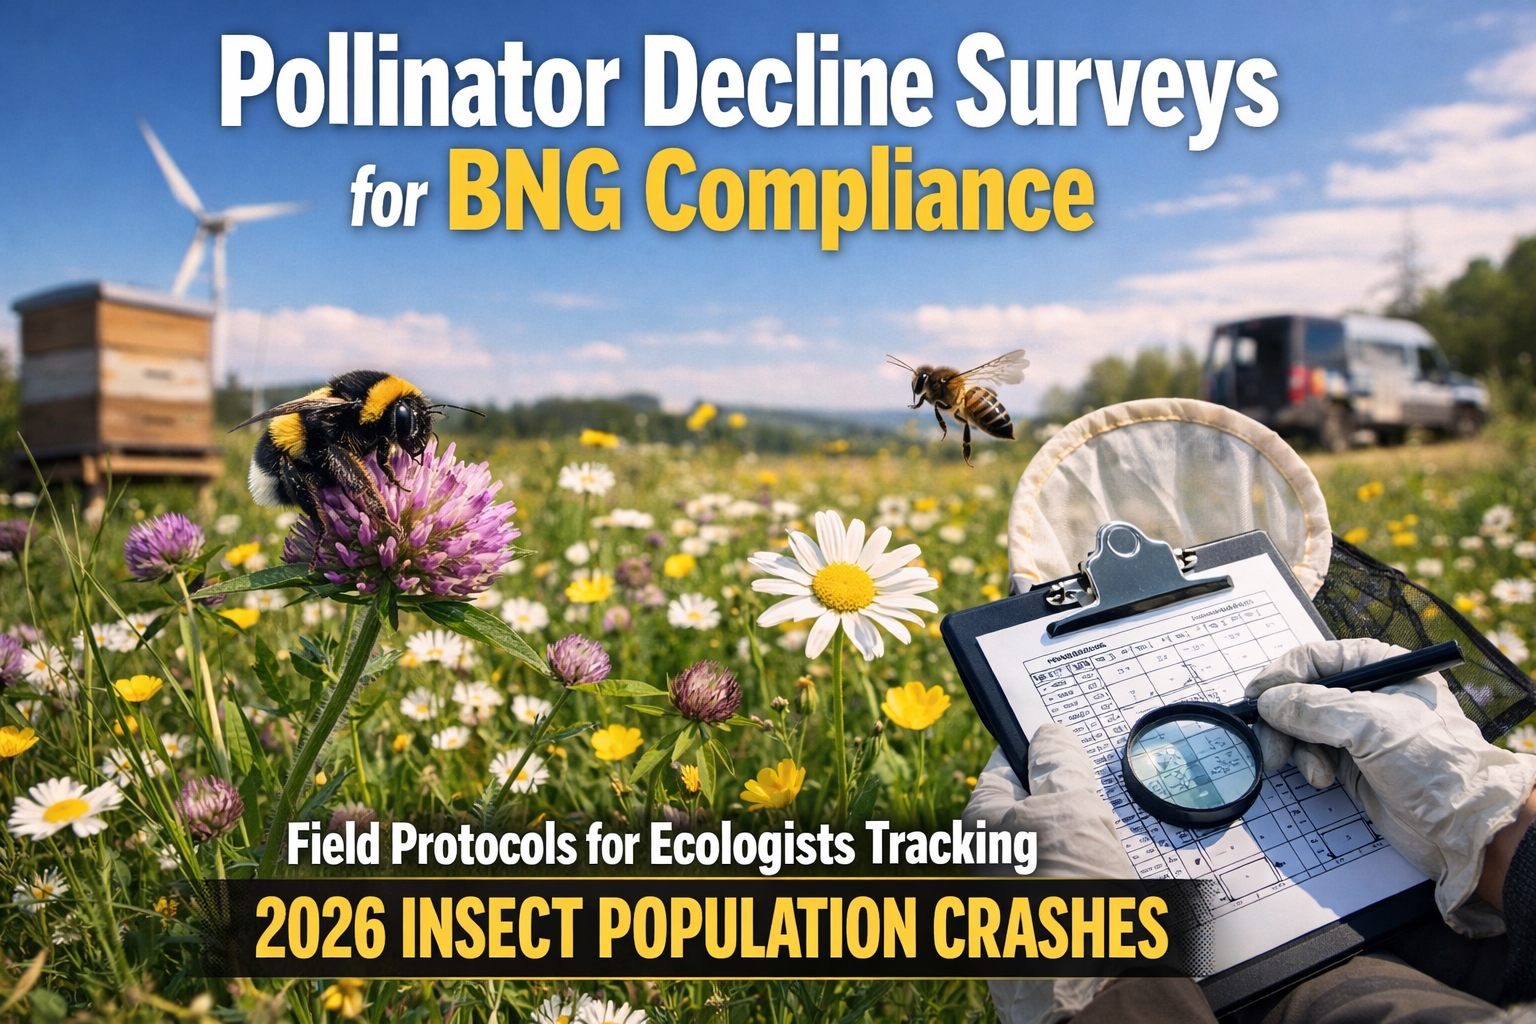
Bee pollination contributes over $15 billion in increased crop value annually in the United States alone [2], yet 2026 has witnessed some of the most severe pollinator population crashes on record. As global insect populations plummet due to pesticide exposure and habitat fragmentation, ecologists face unprecedented pressure to document these declines accurately for Biodiversity Net Gain (BNG) compliance. The challenge is stark: traditional survey methods often lack the speed and precision needed to capture baseline data before populations deteriorate further. With Biodiversity Net Gain regulations now mandatory for development projects, implementing robust Pollinator Decline Surveys for BNG Compliance: Field Protocols for Ecologists Tracking 2026 Insect Population Crashes has become essential for meeting regulatory requirements while protecting critical pollinator species.
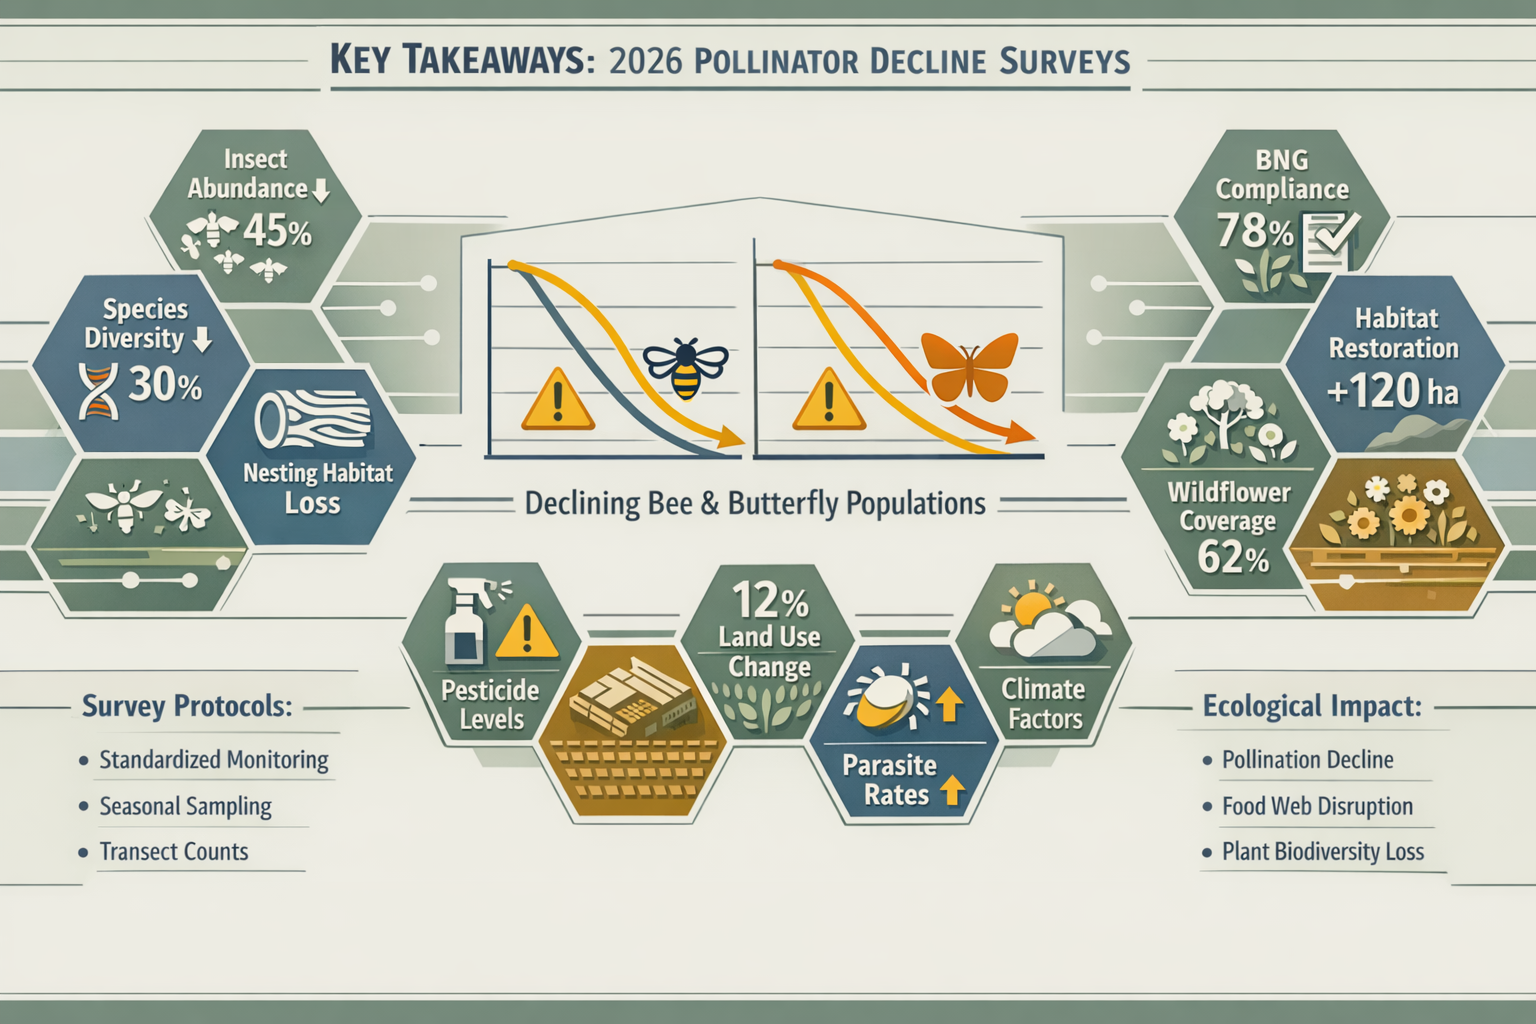
Key Takeaways
- Pan trap surveys combined with AI-powered image recognition provide rapid, cost-effective baseline data for BNG pollinator assessments in 2026
- Seasonal survey windows are critical—many pollinator species require monitoring between April and September, with peak activity in June-July
- Standardized protocols including transect walks, sweep netting, and quarterly monitoring align with emerging BNG compliance requirements
- Pesticide contamination screening has become essential after 2024-2025 overwinter colony losses triggered emergency USDA sampling [6]
- Geographic density variation ranges from 0 to 14 colonies per km², requiring site-specific survey intensity adjustments [6]
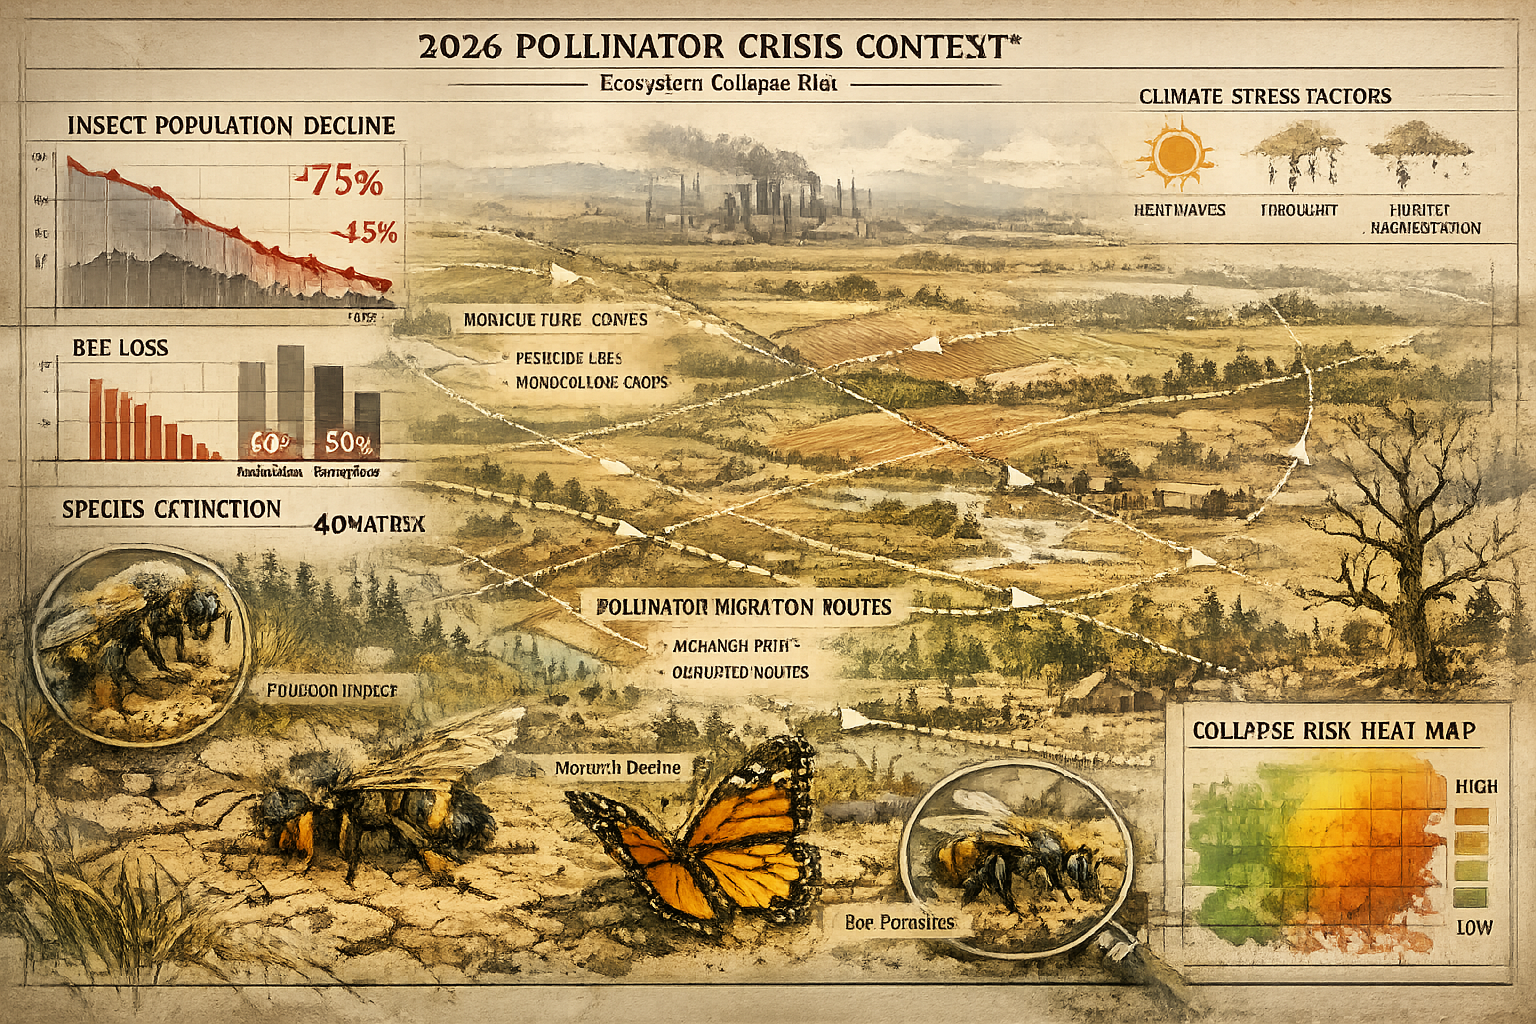
Understanding the 2026 Pollinator Crisis Context
The scale of pollinator decline in 2026 demands immediate attention from ecological consultants working on BNG projects. Recent emergency sampling conducted by USDA scientists in January 2025 documented widespread pesticide contamination across commercial beekeeping operations experiencing catastrophic overwinter losses [6]. This contamination affected colonies of all strength levels—weak, medium, and strong—demonstrating that pesticide exposure represents a systemic stressor impacting multiple age cohorts within colonies.
Current Survey Initiatives Setting the Standard
Several major survey initiatives launched in 2026 provide frameworks for Pollinator Decline Surveys for BNG Compliance:
🐝 US Beekeeping Survey (19th consecutive year) — Opened April 1, 2026, this comprehensive monitoring program invites all US beekeepers aged 18 and over to contribute data on colony losses and management practices through April 30, 2026 [4]. The longitudinal dataset provides critical context for understanding population trends.
🇧🇪 Belgium Federal Pollinators Plan 2026-2028 — Following public consultation from January 30 to March 31, 2026, Belgium launched an ambitious federal plan aimed at halting pollinator decline and restoring pollinator-favorable environments [1]. This policy framework demonstrates governmental recognition of the crisis severity.
📊 NASDA Quarterly Colony Loss Surveys — Collecting data on extent, causes, and disease impacts, these surveys operate on quarterly reference dates (January 1, April 1, July 1, October 1) with honey bee colony data releases scheduled for August 2026 [2].
Why BNG Compliance Requires Updated Protocols
Traditional pollinator surveys often relied on annual or biannual assessments that fail to capture the rapid population fluctuations observed in 2026. Understanding Biodiversity Net Gain requirements reveals that developers must demonstrate measurable improvements in biodiversity value, which requires accurate baseline data and ongoing monitoring protocols.
The integration of rapid assessment techniques has become necessary because:
- Development timelines cannot accommodate year-long survey windows
- Population crashes can occur between traditional survey periods
- BNG metric calculations require precise species abundance data
- Habitat condition assessments depend on pollinator presence indicators
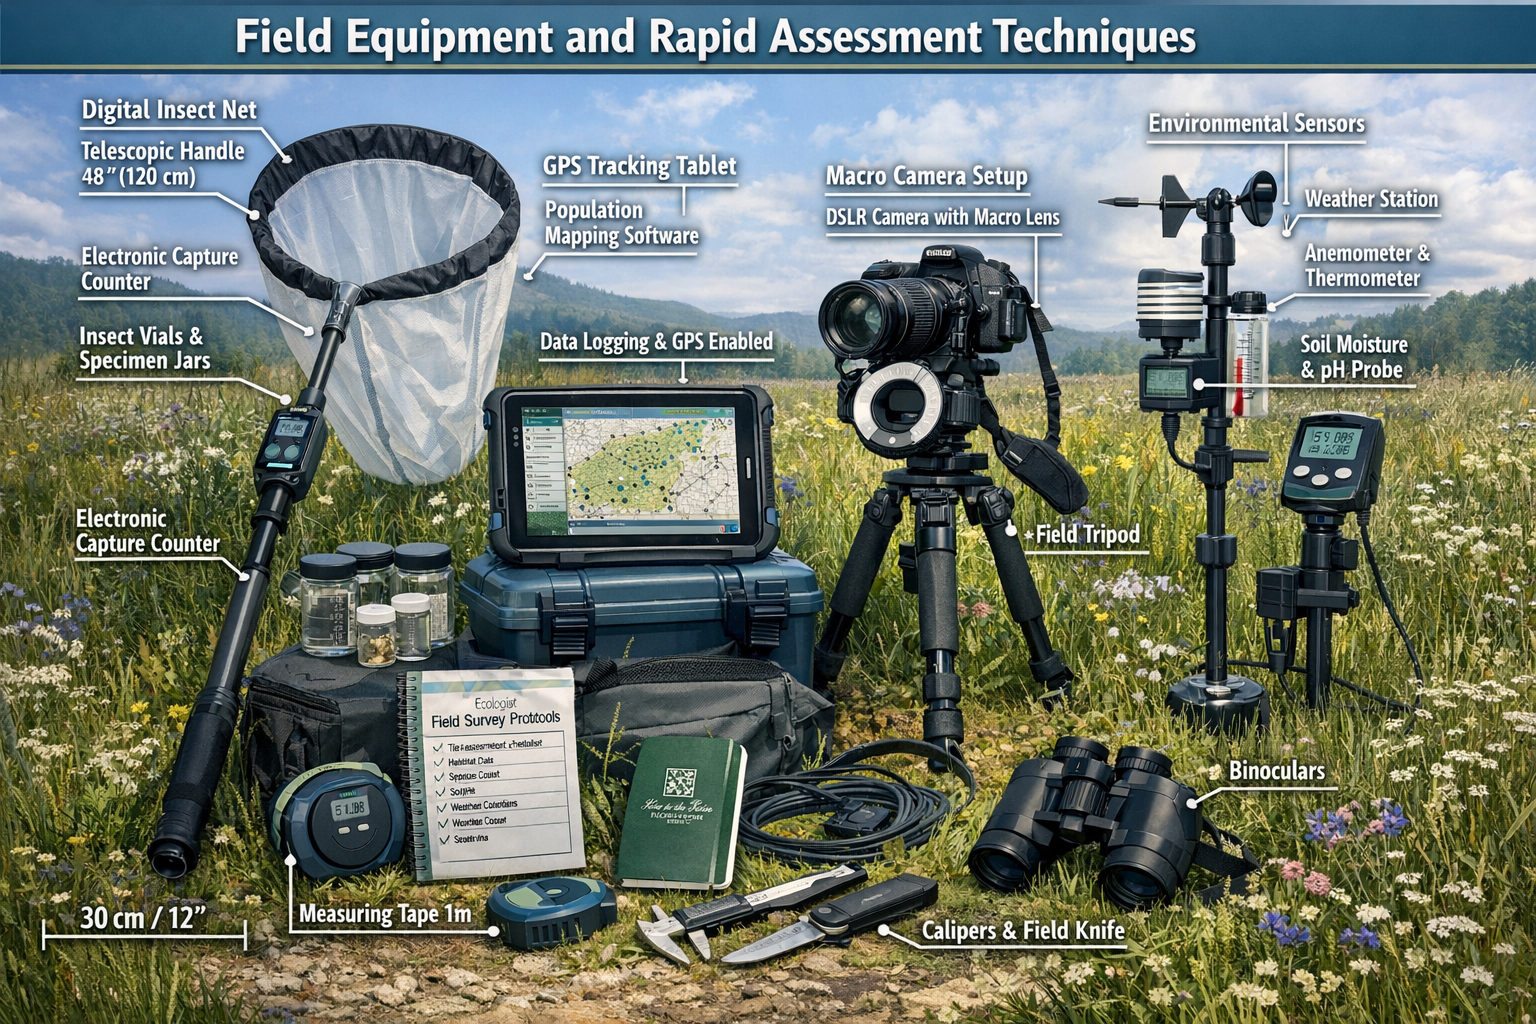
Field Equipment and Rapid Assessment Techniques for Pollinator Decline Surveys
Implementing effective Pollinator Decline Surveys for BNG Compliance: Field Protocols for Ecologists Tracking 2026 Insect Population Crashes requires specific equipment and methodologies that balance scientific rigor with practical field constraints.
Pan Trap Surveys: The Gold Standard for Passive Monitoring
Pan traps represent one of the most efficient passive sampling methods for documenting pollinator diversity and abundance. The Streamlined Bee Monitoring Protocol developed by University of California Davis, Rutgers University, Michigan State University, and The Xerces Society provides comprehensive guidance for habitat quality assessment [3].
Essential Pan Trap Setup:
| Component | Specification | Purpose |
|---|---|---|
| Bowl Color | Fluorescent yellow, blue, white | Attracts different bee species based on color preference |
| Bowl Size | 3.25 oz (96 ml) capacity | Standardized for data comparison |
| Liquid Medium | Soapy water (unscented detergent) | Breaks surface tension, preserves specimens |
| Trap Density | 3 bowls per station (one of each color) | Maximizes species capture diversity |
| Station Spacing | 5-10 meters apart | Prevents trap competition |
| Deployment Duration | 24-48 hours per survey round | Balances capture rate with specimen preservation |
Field surveys across 16 km² at five sites documented colony densities ranging from 0 to 14 colonies per km² [6], highlighting the importance of deploying sufficient trap stations to account for geographic variability.
Transect Walk Protocols for Active Monitoring
While pan traps provide passive data collection, transect walks enable real-time observation of pollinator-flower interactions and behavior patterns critical for BNG habitat condition assessments.
Standard Transect Protocol:
- Transect Length: 100 meters minimum per habitat type
- Transect Width: 2 meters (1 meter each side of centerline)
- Walking Speed: Slow, steady pace (approximately 20 minutes per 100m)
- Weather Conditions: Temperature >13°C, <50% cloud cover, wind <5 on Beaufort scale
- Time Windows: 10:00-17:00 during peak flowering season
- Recording Method: Digital tablet with GPS-enabled survey forms
What to Record:
- Species identification (or morphospecies grouping)
- Flower species visited
- Interaction duration
- Behavioral observations (foraging, mating, territorial)
- Microhabitat characteristics
Sweep Netting for Comprehensive Species Inventory
Sweep netting complements passive and observational methods by actively sampling flying insects across vegetation strata. This technique proves particularly valuable for capturing smaller species that may avoid pan traps.
Sweep Net Protocol:
- Net Specification: 38cm diameter, lightweight mesh
- Sweep Pattern: Figure-eight motion through vegetation
- Sweep Count: 20 sweeps per station (standardized effort)
- Vegetation Height: Target flowering layer primarily
- Sample Processing: Immediate cooling in portable cooler, field sorting within 2 hours
AI-Powered Image Recognition: The 2026 Game-Changer
Recent advances in artificial intelligence have revolutionized field identification capabilities. Modern smartphone applications now provide real-time species identification with confidence ratings, dramatically reducing the specialized taxonomic knowledge required for Pollinator Decline Surveys for BNG Compliance.
AI Identification Workflow:
- Capture high-resolution photographs of specimens (in-hand or in-situ)
- Upload to AI identification platform (multiple angles recommended)
- Review confidence scores (typically 85%+ indicates reliable identification)
- Verify against regional species lists for quality control
- Store georeferenced images as permanent documentation
The integration of AI tools addresses a critical bottleneck in pollinator surveys: the shortage of expert taxonomists capable of identifying hundreds of native bee species. However, ecologists should maintain voucher specimen collections for quality assurance and verification of novel species records.
Seasonal Survey Windows and Critical Timing for 2026 Insect Population Monitoring
Timing represents perhaps the most critical factor in successful Pollinator Decline Surveys for BNG Compliance: Field Protocols for Ecologists Tracking 2026 Insect Population Crashes. Many pollinator species exhibit narrow seasonal activity windows, and missing peak emergence periods can result in severe underestimation of site biodiversity value.
Understanding Phenological Constraints
Different pollinator groups exhibit distinct seasonal activity patterns:
🌸 Spring Specialists (March-May)
- Early mining bees (Andrena spp.)
- Spring bumblebee queens (Bombus spp.)
- Solitary bees emerging with spring flowers
☀️ Summer Generalists (June-August)
- Peak diversity period for most species
- Worker bumblebees at maximum abundance
- Hoverflies (Syrphidae) highly active
- Butterflies and day-flying moths
🍂 Late-Season Species (September-October)
- Ivy bees (Colletes hederae)
- Late-emerging solitary bees
- Mated bumblebee queens preparing for hibernation
As environmental consultants note, "Many bat and pollinator species have narrow seasonal survey windows, requiring projects to initiate surveys and acoustic monitoring early and integrate seasonal habitat considerations into siting decisions" [5]. This principle applies equally to BNG compliance work.
Recommended Survey Schedule for BNG Baseline Assessment
To capture comprehensive baseline data for achieving 10% Biodiversity Net Gain, implement the following survey schedule:
Phase 1: Early Season (April-May)
- 2-3 pan trap deployments
- 3-4 transect walks during favorable weather
- Focus on spring-flowering plant communities
- Document early-emerging specialist species
Phase 2: Peak Season (June-July)
- 3-4 pan trap deployments
- 4-6 transect walks
- Maximum survey effort during diversity peak
- Comprehensive sweep netting for species inventory
Phase 3: Late Season (August-September)
- 2-3 pan trap deployments
- 3-4 transect walks
- Target late-flowering resources
- Document species missed in earlier surveys
Phase 4: Post-Season Assessment (October)
- Final transect walks for late specialists
- Habitat condition assessment
- Data compilation and analysis
Weather-Dependent Survey Flexibility
The 2026 growing season has exhibited significant weather variability, requiring flexible survey scheduling. Maintain a weather monitoring protocol to optimize field effort:
✅ Ideal Survey Conditions:
- Temperature: 15-28°C
- Cloud cover: <50%
- Wind speed: <20 km/h
- No precipitation within previous 24 hours
- Time since sunrise: >2 hours
❌ Avoid Survey During:
- Heavy cloud cover or rain
- High winds that prevent insect flight
- Extreme temperatures (<13°C or >35°C)
- Early morning when insects are inactive
Integrating Bioblitz Approaches for Rapid Assessment
The Bioblitz Toolkit 2026 [8] provides frameworks for intensive, time-limited biological surveying that can supplement traditional BNG monitoring. A bioblitz involves concentrated effort to document as many species as possible within a defined area and timeframe—typically 24-48 hours.
Bioblitz Applications for BNG Projects:
- Pre-development baseline: Rapid species inventory before site disturbance
- Community engagement: Involve stakeholders in biodiversity documentation
- Seasonal snapshots: Capture diversity during peak activity windows
- Quality control: Verify automated monitoring data with intensive observation
Educational resources through Pollinator.org include Module 6 on monitoring, with recorded content available through December 31, 2026 [7], providing valuable training for ecologists implementing these protocols.
Data Collection, Analysis, and BNG Metric Integration
Collecting field data represents only the first step in Pollinator Decline Surveys for BNG Compliance. Translating raw observations into meaningful BNG metrics requires systematic data management and analysis protocols.
Standardized Data Recording Systems
Implement digital data collection using GPS-enabled tablets or smartphones with offline capability. Essential data fields include:
Site-Level Information:
- Site name and unique identifier
- Grid reference (10-figure minimum)
- Habitat type classification
- Dominant plant species (top 5-10)
- Management history
- Surrounding land use context
Survey-Level Information:
- Date and time (start/end)
- Surveyor name(s)
- Weather conditions (temperature, cloud cover, wind, precipitation)
- Survey method (pan trap, transect, sweep net)
- Survey effort (trap-hours, transect length, sweep count)
Observation-Level Information:
- Species identification (or morphospecies code)
- Abundance count
- Behavior observed
- Plant species visited (for transects)
- Photograph reference numbers
- Confidence rating for identification
Converting Survey Data to BNG Metrics
The UK Biodiversity Metric 4.0 incorporates habitat condition assessments that rely heavily on pollinator indicators. Key criteria include:
Habitat Condition Indicators Influenced by Pollinators:
- Flowering plant diversity — Minimum 5 species flowering simultaneously
- Structural diversity — Varied vegetation heights supporting different pollinator guilds
- Bare ground availability — Essential for ground-nesting bees (5-10% coverage optimal)
- Absence of pesticides — Critical given 2026 contamination findings [6]
- Connectivity to other habitats — Facilitates pollinator movement across landscapes
Survey data directly informs these assessments. For example, documenting 15+ pollinator species during peak season surveys typically indicates "good" habitat condition, while <5 species suggests "poor" condition requiring enhancement.
Pesticide Screening Protocols
Given the widespread pesticide contamination documented in 2025-2026 [6], incorporating contamination screening into BNG surveys has become essential. Pesticide exposure affects bees, pollen, and wax across all colony strength levels, with LCMS analysis detecting 95 different compounds.
Practical Pesticide Assessment for BNG Sites:
- Visual indicators: Document evidence of recent pesticide application (spray drift, vegetation damage)
- Buffer zone assessment: Measure distance to agricultural fields with active pesticide use
- Pollen sampling: Collect pollen loads from captured bees for laboratory analysis (optional but recommended for high-value sites)
- Historical land use review: Research site pesticide application history through agricultural records
For developers seeking to purchase biodiversity units, demonstrating pesticide-free management significantly increases habitat value and marketability.
Statistical Analysis and Trend Detection
Detecting population declines requires appropriate statistical approaches. Recommended analyses include:
Abundance Trends:
- Calculate species richness (total species count)
- Determine Shannon diversity index (accounts for evenness)
- Compare abundance between survey rounds using paired tests
- Plot population trends across multiple years
Community Composition:
- Ordination analysis (NMDS, PCA) to visualize community changes
- Indicator species analysis to identify declining specialists
- Functional diversity metrics (body size, nesting behavior, foraging range)
Habitat Associations:
- Correlation analysis between pollinator metrics and habitat variables
- Regression models predicting species richness from habitat condition
- Spatial analysis of pollinator distribution patterns
For small development projects, simplified analysis focusing on species richness and abundance trends may suffice, while larger schemes require comprehensive statistical treatment.
Quality Assurance, Reporting, and Long-Term Monitoring Frameworks
Ensuring data quality and establishing long-term monitoring frameworks represents the final critical component of Pollinator Decline Surveys for BNG Compliance: Field Protocols for Ecologists Tracking 2026 Insect Population Crashes.
Quality Control Procedures
Field Quality Assurance:
- Voucher specimen collection: Retain 3-5 specimens per species for verification
- Photographic documentation: Minimum 2 high-resolution images per species
- Duplicate surveys: Conduct 10% of surveys with two independent observers
- Equipment calibration: Verify pan trap colors annually, replace faded bowls
- Weather data validation: Cross-reference field observations with weather station data
Laboratory Quality Assurance:
- Expert verification: Submit 20% of AI identifications to taxonomic specialists
- Reference collection comparison: Maintain site-specific reference collection
- Morphospecies consistency: Use standardized morphospecies codes across surveyors
- Data entry validation: Implement range checks and logical constraints in databases
BNG Compliance Reporting Requirements
Reports for planning authorities must clearly demonstrate how pollinator surveys inform BNG calculations. Essential report sections include:
1. Executive Summary
- Site location and development context
- Survey effort summary (dates, methods, conditions)
- Key findings (species richness, notable species, population trends)
- BNG implications and recommendations
2. Methodology
- Detailed protocol descriptions with references to standard methods [3]
- Surveyor qualifications and experience
- Equipment specifications
- Weather conditions and any survey limitations
3. Results
- Species inventory with abundance data
- Habitat condition assessment scores
- Comparison to regional/national baselines
- Statistical analysis of trends (where applicable)
- Maps showing survey locations and pollinator hotspots
4. BNG Metric Calculations
- Baseline habitat condition scores
- Justification for condition assessments based on pollinator data
- Projected post-development scores
- Enhancement recommendations to achieve 10% gain
5. Monitoring and Management Recommendations
- Long-term monitoring schedule
- Habitat management prescriptions
- Contingency measures if targets not met
- Adaptive management framework
For guidance on comprehensive reporting, consult resources on conducting biodiversity impact assessments.
30-Year Monitoring Frameworks
BNG regulations require monitoring for minimum 30-year periods, necessitating sustainable, cost-effective protocols. Recommended long-term monitoring includes:
Years 1-5 (Establishment Phase):
- Annual surveys using full protocol (pan traps, transects, sweep netting)
- Quarterly habitat condition assessments
- Adaptive management based on results
- High-intensity monitoring to detect early problems
Years 6-15 (Consolidation Phase):
- Biennial surveys during peak season
- Annual habitat condition assessments
- Reduced survey effort as populations stabilize
- Focus on indicator species trends
Years 16-30 (Maintenance Phase):
- Surveys every 3-5 years
- Biennial habitat condition assessments
- Minimal intervention management
- Long-term trend analysis
Addressing Survey Limitations and Uncertainties
Transparent reporting of limitations strengthens credibility. Common limitations include:
- Taxonomic resolution: Not all specimens identifiable to species level
- Weather constraints: Suboptimal conditions may reduce capture rates
- Seasonal coverage: Budget constraints may limit survey frequency
- Observer variability: Different surveyors may record different observations
- Detection probability: Not all present species will be detected
Quantify uncertainty where possible using confidence intervals, detection probability models, or sensitivity analyses showing how results change under different assumptions.
Integration with Broader Ecological Surveys
Pollinator surveys rarely occur in isolation. Integrate findings with:
- Botanical surveys: Link pollinator diversity to floral resource availability
- Habitat mapping: Identify spatial patterns in pollinator distribution
- Soil assessments: Ground-nesting bee abundance correlates with soil characteristics
- Hydrological surveys: Wetland pollinators require specific moisture regimes
- Landscape connectivity analysis: Assess pollinator movement corridors
For landowners interested in selling biodiversity units, comprehensive ecological data packages including pollinator surveys command premium prices.
Conclusion
The 2026 pollinator crisis demands immediate action from ecological consultants implementing Pollinator Decline Surveys for BNG Compliance: Field Protocols for Ecologists Tracking 2026 Insect Population Crashes. With bee pollination contributing over $15 billion annually to crop value [2] and widespread population crashes documented across multiple continents, accurate baseline data collection has never been more critical for biodiversity conservation and regulatory compliance.
Successful pollinator surveys for BNG projects require integration of multiple methodologies: pan traps for passive monitoring, transect walks for behavioral observation, sweep netting for comprehensive inventories, and AI-powered identification tools for rapid species determination. Timing surveys to capture spring specialists, summer generalists, and late-season species ensures comprehensive baseline documentation, while quality assurance procedures including voucher specimen collection and expert verification maintain scientific rigor.
The evidence is clear: pesticide contamination affects colonies of all strength levels [6], geographic density varies dramatically across landscapes [6], and narrow seasonal windows demand early survey initiation [5]. Ecologists must adapt traditional protocols to address these 2026 realities while meeting the stringent documentation requirements for BNG compliance.
Next Steps for Ecologists and Developers
Immediate Actions:
- Schedule spring surveys now — April-May surveys capture early specialists often missed in summer-only protocols
- Invest in AI identification tools — Reduce reliance on scarce taxonomic expertise while maintaining data quality
- Establish baseline monitoring — Begin quarterly surveys to document population trends before development
- Review pesticide history — Assess contamination risks that may affect habitat condition scores
- Develop 30-year monitoring plans — Ensure long-term compliance with BNG requirements
Strategic Planning:
- Budget appropriately — Comprehensive pollinator surveys typically require 5-8 field visits across the growing season
- Engage qualified ecologists — Verify surveyors have specific pollinator survey experience and relevant training
- Integrate with habitat creation — Design enhancement measures based on survey findings to maximize BNG gains
- Consider off-site units — Where on-site enhancement proves insufficient, explore biodiversity unit purchases
The protocols outlined in this guide provide ecologists with the tools needed to document pollinator populations accurately, contribute to conservation efforts during this critical period, and ensure development projects meet their BNG obligations. As pollinator populations continue declining through 2026 and beyond, the data collected through these standardized surveys will prove invaluable for tracking recovery efforts and informing evidence-based conservation policy.
For personalized guidance on implementing pollinator surveys for your specific BNG project, contact our team of specialist ecologists who can develop tailored monitoring protocols that balance scientific rigor with practical field constraints and regulatory requirements.
References
[1] Public Consultation Federal Pollinators Plan 2026 2028 – https://www.biodiv.be/news/public-consultation-federal-pollinators-plan-2026-2028
[2] 2026 Quarterly Colony Loss Surveys Enumerator Training – https://www.nasda.org/wp-content/uploads/2025/12/2026-Quarterly-Colony-Loss-Surveys-Enumerator-Training.pdf
[3] Streamlined Bee Monitoring Protocol For Assessing – https://xerces.org/publications/identification-monitoring-guides/streamlined-bee-monitoring-protocol-for-assessing
[4] Us Beekeeping Survey Blog26 – https://apiaryinspectors.org/US-beekeeping-survey-blog26.1
[5] What You Need To Know In The Rapidly Evolving Landscape Of Bat Regulations – https://www.swca.com/news-insights/what-you-need-to-know-in-the-rapidly-evolving-landscape-of-bat-regulations/
[6] 2026 Abrc Proceedings – https://beeculture.com/2026-abrc-proceedings/
[7] Module 6 Monitoring Psc 2026 – https://pollinator.org/pollinator.org/assets/globals/Module-6-Monitoring-PSC-2026.pdf
[8] Bioblitz Toolkit 2026 – https://www.pollinator.org/pollinator.org/assets/generalFiles/Bioblitz-Toolkit-2026.pdf
