
{"cover":"Professional landscape format (1536×1024) hero image with bold text overlay 'Soundscape Ecology for Biodiversity Net Gain: Acoustic Survey Methods to Capture Ecosystem Health in 2026' in extra large 72pt white sans-serif font with dark shadow effect, positioned in upper third with perfect alignment. Background shows split composition: left side features acoustic recording equipment mounted on tree in lush restored woodland habitat with visible insects and mammals, right side displays digital waveform spectrograms and acoustic indices visualizations in vibrant green and blue gradients. Color palette: deep forest green, electric blue, white text, high contrast. Magazine cover aesthetic, editorial quality, professional environmental monitoring theme with technological innovation elements.","content":["Detailed landscape format (1536×1024) editorial image showing close-up of professional passive acoustic monitoring device mounted on oak tree trunk in restored grassland habitat during golden hour. Scene includes visible wildlife: grasshoppers on stems, bat silhouettes in sky, small mammal near base. Foreground shows acoustic recorder with weatherproof housing and omnidirectional microphone array. Middle ground displays diverse flowering plants and native grasses. Background features habitat management zones with information overlays showing frequency ranges for different taxa: insects 2-20kHz, bats 20-120kHz, mammals 0.5-10kHz. Warm natural lighting, shallow depth of field, conservation technology aesthetic, professional field survey documentation style.","Detailed landscape format (1536×1024) infographic-style image displaying acoustic indices comparison across three habitat types: ancient woodland, restored meadow, and degraded site. Split-screen composition shows three spectrograms stacked vertically with color-coded frequency bands and time axes. Left panel includes visual representations of Acoustic Complexity Index (ACI), Normalized Difference Soundscape Index (NDSI), and Bioacoustic Index calculations with numerical values and bar graphs. Right panel features illustrated cross-sections of each habitat type showing biodiversity levels with species icons for insects, birds, bats, and small mammals. Professional data visualization style with clean typography, scientific color scheme of greens, blues, and earth tones, grid layout, educational diagram aesthetic for biodiversity assessment documentation.","Detailed landscape format (1536×1024) conceptual image showing integrated biodiversity monitoring workflow for BNG verification in 2026. Central focus on tablet device displaying Vector Sustainability Dashboard interface with real-time acoustic data streams, biodiversity unit calculations, and habitat condition graphs. Surrounding the tablet are physical elements: DNA sample vials with eDNA labels, field notebooks with species sketches, acoustic recorder downloading data via cable, habitat survey maps with marked boundaries. Background shows split scene of field ecologist in high-visibility vest working in restored wetland on left, and office environment with BNG assessment reports and DEFRA Metric 4.1 documentation on right. Modern professional conservation technology aesthetic, bright natural lighting mixed with screen glow, comprehensive biodiversity assessment theme, documentary photography style."]"}
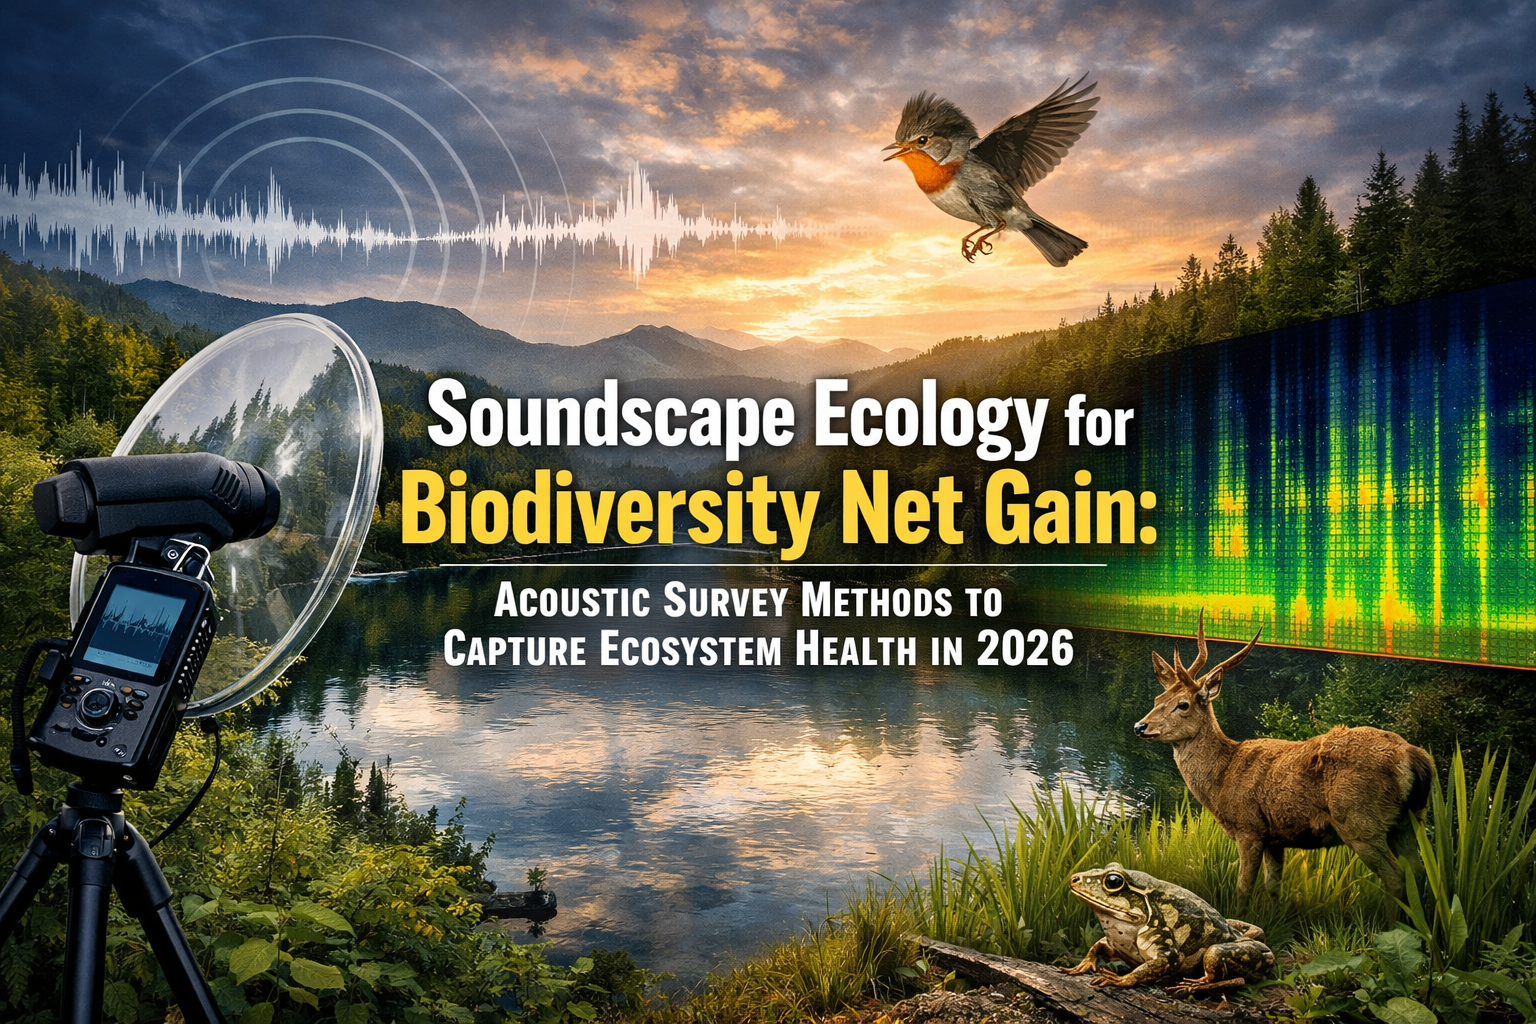
Recent research reveals that acoustic indices can now distinguish fundamental differences in daily activity patterns between tropical and temperate forest ecosystems with unprecedented precision[2]. This breakthrough represents more than academic curiosity—it signals a paradigm shift in how developers, ecologists, and planners can verify biodiversity outcomes for mandatory net gain requirements. Soundscape Ecology for Biodiversity Net Gain: Acoustic Survey Methods to Capture Ecosystem Health in 2026 has emerged as a powerful, cost-effective approach to quantifying ecosystem recovery across terrestrial and marine environments, moving beyond traditional species-by-species surveys to capture the full acoustic signature of healthy habitats.
As England's Biodiversity Net Gain (BNG) legislation now mandates a minimum 10% improvement in biodiversity for all developments[5], passive acoustic monitoring offers developers and land managers a scientifically robust method to track habitat quality over the required 30-year management periods. This article explores how acoustic survey techniques—from insect choruses to mammalian vocalizations—provide quantifiable metrics for BNG verification in restored habitats.

Key Takeaways
- 🎵 Acoustic indices now measure landscape-scale biodiversity patterns rather than individual species, enabling comprehensive ecosystem health assessments for BNG compliance
- 📊 Passive acoustic monitoring captures insects, bats, small mammals, and amphibians simultaneously, providing cost-effective long-term data for 30-year habitat management verification
- 🔬 Combined bioacoustics and eDNA approaches create high-quality datasets that identify sensitive species and life stages, optimizing timing for development operations
- 📈 Real-time sustainability dashboards integrate acoustic data with DEFRA Metric 4.1 calculations, enabling project managers to monitor biodiversity units dynamically
- 🌊 Marine soundscape ecology supports offshore renewable projects in achieving Net Gain targets aligned with international biodiversity frameworks
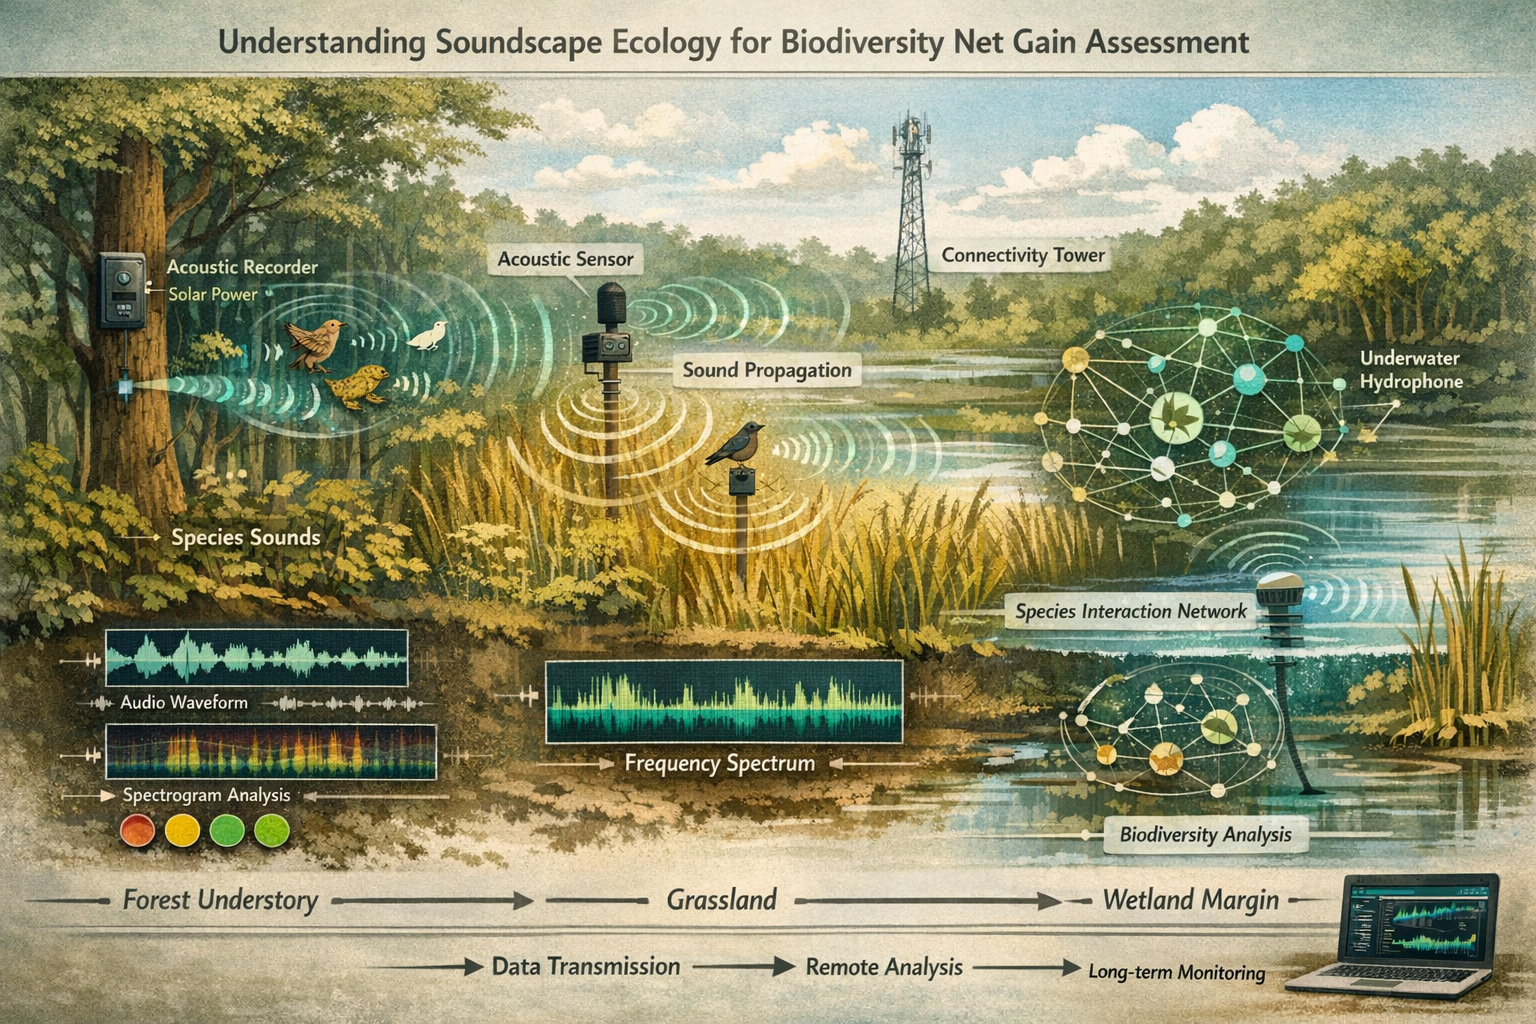
Understanding Soundscape Ecology for Biodiversity Net Gain Assessment
Soundscape ecology represents the study of environmental sounds produced by biological, geophysical, and anthropogenic sources within a defined landscape. For BNG applications in 2026, this discipline has evolved from primarily bird-focused monitoring to encompass the full spectrum of acoustic biodiversity—including insects, bats, terrestrial mammals, and amphibians that collectively indicate ecosystem health.
The Shift from Species-Level to Landscape-Scale Monitoring
Traditional biodiversity surveys focus on identifying and counting individual species, a labor-intensive process requiring specialized taxonomic expertise. Soundscape ecology fundamentally changes this approach by analyzing acoustic patterns that reflect entire ecological communities[4]. Rather than asking "which species are present?", acoustic indices answer "how functionally diverse and healthy is this ecosystem?"
This transition proves particularly valuable for BNG assessments where developers must demonstrate measurable improvements in habitat condition over baseline surveys. Acoustic metrics provide continuous, quantifiable data that correlate with biodiversity richness, habitat complexity, and ecosystem functionality.
Key Acoustic Indices for BNG Verification
Several standardized acoustic indices have gained prominence for biodiversity assessment in 2026:
| Acoustic Index | What It Measures | BNG Application |
|---|---|---|
| Acoustic Complexity Index (ACI) | Temporal variability in sound intensity | Indicates presence of diverse vocalizing species and habitat structural complexity |
| Normalized Difference Soundscape Index (NDSI) | Ratio of biological to anthropogenic sounds | Measures habitat quality by quantifying human disturbance levels |
| Bioacoustic Index (BI) | Sound energy distribution across frequency bands | Reflects species richness and functional diversity of acoustic communities |
| Acoustic Diversity Index (ADI) | Evenness of sound distribution across frequencies | Correlates with habitat heterogeneity and ecological niche diversity |
| Acoustic Evenness Index (AEI) | Uniformity of acoustic activity | Indicates balanced, mature ecological communities versus disturbed systems |
These indices provide objective, repeatable measurements that can be calculated automatically from continuous acoustic recordings, eliminating observer bias and enabling cost-effective long-term monitoring required for 30-year BNG management plans[5].
Frequency Ranges and Target Taxa
Different taxonomic groups vocalize within characteristic frequency ranges, allowing targeted analysis:
- Insects (grasshoppers, crickets, cicadas): 2-20 kHz
- Bats: 20-120 kHz (ultrasonic)
- Small mammals (voles, shrews, rodents): 0.5-10 kHz
- Amphibians: 0.5-8 kHz
- Birds: 1-12 kHz
- Large mammals: 0.02-2 kHz (infrasonic to low frequency)
By deploying recorders capable of capturing this full spectrum (typically 0-192 kHz sampling rate), a single monitoring station can simultaneously assess multiple taxonomic groups—a significant advantage over traditional survey methods that require separate protocols for each group.
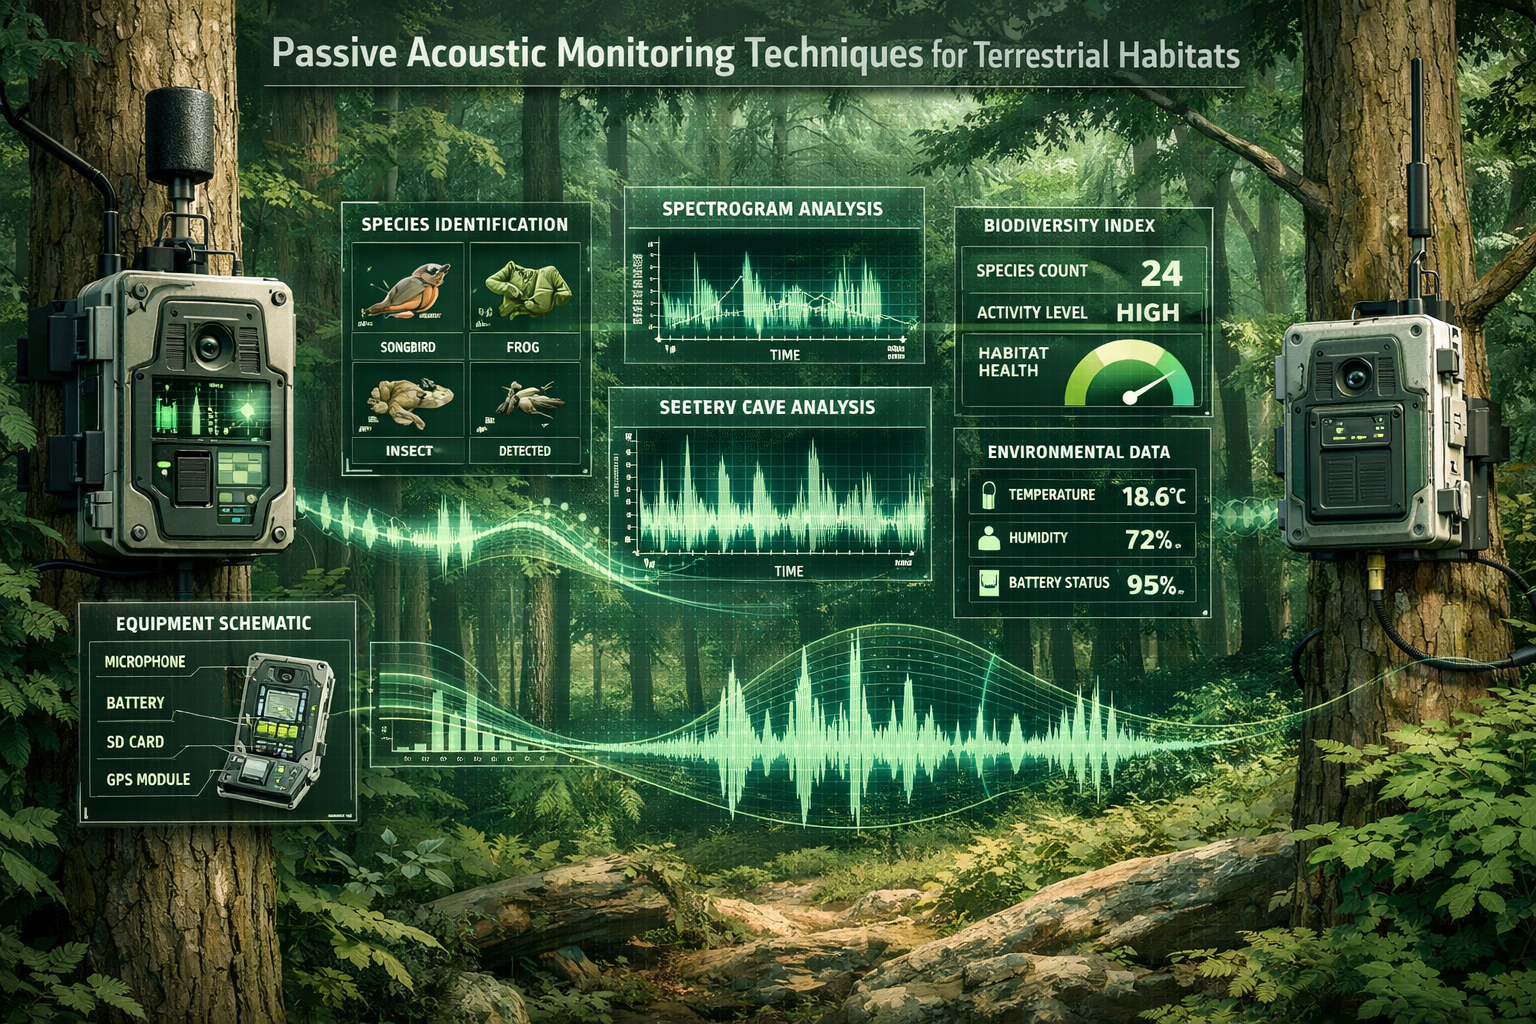
Passive Acoustic Monitoring Techniques for Terrestrial Habitats
Passive acoustic monitoring (PAM) involves deploying autonomous recording devices that continuously capture environmental sounds without human presence. For Soundscape Ecology for Biodiversity Net Gain: Acoustic Survey Methods to Capture Ecosystem Health in 2026, PAM offers unparalleled advantages in documenting baseline conditions and tracking habitat recovery.
Equipment and Deployment Strategies
Modern acoustic recorders combine weather-resistant housings, long-battery life, and high-capacity storage to enable months of continuous operation. Key considerations for BNG applications include:
Recording Schedule Design: Rather than continuous 24/7 recording (which generates enormous data volumes), strategic sampling captures peak activity periods. Research shows that dawn and dusk recordings (2 hours each) combined with midnight sampling effectively captures nocturnal mammals and insects while remaining computationally manageable[2].
Spatial Coverage: For achieving 10% Biodiversity Net Gain, acoustic monitoring stations should be distributed to represent different habitat types within the development site. A typical approach places one recorder per 5-10 hectares, with additional units at ecotones (habitat boundaries) where biodiversity often peaks.
Temporal Duration: Baseline surveys should span at least one full breeding season (April-September in temperate regions) to capture seasonal variation. Post-development monitoring continues quarterly across the 30-year management period, with automated analysis flagging significant changes requiring intervention.
Capturing Insect Soundscapes
Insects represent the most diverse and abundant terrestrial animals, yet they're frequently underrepresented in traditional biodiversity surveys. Acoustic monitoring revolutionizes insect assessment by passively recording orthopteran (grasshoppers, crickets, katydids) choruses that indicate grassland and meadow habitat quality.
Orthopteran acoustic diversity correlates strongly with overall insect richness, making these vocalizations excellent indicators for restored grassland habitats—a common BNG delivery mechanism. Analysis techniques include:
- Spectrogram cross-correlation: Automated identification of species-specific call patterns
- Frequency occupancy metrics: Measuring how many frequency bands contain insect activity
- Temporal niche partitioning: Documenting how different species partition acoustic space by time of day
For BNG verification, increases in insect acoustic diversity demonstrate successful habitat establishment, particularly important for sites targeting on-site biodiversity delivery.
Monitoring Bat Populations Through Ultrasonic Recording
Bats serve as excellent bioindicators due to their sensitivity to habitat quality, pesticide use, and landscape connectivity. Ultrasonic acoustic monitoring (20-120 kHz) enables species-level identification through echolocation call characteristics while quantifying overall bat activity levels.
For BNG applications, bat acoustic data provides:
- Species richness metrics: Number of bat species using restored habitats
- Activity indices: Passes per night indicating foraging habitat value
- Behavioral analysis: Feeding buzzes versus commuting calls reveal habitat functionality
- Temporal patterns: Seasonal use documenting breeding colony establishment
Importantly, acoustic monitoring detects rare and cryptic bat species that visual surveys miss, ensuring compliance with protected species legislation alongside BNG requirements.
Small Mammal and Amphibian Acoustic Detection
Recent advances in machine learning enable identification of small mammal vocalizations previously dismissed as background noise. Rodents, shrews, and voles produce ultrasonic social calls (20-90 kHz) that acoustic monitoring captures, providing data on these ecologically important but difficult-to-survey groups.
Similarly, amphibian breeding choruses (frogs, toads, newts) produce distinctive calls that acoustic analysis quantifies automatically. For wetland restoration projects—a high-value habitat type in BNG calculations—amphibian acoustic activity provides direct evidence of successful breeding habitat creation.
Integrating Acoustic Data with BNG Metric Calculations
The challenge for Soundscape Ecology for Biodiversity Net Gain: Acoustic Survey Methods to Capture Ecosystem Health in 2026 lies in translating acoustic indices into the biodiversity units required by DEFRA Metric 4.1[5]. This integration represents the frontier of applied soundscape ecology.
Acoustic Indices as Habitat Condition Indicators
The DEFRA Metric calculates biodiversity units based on habitat type, area, and condition. Condition assessments traditionally rely on botanical surveys and structural measurements, but acoustic indices offer complementary quantitative data:
High-quality habitats exhibit:
- Elevated Acoustic Complexity Index (diverse vocalizing species)
- High Bioacoustic Index (broad frequency occupancy)
- Favorable NDSI ratios (biological sounds dominate over anthropogenic noise)
- Distinct dawn and dusk acoustic peaks (indicating healthy diurnal activity patterns)
Degraded habitats show:
- Low acoustic diversity
- Anthropogenic noise dominance
- Reduced temporal variation
- Absence of indicator species calls
By establishing acoustic baselines for reference habitats of known condition, practitioners can develop calibration curves that predict condition scores from acoustic metrics—enabling rapid, objective habitat assessments.
Real-Time Monitoring and Adaptive Management
The Vector Sustainability Dashboard introduced in 2026 exemplifies how acoustic data integrates with BNG compliance workflows[3]. This platform enables project managers to:
- Monitor biodiversity units dynamically as habitats develop
- Receive alerts when acoustic indices fall below target thresholds
- Adjust management interventions based on real-time ecosystem response
- Generate compliance reports automatically for local planning authorities
This technological integration transforms BNG from a one-time planning box-ticking exercise into an adaptive management process where acoustic monitoring provides continuous feedback on habitat trajectory.
Case Study: Restored Woodland Acoustic Signatures
Research comparing acoustic patterns across temperate forest types demonstrates practical applications[2]. Ancient woodlands exhibit distinct acoustic signatures characterized by:
- High dawn chorus intensity (diverse breeding bird communities)
- Consistent dusk insect activity (stable invertebrate populations)
- Seasonal bat activity peaks (established foraging territories)
- Low anthropogenic noise intrusion
Newly restored woodlands initially show simplified acoustic patterns but develop increasing complexity over 5-15 years as structural diversity increases and specialist species colonize. Acoustic monitoring documents this trajectory, providing evidence of improving habitat condition that supports BNG assessment requirements.
For developers managing long-term BNG obligations, acoustic data demonstrates compliance without requiring annual intensive field surveys—reducing monitoring costs while maintaining scientific rigor.
Marine Soundscape Ecology for Offshore BNG Applications
While terrestrial applications dominate current practice, marine soundscape ecology has advanced rapidly for offshore renewable energy projects required to achieve Net Gain targets[6]. The principles of Soundscape Ecology for Biodiversity Net Gain: Acoustic Survey Methods to Capture Ecosystem Health in 2026 apply equally to underwater environments.
Combined Bioacoustics and eDNA Approaches
Fugro's SEAWATCH® program demonstrates how integrated monitoring creates comprehensive biodiversity datasets[1]. This approach combines:
- Continuous underwater acoustic recording: Capturing marine mammal vocalizations, fish choruses, and invertebrate sounds
- Environmental DNA (eDNA) sampling: Detecting species presence from genetic material in water samples
- Geophysical surveys: Mapping seabed habitats and structural complexity
This holistic methodology addresses the challenge that no single technique captures complete marine biodiversity. Acoustic monitoring excels at detecting mobile, vocal species (whales, dolphins, fish) while eDNA reveals cryptic and non-vocal organisms.
For offshore wind developments, this combined approach:
- Identifies sensitive species and critical life stages (breeding, migration, feeding)
- Times construction operations to minimize disturbance
- Monitors ecosystem recovery post-construction
- Verifies that Net Gain targets are achieved
Marine Acoustic Indices and Ecosystem Health
Underwater soundscapes reflect ecosystem functionality through:
- Fish choruses: Many fish species produce sounds during spawning, with chorus intensity correlating to population health
- Invertebrate sounds: Snapping shrimp, sea urchins, and other invertebrates create acoustic signatures indicating reef health
- Mammal vocalizations: Whale and dolphin calls reveal species presence, behavior, and habitat use
- Anthropogenic noise: Vessel traffic and construction activity quantified through acoustic metrics
The Sound Pressure Level (SPL) across frequency bands provides a marine equivalent to terrestrial acoustic indices, with healthy marine ecosystems exhibiting characteristic spectral patterns distinct from degraded sites.
Offshore Renewables Net Gain Roadmap
The 2026 roadmap for offshore renewable energy establishes that projects must deliver Net Gain rather than No Net Loss[6], aligning with the Kunming-Montreal Global Biodiversity Framework. Acoustic monitoring provides the long-term data infrastructure to:
- Establish baseline conditions before construction
- Monitor impact during operational phases
- Verify ecosystem recovery and enhancement
- Demonstrate compliance with international biodiversity commitments
This represents a significant evolution from impact mitigation toward proactive biodiversity enhancement, with soundscape ecology providing the measurement framework.
Overcoming Challenges and Future Directions
Despite significant advances, implementing Soundscape Ecology for Biodiversity Net Gain: Acoustic Survey Methods to Capture Ecosystem Health in 2026 faces practical challenges that ongoing research addresses.
Data Volume and Analysis Bottlenecks
Continuous acoustic monitoring generates enormous datasets—a single recorder operating year-round produces terabytes of audio data. While automated analysis algorithms extract acoustic indices efficiently, species-level identification still requires significant computational resources and validation.
Solutions emerging in 2026 include:
- Cloud-based processing platforms that analyze data automatically upon upload
- Machine learning models trained on regional species libraries for automated identification
- Hybrid approaches where acoustic indices provide rapid screening, with detailed analysis triggered by threshold exceedances
- Edge computing devices that process data on-site, transmitting only summary metrics
Standardization and Regulatory Acceptance
For acoustic methods to gain widespread adoption in BNG reporting, standardized protocols must emerge. Current efforts focus on:
- Establishing reference acoustic libraries for UK habitat types
- Developing calibration relationships between acoustic indices and DEFRA Metric condition scores
- Creating guidance documents for local planning authorities on interpreting acoustic data
- Integrating acoustic monitoring into professional ecology training programs
As regulatory frameworks evolve, acoustic evidence will likely gain equivalence to traditional survey data, particularly for long-term monitoring where cost-effectiveness becomes paramount.
Complementing Rather Than Replacing Traditional Surveys
It's crucial to emphasize that acoustic monitoring complements rather than replaces comprehensive ecological surveys. Baseline BNG assessments still require botanical surveys, habitat mapping, and protected species surveys to meet regulatory requirements.
However, acoustic monitoring excels at:
- Long-term trend detection across 30-year management periods
- Detecting nocturnal and cryptic species missed by visual surveys
- Providing continuous data rather than snapshot surveys
- Reducing costs for ongoing compliance monitoring
The optimal approach integrates acoustic monitoring within comprehensive biodiversity assessment frameworks, leveraging each method's strengths.
Expanding Taxonomic Coverage
Current acoustic methods focus on vocal species, but many important biodiversity components remain acoustically silent. Future developments will expand coverage through:
- Camera trap integration: Combining acoustic triggers with automated photography for visual confirmation
- Vibration sensors: Detecting substrate-borne signals from invertebrates and burrowing mammals
- Multi-sensor networks: Integrating acoustic, visual, and environmental sensors for comprehensive monitoring
These advances will create increasingly complete pictures of ecosystem health, supporting robust BNG verification.
Practical Implementation for Developers and Landowners
For developers and landowners seeking to implement acoustic monitoring for BNG compliance, several practical considerations guide successful deployment.
Selecting Appropriate Monitoring Intensity
The intensity of acoustic monitoring should scale with project size and biodiversity significance:
Small developments (< 1 hectare): Single acoustic recorder with quarterly sampling across one year baseline and annual post-development monitoring
Medium developments (1-10 hectares): Multiple recorders representing habitat diversity, seasonal baseline sampling, bi-annual post-development monitoring
Major developments (> 10 hectares): Comprehensive acoustic monitoring networks, continuous baseline recording, quarterly post-development analysis with real-time dashboards
Small development projects benefit from acoustic monitoring's cost-effectiveness, while large schemes leverage advanced analytics and integration with sustainability platforms.
Budgeting for Acoustic Surveys
Typical costs for acoustic monitoring in 2026 include:
- Equipment: £500-£2,000 per recorder (depending on specifications)
- Deployment and retrieval: £200-£500 per visit
- Data analysis: £1,000-£5,000 per site per year (depending on intensity)
- Reporting: £500-£2,000 per compliance report
Compared to repeated manual surveys over 30 years, acoustic monitoring offers substantial cost savings while providing superior data quality and temporal coverage.
Working with Specialist Consultants
While acoustic equipment has become more accessible, interpreting results for BNG compliance requires ecological expertise. Professional biodiversity surveyors can:
- Design monitoring protocols appropriate to site conditions
- Calibrate acoustic indices to habitat condition scores
- Integrate acoustic data with DEFRA Metric 4.1 calculations
- Prepare compliance reports for local planning authorities
- Advise on adaptive management responses to monitoring results
Engaging specialists early in project planning ensures acoustic monitoring integrates seamlessly with overall BNG strategies.
Conclusion
Soundscape Ecology for Biodiversity Net Gain: Acoustic Survey Methods to Capture Ecosystem Health in 2026 represents a paradigm shift in how we measure and verify biodiversity outcomes. By capturing the acoustic signatures of insects, bats, small mammals, amphibians, and marine life, passive monitoring provides continuous, quantifiable data that demonstrates ecosystem recovery across the 30-year management periods now required by law[5].
The integration of acoustic indices with DEFRA Metric 4.1 calculations, combined with real-time monitoring platforms, transforms BNG from a compliance burden into an adaptive management opportunity. Developers can track habitat development dynamically, intervening when needed to ensure targets are met. Landowners managing off-site biodiversity units can demonstrate habitat quality improvements with objective data that commands premium values.
As offshore renewable projects adopt Net Gain targets aligned with international frameworks[6], and as combined bioacoustics-eDNA approaches mature[1], soundscape ecology will become increasingly central to biodiversity assessment across terrestrial and marine environments.
Next Steps for Implementation
For those looking to incorporate acoustic monitoring into BNG strategies:
- Assess your project's monitoring needs based on size, habitat complexity, and regulatory requirements
- Consult with acoustic ecology specialists to design appropriate protocols and select equipment
- Establish baseline acoustic signatures before development begins, capturing seasonal variation
- Integrate acoustic data with traditional surveys and DEFRA Metric calculations
- Implement adaptive management using real-time monitoring to optimize habitat outcomes
- Maintain long-term monitoring across the 30-year management period, leveraging cost-effective automated analysis
To explore how acoustic monitoring can support your specific BNG requirements, contact biodiversity specialists who can provide tailored advice on survey design, regulatory compliance, and integration with comprehensive biodiversity strategies.
The future of biodiversity assessment lies in listening—to the insects, bats, mammals, and marine life whose collective voices reveal ecosystem health. By embracing soundscape ecology, we create more robust, cost-effective, and scientifically rigorous approaches to achieving genuine biodiversity net gain.
References
[1] Holistic Biodiversity Monitoring Combining Bioacoustics And Edna To Deepen Our Understanding Of Marine Life – https://www.fugro.com/news/long-reads/2026/holistic-biodiversity-monitoring-combining-bioacoustics-and-edna-to-deepen-our-understanding-of-marine-life
[2] Global%20ecology%20and%20biogeography%20 %202026%20 %20berman%20 %20acoustic%20indices%20reveal%20fundamental%20differences%20in%20daily%20phenology%20of – https://kar.kent.ac.uk/113406/1/Global%20Ecology%20and%20Biogeography%20-%202026%20-%20Berman%20-%20Acoustic%20Indices%20Reveal%20Fundamental%20Differences%20in%20Daily%20Phenology%20of.pdf
[3] Watch – https://www.youtube.com/watch?v=lucVHr-5MBE
[4] Aaua Dl – https://dael.euracoustics.org/bin/EAA/aaua_dl?document_id=51939
[5] The State Of Biodiversity Net Gain In 2026 Key Policy Updates – https://biodiversity-netgain.co.uk/the-state-of-biodiversity-net-gain-in-2026-key-policy-updates/
[6] Gingr Whitepaper 2026 – https://tethys.pnnl.gov/sites/default/files/publications/Gingr_whitepaper_2026.pdf
