
Wildlife across the globe faces an unprecedented crisis. As we navigate through 2026, the evidence is clear: vertebrate populations exposed to multiple threats decline faster than those facing single pressures alone. Understanding Interacting Threats in Wildlife Populations: Multi-Pressure Survey Strategies for 2026 Biodiversity Decline has become essential for conservation professionals, biodiversity surveyors, and developers committed to protecting our natural heritage.
Recent global analysis of 3,129 vertebrate populations spanning 1950-2020 reveals a disturbing pattern—combinations of climate change, disease, pollution, and invasive species accelerate population declines far beyond what habitat loss or exploitation alone can cause [1]. With average vertebrate populations having declined by 73% since 1970 [2], the need for integrated survey methodologies has never been more urgent.
This comprehensive guide explores how biodiversity surveyors can move beyond single-factor assessments to implement multi-pressure monitoring protocols that capture the complex reality of wildlife decline in 2026.
Key Takeaways
- Multiple threats compound wildlife decline: Populations facing combined pressures decline significantly faster than those affected by single threats, requiring integrated assessment approaches
- Freshwater ecosystems face critical collapse: With 85% population decline since 1970, freshwater vertebrates need immediate multi-pressure intervention strategies
- Regional disparities demand localized protocols: Latin America's 94% decline versus Asia Pacific's 55% requires region-specific survey methodologies
- BNG implementation requires vertebrate monitoring: Achieving Biodiversity Net Gain targets depends on understanding interacting threats to wildlife populations
- Small-ranged species face extinction risk: Limited geographical ranges make certain vertebrates critically vulnerable to even minor habitat changes
Understanding Interacting Threats in Wildlife Populations
The Compound Effect of Multiple Pressures
The traditional approach to wildlife assessment—examining threats in isolation—no longer reflects ecological reality. Research from Bristol University demonstrates that vertebrate populations experiencing multiple simultaneous threats decline at accelerated rates compared to populations facing single pressures [1].
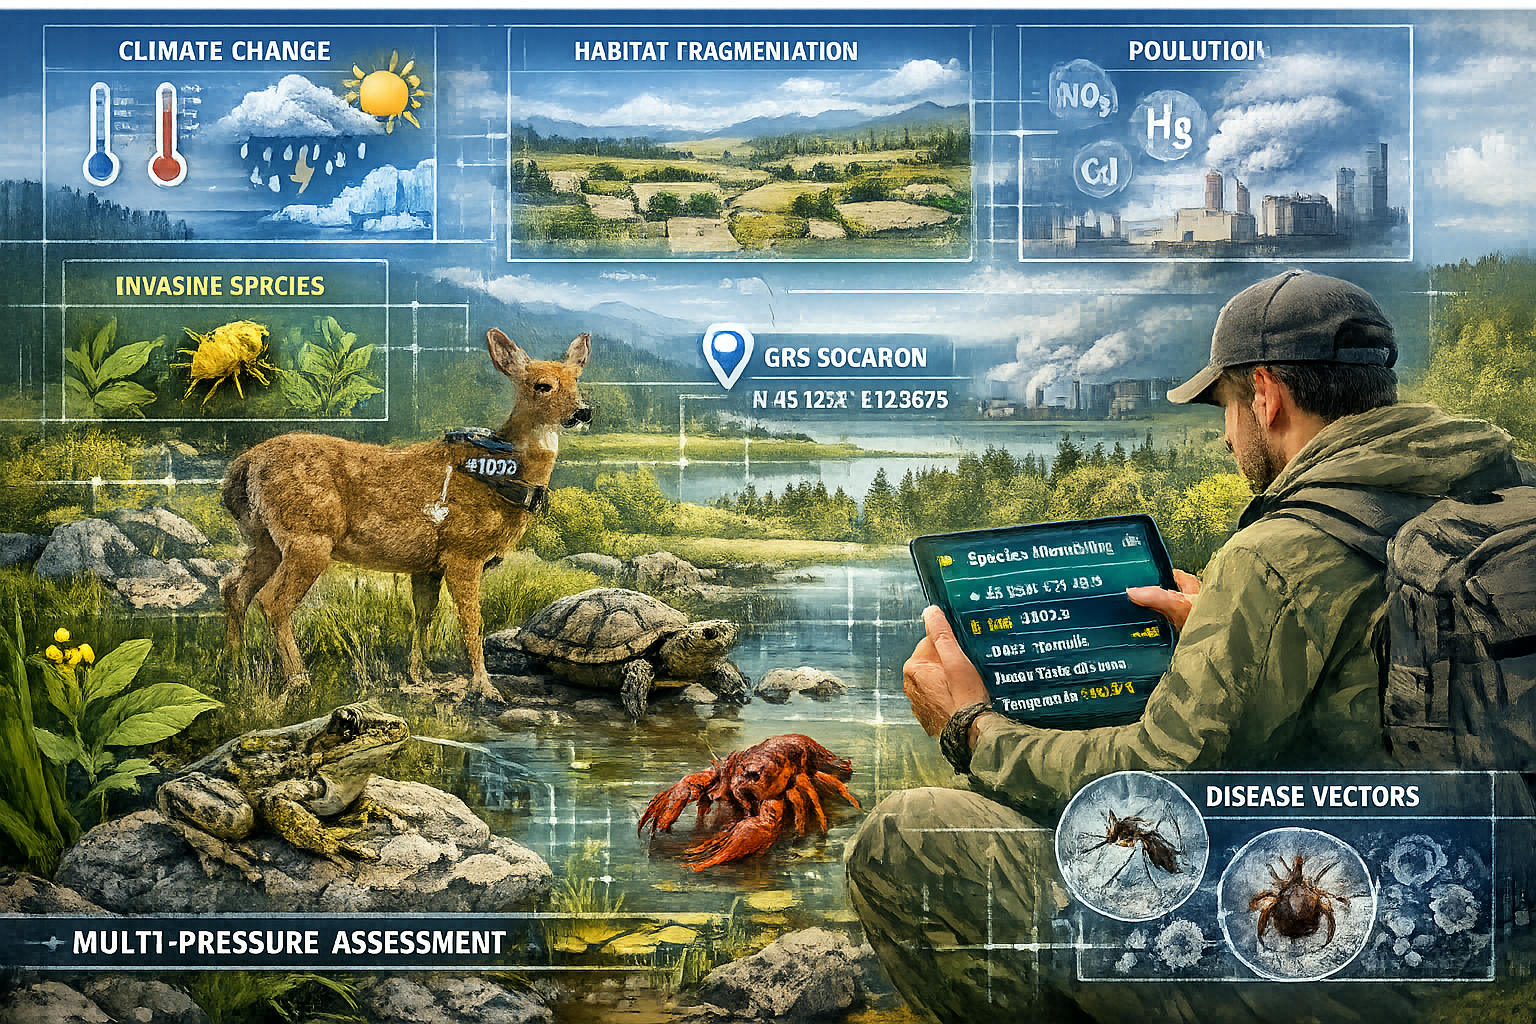
The six primary threat categories affecting wildlife populations include:
- 🌡️ Climate change: Altered temperature regimes, precipitation patterns, and extreme weather events
- 🦠 Disease: Emerging pathogens, parasites, and infectious agents
- 🏭 Pollution: Chemical contaminants, plastics, agricultural runoff, and air quality degradation
- 🐀 Invasive species: Non-native organisms competing for resources or predating on native wildlife
- 🏗️ Habitat loss: Fragmentation, degradation, and conversion of natural landscapes
- 🎣 Exploitation: Over-harvesting, hunting, and unsustainable resource extraction
When these threats interact, their combined impact exceeds the sum of individual effects. For example, a bird population stressed by climate-induced food scarcity becomes more susceptible to disease, while simultaneously losing habitat to agricultural expansion.
Why Traditional Single-Factor Surveys Fall Short
Conventional biodiversity surveys typically focus on one primary threat—usually habitat quality or quantity. While this approach provides valuable baseline data, it fails to capture the synergistic effects driving accelerated population declines observed in 2026.
Consider a freshwater fish population: a single-factor survey might document habitat degradation from agricultural runoff. However, this assessment misses how pollution interacts with migration barriers, invasive predator species, and temperature increases from climate change—all simultaneously affecting the same population.
For developers conducting biodiversity impact assessments, understanding these interactions is critical for accurate baseline evaluations and effective mitigation planning.
The Scale of 2026 Biodiversity Decline
Current data reveals the severity of wildlife population collapse:
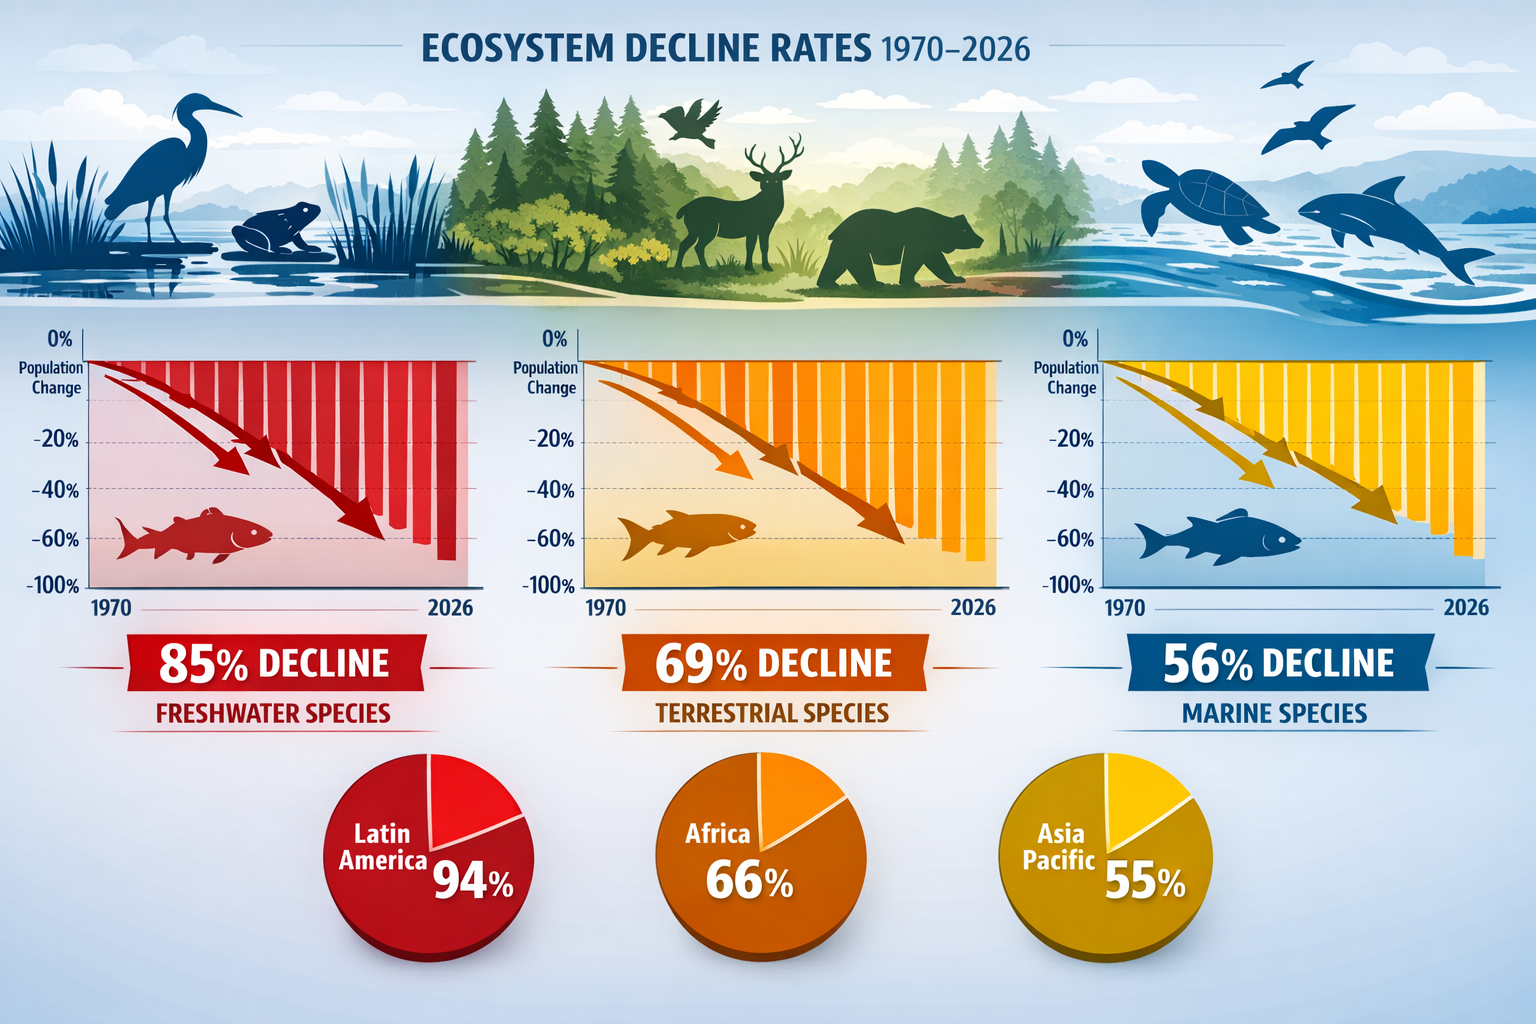
| Ecosystem Type | Population Decline Since 1970 | Primary Interacting Threats |
|---|---|---|
| Freshwater | 85% | Habitat barriers, pollution, invasive species, climate change |
| Terrestrial | 69% | Habitat loss, climate change, exploitation, disease |
| Marine | 56% | Exploitation, pollution, climate change, habitat degradation |
Source: World Wildlife Fund Living Planet Report 2024 [2][3]
These figures represent average declines across 5,495 monitored species, but regional variations are stark. Latin America and the Caribbean have experienced a 94% decline, while Africa shows 66% and Asia Pacific 55% [5].
Vulnerable Vertebrate Groups
Certain taxonomic groups face disproportionate extinction risk from interacting threats:
- Amphibians: 41% of species threatened with extinction, highly sensitive to pollution, disease, and climate interactions [6]
- Mammals: 27% of assessed species threatened, vulnerable to habitat loss combined with exploitation [6]
- Migratory fish: Approximately 50% of threats stem from habitat barriers combined with other pressures [5]
- Small-ranged species: Limited distribution makes these vertebrates critically vulnerable to any habitat loss [4]
Understanding these vulnerability patterns enables surveyors to prioritize monitoring efforts and tailor multi-pressure protocols to species-specific needs.
Multi-Pressure Survey Strategies for 2026
Developing Integrated Assessment Protocols
Effective multi-pressure surveys require systematic protocols that capture threat interactions rather than isolated factors. Here's how to structure comprehensive assessments:
1. Baseline Multi-Threat Inventory
Begin every survey by documenting all potential threat categories present in the study area:
- Conduct habitat quality assessments alongside climate vulnerability mapping
- Sample for pollutants while recording invasive species presence
- Document disease indicators and exploitation evidence simultaneously
- Map barriers to movement and connectivity alongside resource availability
This comprehensive baseline reveals which threats co-occur and where interactions are most likely.
2. Species-Specific Vulnerability Matrices
Create vulnerability matrices for target vertebrate species that score sensitivity to each threat category:
Example Matrix for Freshwater Amphibian Population:
| Threat Category | Sensitivity Score (1-5) | Evidence Type | Interaction Potential |
|---|---|---|---|
| Climate change | 4 | Temperature tolerance data | High with disease |
| Pollution | 5 | Skin absorption pathway | High with disease |
| Habitat loss | 4 | Breeding site requirements | Medium with invasives |
| Disease | 5 | Chytrid fungus presence | High with climate/pollution |
| Invasive species | 3 | Predator documentation | Medium with habitat loss |
This matrix approach helps prioritize monitoring efforts and predict where threat interactions pose greatest risk.
3. Temporal Monitoring Schedules
Different threats operate on different timescales. Design monitoring schedules that capture:
- Seasonal variations: Climate impacts, breeding success, migration patterns
- Annual trends: Population trajectory, habitat quality changes
- Event-driven assessments: Pollution incidents, extreme weather, disease outbreaks
- Long-term tracking: Cumulative effects, generational changes
For projects requiring biodiversity net gain compliance, temporal monitoring provides essential data for demonstrating sustained improvements.
Technology-Enhanced Survey Methods
Modern survey tools enable more efficient multi-pressure assessments:
Remote Sensing Technologies:
- Satellite imagery for habitat change detection
- Thermal imaging for population counts and behavior monitoring
- Drone surveys for inaccessible areas and large-scale mapping
- Acoustic monitoring for vocal species and soundscape analysis
Environmental DNA (eDNA) Sampling:
- Simultaneous detection of multiple species from water or soil samples
- Early detection of invasive species before visual confirmation
- Disease pathogen identification without capturing individuals
- Cost-effective screening for rare or cryptic vertebrates
Automated Recording Systems:
- Camera traps with AI species identification
- Weather stations providing microclimate data
- Water quality sensors for continuous pollution monitoring
- GPS tracking collars for movement and behavior analysis
These technologies allow surveyors to collect multi-pressure data more comprehensively than traditional methods alone.
Ecosystem-Specific Survey Approaches
Given the disparate decline rates across ecosystem types, tailored approaches are essential:
Freshwater Systems (85% Decline)
Freshwater vertebrates face the most severe population collapse, requiring intensive multi-pressure protocols:
- Priority threats: Migration barriers, pollution, invasive species, climate change
- Key survey elements: Water quality testing, connectivity assessments, invasive species inventories, temperature monitoring
- Critical species: Migratory fish, amphibians, freshwater turtles
- Survey frequency: Quarterly minimum, with event-driven assessments after pollution incidents or extreme weather
Approximately half of threats to migratory fish stem from habitat barriers combined with other pressures [5], making connectivity assessment essential.
Terrestrial Systems (69% Decline)
Terrestrial surveys must address agricultural expansion impacts, particularly in biodiversity hotspots where farming has caused 26% species richness decline [4]:
- Priority threats: Habitat fragmentation, climate change, exploitation, disease
- Key survey elements: Habitat patch analysis, corridor identification, climate refuge mapping, disease surveillance
- Critical species: Small-ranged mammals, ground-nesting birds, specialist herbivores
- Survey frequency: Seasonal assessments aligned with breeding cycles and migration periods
Nearly 1,031 million hectares of high-risk biodiversity areas remain unprotected outside reserves [4], making terrestrial surveys crucial for identifying conservation priorities.
Marine Systems (56% Decline)
While showing relatively lower decline rates, marine vertebrates still face severe pressure combinations:
- Priority threats: Exploitation, pollution, climate change, habitat degradation
- Key survey elements: Population abundance estimates, bycatch documentation, ocean temperature monitoring, pollution sampling
- Critical species: Marine mammals, seabirds, sharks and rays, commercial fish stocks
- Survey frequency: Annual population assessments with continuous environmental monitoring
Data Integration and Analysis
Multi-pressure surveys generate complex datasets requiring sophisticated analysis:
Statistical Approaches:
- Multivariate analysis to identify threat correlations
- Generalized additive models for non-linear threat relationships
- Bayesian networks for predicting interaction outcomes
- Time-series analysis for trend detection
Visualization Methods:
- Heat maps showing threat intensity across landscapes
- Network diagrams illustrating threat interactions
- Trajectory plots comparing populations under different pressure combinations
- Risk maps identifying high-vulnerability zones
For developers creating biodiversity plans, these analytical outputs provide evidence-based mitigation strategies.
Biodiversity Net Gain Implications for Vertebrate Monitoring
Integrating Multi-Pressure Assessments into BNG
The UK's Biodiversity Net Gain requirements create both challenges and opportunities for addressing Interacting Threats in Wildlife Populations: Multi-Pressure Survey Strategies for 2026 Biodiversity Decline.
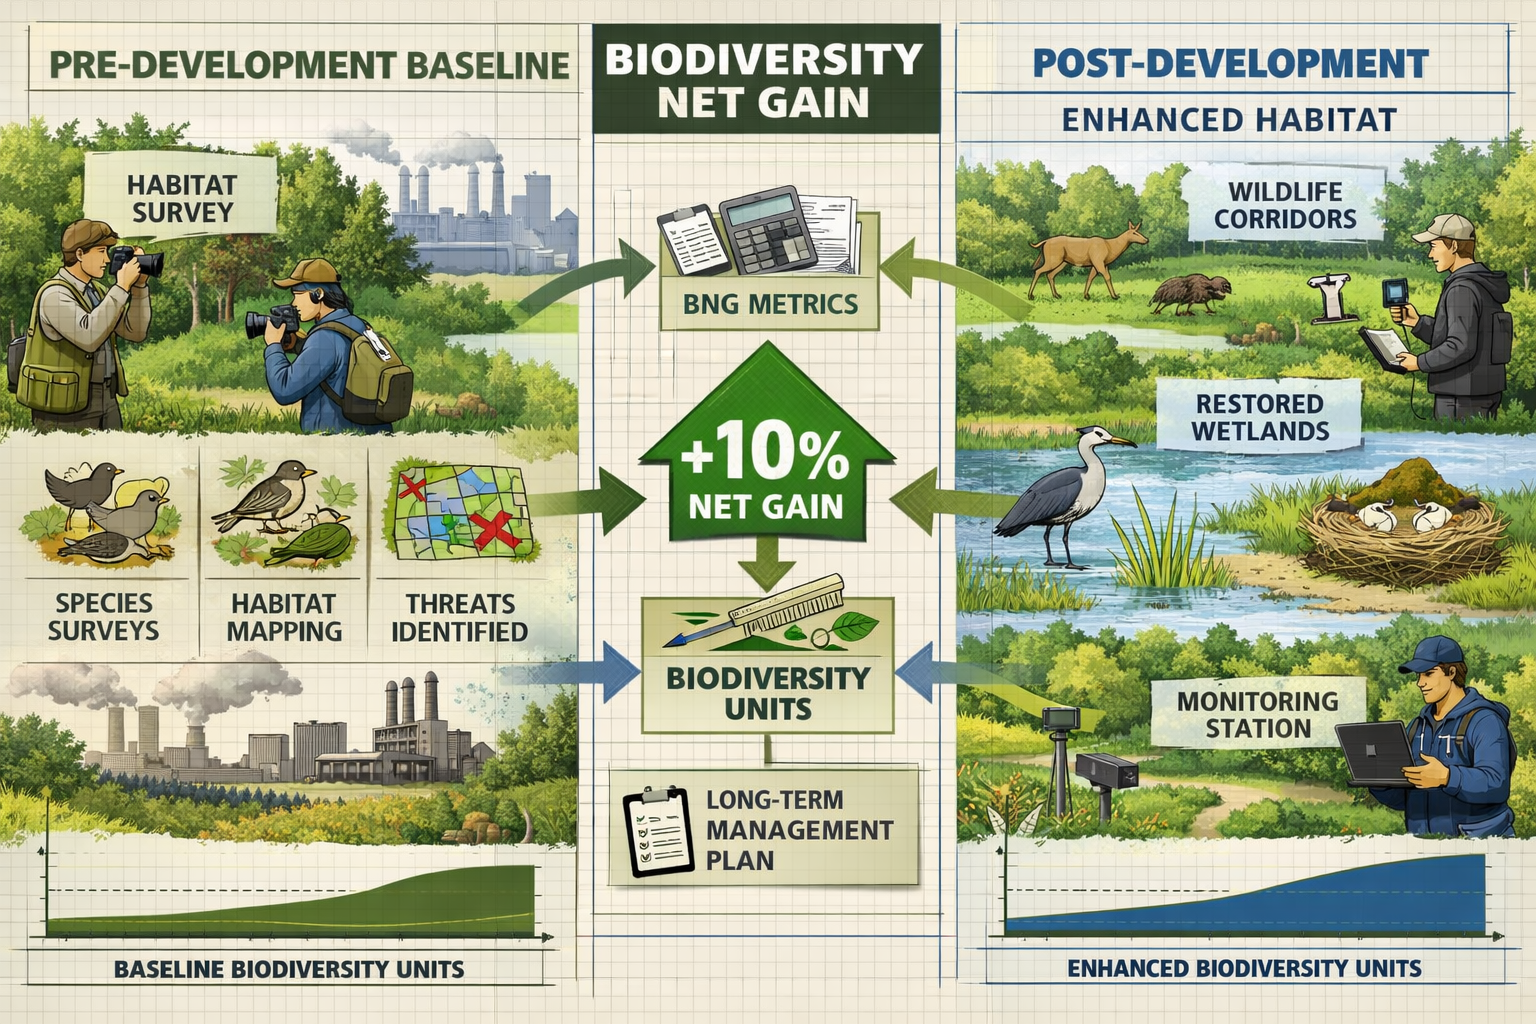
BNG Baseline Requirements:
When conducting baseline assessments for 10% biodiversity net gain, surveyors must:
- Document existing vertebrate populations and their threat exposure
- Assess habitat condition considering multiple pressure impacts
- Identify which threats can be mitigated through development design
- Establish monitoring protocols for post-development verification
Traditional BNG assessments focus heavily on habitat units, but vertebrate population viability depends on addressing interacting threats, not just habitat quantity.
Threat-Informed Mitigation Hierarchies
The BNG mitigation hierarchy—avoid, minimize, restore, offset—becomes more effective when informed by multi-pressure analysis:
Avoid:
- Identify areas where multiple threats already stress populations
- Steer development away from critical refuge habitats
- Preserve connectivity corridors that buffer against climate change
Minimize:
- Design pollution controls that reduce chemical stress on already-compromised populations
- Create buffer zones that separate development from disease-vulnerable species
- Schedule construction to avoid compounding seasonal stressors
Restore:
- Prioritize restoration of habitats where threat reduction is feasible
- Remove invasive species while improving habitat quality
- Restore connectivity to counter fragmentation and climate impacts
Offset:
- Select offset sites where multi-pressure management is possible
- Ensure biodiversity units account for threat reduction benefits
- Implement long-term management addressing multiple pressures
Vertebrate-Focused Enhancement Strategies
Achieving net gain for vertebrate populations requires going beyond habitat creation:
Climate Resilience Features:
- Thermal refugia (shaded streams, cool microclimates)
- Diverse vegetation structure providing multiple microhabitats
- Water features resilient to drought and flooding
- Migration corridors connecting climate refuges
Disease Management:
- Habitat designs reducing disease transmission (dispersed resources, reduced crowding)
- Biosecurity protocols preventing pathogen introduction
- Monitoring programs for early disease detection
- Veterinary intervention capacity for threatened populations
Pollution Controls:
- Sustainable drainage systems filtering runoff
- Buffer strips protecting aquatic habitats
- Organic land management reducing pesticide exposure
- Air quality improvements near sensitive habitats
Invasive Species Prevention:
- Biosecurity measures at site boundaries
- Native species planting resistant to invasion
- Regular monitoring and rapid response protocols
- Physical barriers where appropriate
These enhancements address the compound threats driving vertebrate decline, making net gain outcomes more achievable and sustainable.
Monitoring and Adaptive Management
BNG requirements for 30-year monitoring periods align well with multi-pressure assessment needs:
Adaptive Management Framework:
- Baseline multi-pressure assessment (pre-development)
- Annual vertebrate population monitoring with threat indicator tracking
- Five-year comprehensive re-assessments evaluating threat interactions
- Adaptive interventions when monitoring reveals emerging threat combinations
- Long-term trend analysis demonstrating net gain maintenance
This framework ensures BNG commitments remain effective even as threat landscapes evolve over decades.
For guidance on implementing these approaches, developers can consult resources on achieving biodiversity net gain without risk.
Regional Considerations for Global Projects
For international projects, regional decline patterns inform BNG-equivalent strategies:
Latin America & Caribbean (94% decline):
- Prioritize habitat connectivity restoration
- Address agricultural intensification impacts
- Implement community-based monitoring programs
- Focus on small-ranged endemic species
Africa (66% decline):
- Integrate wildlife corridors with development planning
- Address exploitation through community partnerships
- Manage human-wildlife conflict zones
- Protect freshwater systems intensively
Asia Pacific (55% decline):
- Balance development with habitat preservation
- Address pollution from rapid industrialization
- Protect island endemics from invasive species
- Restore degraded coastal and marine habitats
These regional strategies recognize that threat combinations vary geographically, requiring localized multi-pressure approaches.
Best Practices for Surveyors and Developers
Professional Survey Standards
Biodiversity surveyors implementing multi-pressure protocols should:
✅ Maintain comprehensive training in multiple survey disciplines (habitat assessment, water quality, disease identification, climate monitoring)
✅ Use standardized methods allowing comparison across sites and time periods
✅ Document all observed threats even if outside primary survey scope
✅ Collaborate with specialists for complex threat interactions (veterinary pathologists, climate scientists, pollution experts)
✅ Implement quality assurance through peer review and method validation
✅ Communicate uncertainty clearly when predicting interaction outcomes
✅ Stay current with emerging threats and survey technologies
For surveyors working with developers, understanding how biodiversity surveyors benefit both nature and development helps frame multi-pressure assessments as value-adding services.
Developer Action Steps
Developers committed to addressing wildlife decline through their projects should:
Early Planning Phase:
- Commission multi-pressure baseline assessments before design finalization
- Engage ecologists in site selection to avoid high-threat areas
- Budget for long-term monitoring and adaptive management
- Consider on-site versus off-site delivery for optimal threat reduction
Design Phase:
- Incorporate threat-reduction features into development plans
- Design for climate resilience and connectivity
- Specify pollution controls and biosecurity measures
- Create diverse habitats supporting multiple vertebrate groups
Construction Phase:
- Implement strict environmental management preventing additional stressors
- Monitor for unexpected threat emergence
- Maintain buffer zones protecting adjacent populations
- Document compliance with multi-pressure mitigation commitments
Post-Development:
- Fund comprehensive monitoring programs
- Support adaptive management interventions
- Share data with conservation organizations
- Demonstrate net gain achievement through vertebrate population recovery
Collaborative Approaches
Addressing Interacting Threats in Wildlife Populations: Multi-Pressure Survey Strategies for 2026 Biodiversity Decline requires collaboration across sectors:
Conservation Organizations:
- Provide landscape-scale threat data
- Offer technical expertise on species-specific vulnerabilities
- Support long-term monitoring programs
- Facilitate habitat connectivity beyond project boundaries
Government Agencies:
- Establish multi-pressure assessment standards
- Coordinate regional monitoring networks
- Enforce pollution controls and invasive species regulations
- Provide climate projection data for planning
Research Institutions:
- Investigate threat interaction mechanisms
- Develop predictive models for population responses
- Validate survey methodologies
- Train next-generation conservation professionals
Local Communities:
- Contribute traditional ecological knowledge
- Participate in citizen science monitoring
- Support habitat management activities
- Reduce local threat sources (pollution, exploitation)
These partnerships create the comprehensive approach necessary to reverse vertebrate population declines.
Conclusion
The accelerating decline of wildlife populations in 2026 demands a fundamental shift in how we assess and address biodiversity loss. Interacting Threats in Wildlife Populations: Multi-Pressure Survey Strategies for 2026 Biodiversity Decline represents not just an academic concept, but an urgent operational imperative for conservation professionals, biodiversity surveyors, and developers.
With vertebrate populations having declined 73% since 1970 [2] and freshwater species experiencing catastrophic 85% collapse [3], single-factor assessments no longer provide adequate understanding of the challenges wildlife faces. The evidence is clear: populations exposed to combinations of climate change, disease, pollution, invasive species, habitat loss, and exploitation decline faster than those facing individual threats [1].
Key Actions for 2026 and Beyond
For Biodiversity Surveyors:
- Transition from single-threat to multi-pressure assessment protocols
- Invest in training and technology enabling comprehensive threat detection
- Collaborate across disciplines to understand interaction mechanisms
- Communicate findings clearly to inform development and conservation decisions
For Developers:
- Commission integrated baseline assessments capturing threat interactions
- Design developments that reduce multiple pressures simultaneously
- Commit to long-term monitoring and adaptive management
- View biodiversity net gain as opportunity to address compound threats
For Conservation Planners:
- Prioritize protection of areas where threat reduction is most feasible
- Design connectivity networks buffering against climate change and fragmentation
- Implement landscape-scale threat management programs
- Support research into interaction mechanisms and mitigation effectiveness
Moving Forward
The biodiversity crisis of 2026 is severe, but not irreversible. By understanding how threats interact and implementing survey strategies that capture this complexity, we can design more effective interventions. Every development project, every habitat restoration, and every protected area represents an opportunity to reduce the compound pressures driving wildlife toward extinction.
The approximately one million species facing extinction risk [6] and the 1,031 million hectares of unprotected high-risk areas [4] underscore the scale of work ahead. Yet with multi-pressure survey strategies informing evidence-based conservation, we can begin reversing these trends.
For surveyors and developers ready to implement these approaches, professional guidance and comprehensive planning tools are available through specialized biodiversity assessment services. The time to act is now—wildlife populations cannot wait for perfect solutions, but they can benefit from informed, integrated strategies implemented with urgency and commitment.
References
[1] Wildlife Decline – https://www.bristol.ac.uk/cabot/news/2026/wildlife-decline.html
[2] Catastrophic 73 Decline In The Average Size Of Global Wildlife Populations In Just 50 Years Reveals A System In Peril – https://www.worldwildlife.org/news/press-releases/catastrophic-73-decline-in-the-average-size-of-global-wildlife-populations-in-just-50-years-reveals-a-system-in-peril/
[3] Wildlife Populations Declined Nature Climate Stories – https://www.weforum.org/stories/2024/10/wildlife-populations-declined-nature-climate-stories/
[4] The Worlds Richest Ecosystems Arelosing Over 26oftheir Speciestofarmingfinds Global Study – https://www.downtoearth.org.in/wildlife-biodiversity/the-worlds-richest-ecosystems-arelosing-over-26oftheir-speciestofarmingfinds-global-study
[5] New Report Reveals Devastating 69 Drop In Wildlife Populations – https://www.unep-wcmc.org/new-report-reveals-devastating-69-drop-in-wildlife-populations
[6] Biodiversity Loss Statistics – https://wifitalents.com/biodiversity-loss-statistics/
