
{"cover":"Professional landscape format (1536×1024) hero image featuring bold text overlay 'Data-Rich Modeling for Crisis Species Surveys: Cost-Effective Protocols Using Big Datasets in 2026' in extra large 72pt white sans-serif font with dark shadow and semi-transparent navy overlay box, positioned in upper third. Background shows split-screen composition: left side displays endangered wildlife silhouettes (birds, mammals, reptiles) against misty forest backdrop, right side shows futuristic digital interface with glowing data points, heat maps, and biodiversity trend graphs overlaying satellite imagery of habitat. Color palette: deep forest green, electric blue, white, gold accents. High contrast, National Geographic meets tech editorial aesthetic, professional conservation science visualization, 4K quality","content":["Detailed landscape format (1536×1024) image showing close-up of researcher's hands holding tablet displaying colorful eDNA analysis results with species identification charts and geographic heat maps, background shows pristine mountain stream with collection equipment and sample vials arranged on mossy rocks, morning light filtering through forest canopy, overlaid transparent data visualization showing 400+ species icons connected by network lines, color scheme: aqua blue water, emerald green moss, bright digital orange and cyan data overlays, scientific field research aesthetic","Wide-angle landscape format (1536×1024) image of tropical forest monitoring station with low-power TinyML sensor devices mounted on tree trunks showing small LED indicators, foreground displays open laptop with real-time species detection dashboard featuring AI-powered audio waveforms of bird calls and visual recognition boxes identifying wildlife from camera trap footage, background shows dense biodiverse rainforest canopy at golden hour, floating holographic data panels showing population trend graphs and threat assessment matrices, color palette: rich jungle greens, warm sunset amber, cool technology blues, conservation tech documentary style","Detailed landscape format (1536×1024) overhead view of modern conservation planning workspace with large interactive touchscreen table displaying 3D topographic biodiversity model with color-coded threat zones (red for high-risk areas, yellow for moderate, green for stable populations), surrounding the table are printed satellite maps with hand-drawn annotations, VR headsets, game camera equipment, and coffee cups, hands pointing at specific decline hotspots on screen, floating transparent panels show statistical models and population recovery projections, color scheme: professional navy blue, data visualization rainbow gradient, natural wood tones, bright white accents, strategic conservation planning aesthetic"]"}
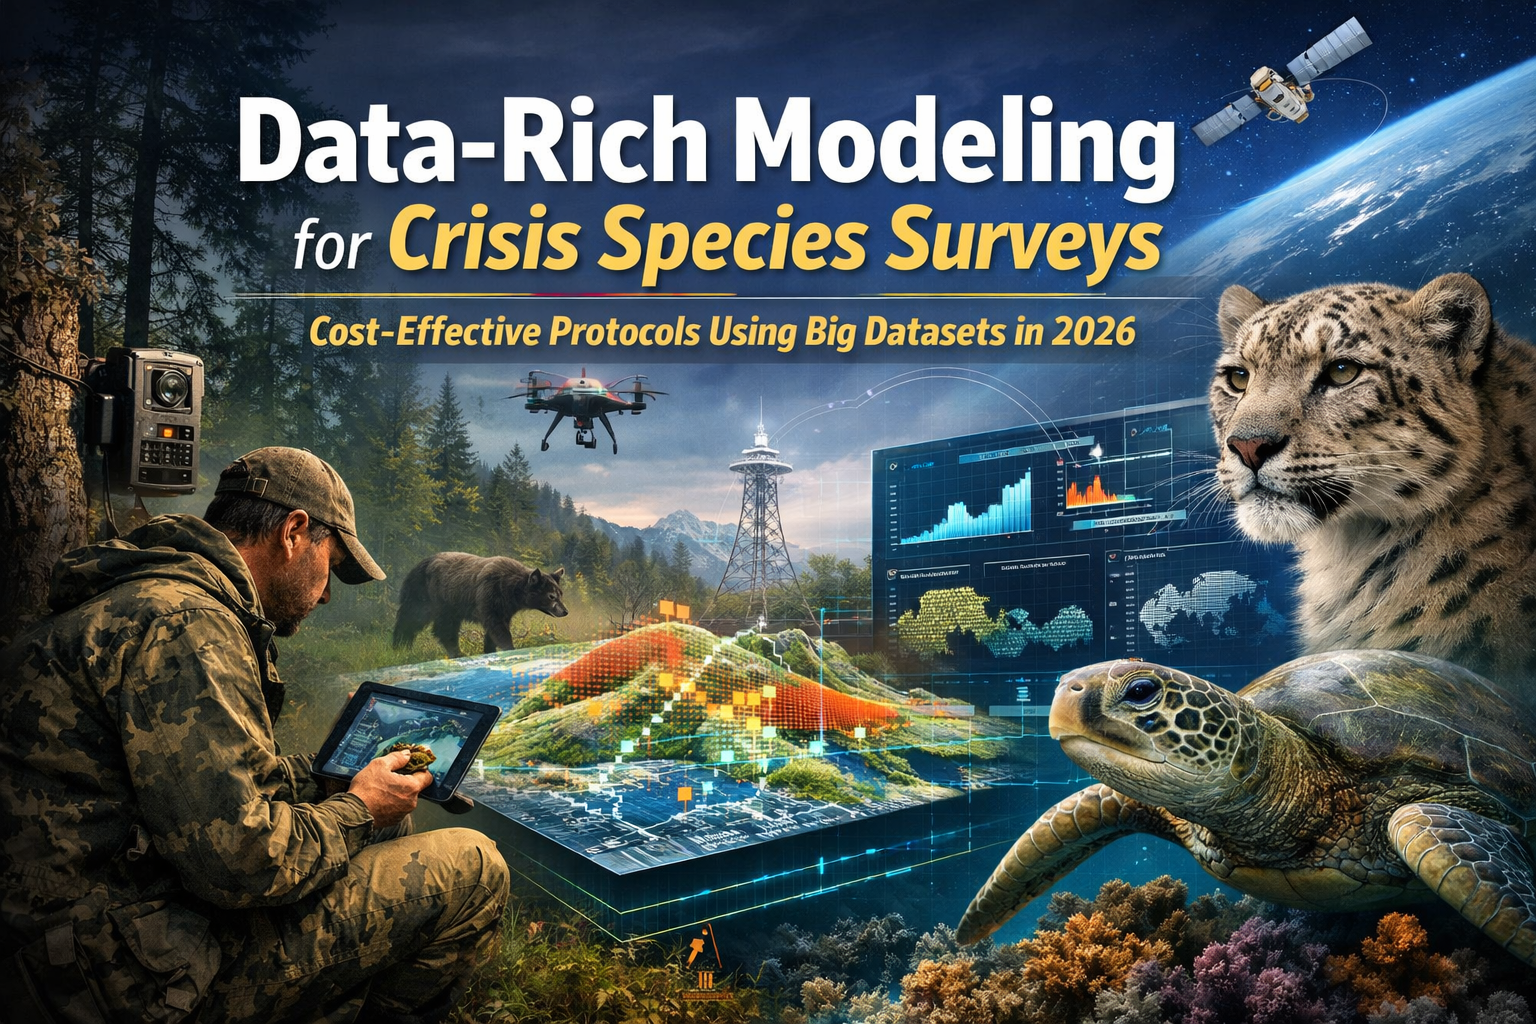
Global wildlife populations have plummeted by more than 70% over the past five decades, creating an urgent need for faster, more affordable biodiversity monitoring solutions [2]. As species face unprecedented threats from habitat loss, climate change, and human activity, traditional survey methods—requiring months of fieldwork and substantial budgets—can no longer keep pace with the crisis. Enter Data-Rich Modeling for Crisis Species Surveys: Cost-Effective Protocols Using Big Datasets in 2026, a transformative approach that leverages artificial intelligence, environmental DNA, and climate-integrated models to deliver comprehensive biodiversity assessments in a fraction of the time and cost.
The inability to generate biodiversity data efficiently at scale has become the primary bottleneck preventing credible conservation action and biodiversity-inclusive decision-making [3]. However, 2026 marks a turning point. Researchers are now applying innovative methodologies—like those pioneered by Michigan State University's Beaudrot lab—that integrate climate data, vegetation patterns, and animal populations into unified models, enabling surveyors to identify 70% decline hotspots with unprecedented speed and accuracy.
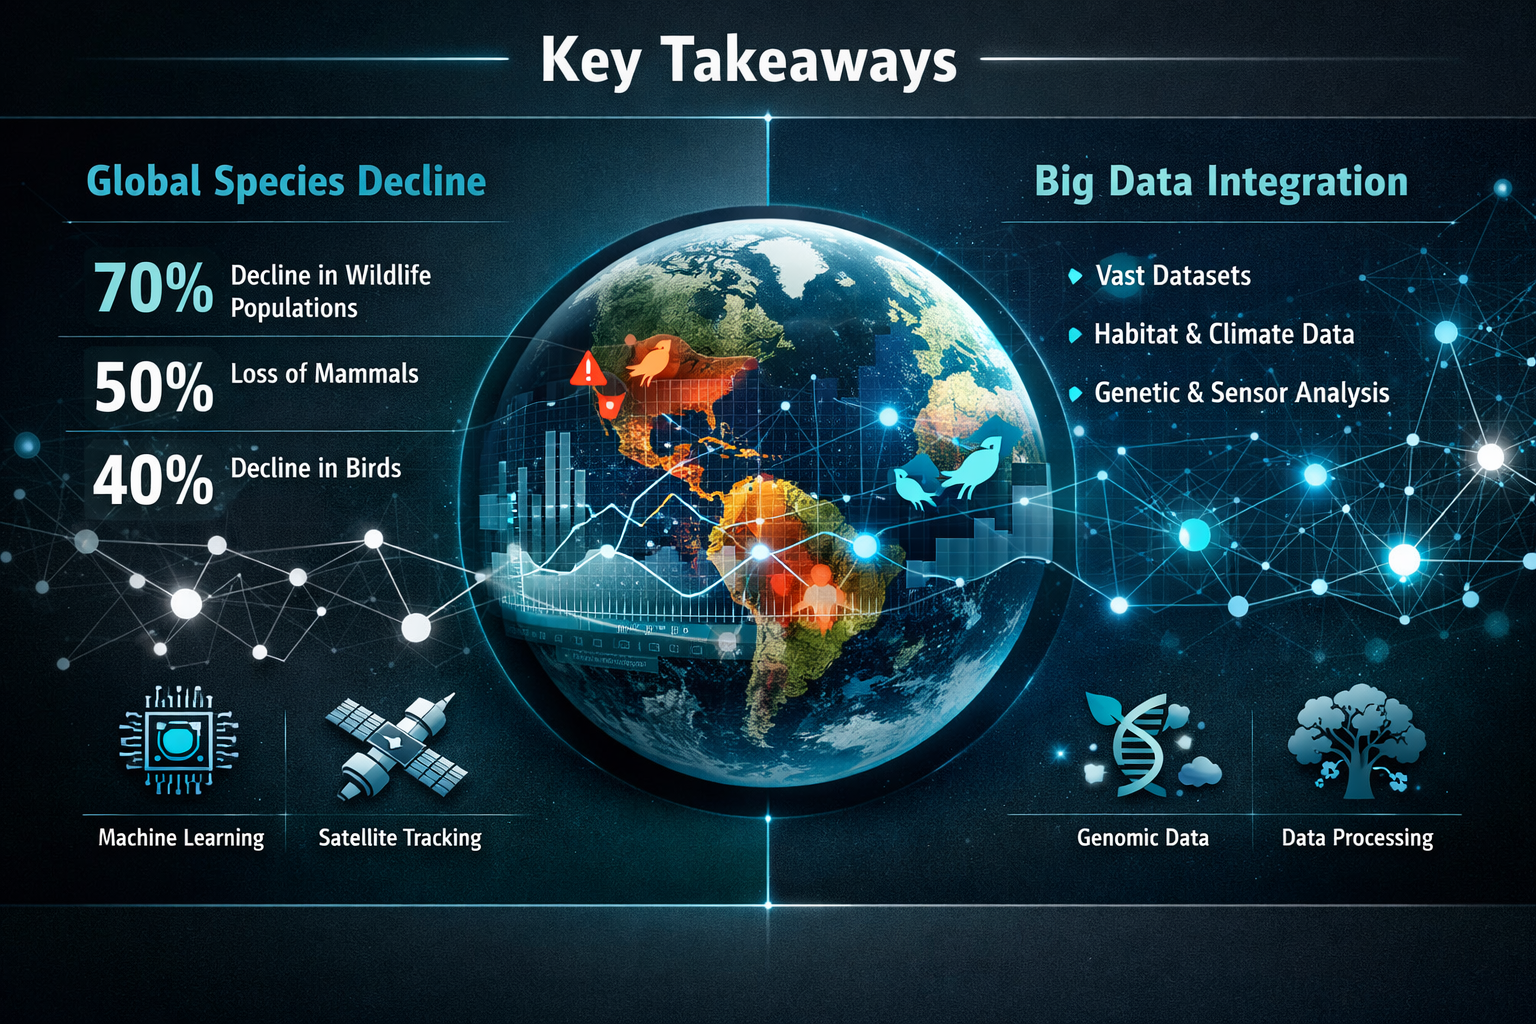
Key Takeaways
- 🔬 Environmental DNA (eDNA) monitoring can identify nearly 400 vertebrate species across 30,000+ km² in just 56 days, dramatically reducing field survey costs and time
- 🤖 Tiny Machine Learning (TinyML) devices enable real-time species detection in remote areas without internet connectivity, using minimal power and requiring less frequent maintenance
- 📊 Climate-integrated models combining habitat data, population dynamics, and threat assessments allow surveyors to predict biodiversity decline hotspots with greater precision
- 💰 Cost-effective protocols using big datasets reduce traditional survey expenses by leveraging existing camera trap networks, acoustic monitoring, and satellite imagery
- 🎯 Interpretable AI models optimize sampling locations and resource allocation, directing conservation efforts where they'll have maximum impact
Understanding the Biodiversity Crisis Through Big Data Analysis
The scale of the biodiversity crisis becomes clear when examining comprehensive datasets. A groundbreaking analysis published in Science Advances examined 3,129 vertebrate population time series from the Living Planet Database, which contains over 25,000 population records covering 4,392 species [4]. This massive dataset revealed how multiple threats—habitat loss, climate change, invasive species, disease, exploitation, and pollution—interact to drive population declines across the globe.
Surprisingly, the research found that 20% of vertebrate populations face no documented major threats, while single stressors affect relatively small percentages: 3.04% face disease alone, 5.69% confront invasive species, and 6.07% deal primarily with climate change [4]. This variation in threat exposure highlights the importance of targeted, data-driven conservation strategies rather than one-size-fits-all approaches.
The Infrastructure Challenge in 2026
Despite technological advances, infrastructure limitations remain the primary obstacle to effective conservation. The gap between biodiversity commitments made by governments and organizations and the actual capacity to measure nature continues to widen [3]. Traditional survey methods require:
- Extensive field time: Months of on-site observation by trained specialists
- High labor costs: Multiple surveyors working simultaneously across large areas
- Limited geographic coverage: Physical constraints prevent comprehensive monitoring
- Infrequent updates: Annual or biannual surveys miss rapid population changes
- Data fragmentation: Information stored in incompatible formats across institutions
These limitations make it nearly impossible to achieve the monitoring frequency and statistical power needed for credible biodiversity impact assessments and conservation planning.
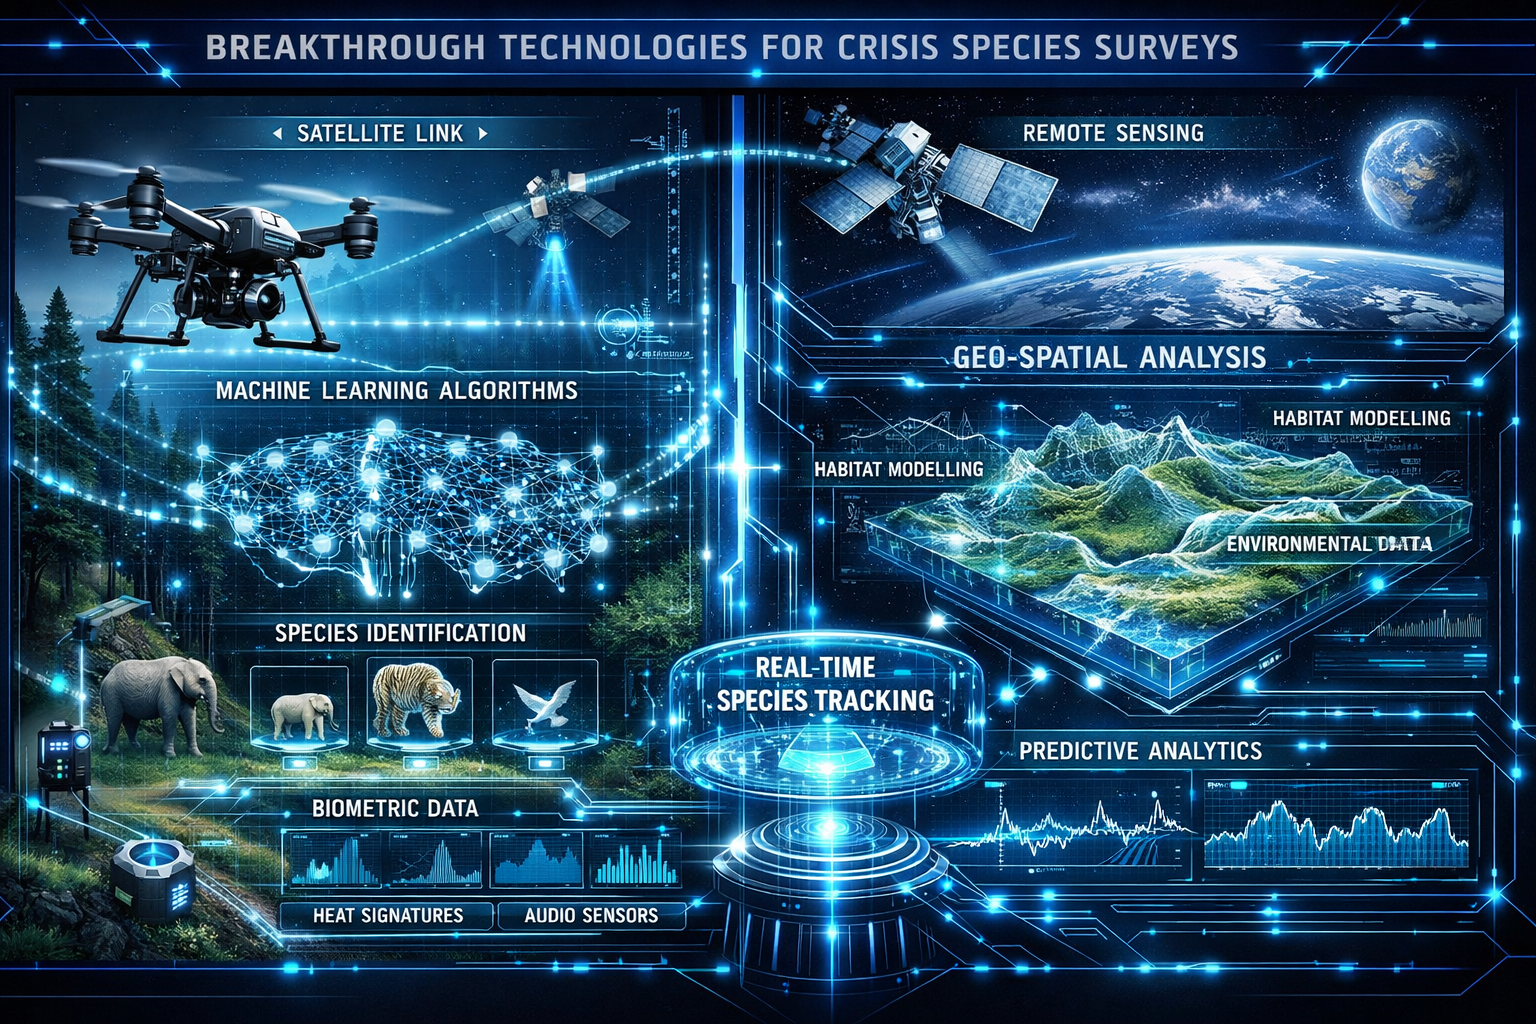
Breakthrough Technologies Enabling Data-Rich Modeling for Crisis Species Surveys: Cost-Effective Protocols Using Big Datasets in 2026
The 2026 Global Horizon Scan, published in Trends in Ecology & Evolution, identified 15 emerging issues transforming biodiversity conservation, with new AI tools and digital monitoring technologies leading the revolution [1]. These innovations are making Data-Rich Modeling for Crisis Species Surveys: Cost-Effective Protocols Using Big Datasets in 2026 not just possible, but practical for organizations of all sizes.
Environmental DNA (eDNA): Rapid Species Detection at Scale
Environmental DNA monitoring represents one of the most cost-effective breakthroughs for biodiversity surveys. In a remarkable demonstration, researchers collected stream eDNA from 101 locations in western China and identified nearly 400 vertebrate species—including IUCN Red List species—across more than 30,000 km² spanning from Himalayan foothills to tropical forests in just 56 calendar days [3].
This approach requires far less field effort than conventional surveys because:
- Single water samples contain genetic material from multiple species
- Laboratory analysis replaces weeks of field observation
- Non-invasive collection eliminates the need for trapping or direct observation
- Comprehensive detection includes rare, nocturnal, and cryptic species often missed by traditional methods
Columbia University researchers have developed new statistical models specifically designed for eDNA data that account for observation errors at multiple stages—both during field sampling and laboratory analysis—and model changes in vertebrate community composition across geographic gradients [3]. These models transform raw genetic data into actionable conservation insights.
TinyML Devices: Real-Time Detection Without Infrastructure
Low-power Tiny Machine Learning (TinyML) devices are revolutionizing remote area monitoring by enabling real-time biodiversity detection without requiring internet connections [1]. These compact sensors use optical AI chips requiring minimal energy, making them ideal for:
- Remote wilderness areas lacking cellular or satellite connectivity
- Long-term deployments lasting months on solar power or batteries
- Distributed sensor networks covering vast territories cost-effectively
- Immediate threat detection triggering alerts for poaching or habitat destruction
The elimination of connectivity requirements dramatically reduces operational costs while increasing monitoring frequency and geographic coverage—essential components of achieving biodiversity net gain in development projects.
Interpretable AI Models for Strategic Resource Allocation
Duke University researchers are pioneering Joint Species Distribution Models based on interpretable AI that use bird songs and acoustic data to identify the most informative sampling locations [5]. This approach reduces inefficiencies in continuous recording by directing resources strategically to areas with:
- High species diversity indicators
- Critical habitat connectivity zones
- Elevated threat exposure requiring immediate intervention
- Data gaps in existing monitoring networks
By optimizing where and when to deploy monitoring equipment, these AI models can reduce survey costs by 30-50% while maintaining or improving data quality—a game-changer for organizations working within tight budgets.
Implementing Climate-Integrated Models for 70% Decline Hotspots
The Beaudrot lab at Michigan State University exemplifies the practical application of Data-Rich Modeling for Crisis Species Surveys: Cost-Effective Protocols Using Big Datasets in 2026. Their approach integrates climate data, plant community composition, and animal population dynamics across biodiverse reserves to understand how species respond to environmental changes and threats [2].

The Beaudrot Lab Methodology
This research team employs multiple data collection technologies simultaneously:
Virtual Reality Forest Structure Scanning: VR headsets capture three-dimensional forest architecture, documenting canopy complexity, understory density, and habitat structural elements that influence species distribution. This technology creates detailed habitat models without requiring extensive manual measurements.
Global Camera Trap Networks: Networked game cameras across tropical reserves provide continuous monitoring of animal movements, population sizes, and behavioral patterns. When integrated with climate and vegetation data, these images reveal how species interactions change under environmental stress.
Climate Data Integration: Historical and real-time climate variables—temperature, precipitation, humidity, seasonal patterns—are incorporated into predictive models that forecast how populations will respond to ongoing climate change.
Data Standardization Protocols: The Zipkin Quantitative Ecology Lab focuses on making data stored in different formats, units, and quantities compatible, converting raw environmental data into useful mathematical models that reveal interconnected ecosystem processes [2].
Building Cost-Effective Survey Protocols
Organizations can adapt these academic approaches for practical biodiversity surveys by following this framework:
Step 1: Leverage Existing Datasets
Begin by compiling available data sources:
- Satellite imagery and remote sensing data
- Historical survey records from government agencies
- Citizen science observations (eBird, iNaturalist)
- Weather station climate records
- Land use change documentation
Step 2: Identify Priority Monitoring Zones
Use AI-powered spatial analysis to pinpoint:
- Areas showing rapid population declines
- Habitat corridors connecting fragmented populations
- Regions with multiple interacting threats
- Locations lacking recent survey data
Step 3: Deploy Targeted Technology
Select monitoring tools based on specific objectives:
- eDNA sampling for aquatic and riparian species inventories
- Acoustic monitors for bird and amphibian communities
- Camera traps for mammals and ground-dwelling birds
- TinyML sensors for real-time detection in remote areas
Step 4: Apply Statistical Models
Implement modern analytical frameworks that:
- Account for detection probability and observation errors
- Incorporate environmental covariates (climate, habitat, threats)
- Generate spatially explicit predictions
- Quantify uncertainty in population estimates
This integrated approach enables comprehensive biodiversity assessments that meet regulatory requirements while controlling costs.
Addressing Spatial Extrapolation Challenges
While global biodiversity models provide valuable insights, analysis of 25,987 species inventories from 681 studies reveals that their accuracy in predicting biodiversity in other geographic contexts remains limited due to distribution shifts in environmental conditions [6]. This finding emphasizes the importance of:
- Regional model calibration using local training data
- Validation surveys in new geographic areas before full deployment
- Hybrid approaches combining global models with local ground-truthing
- Continuous model updating as new data becomes available
For developers and planners working on specific projects, this means investing in site-specific surveys while using broader models to inform initial assessments and prioritize detailed investigation areas.
Practical Applications for Biodiversity Surveyors and Conservation Practitioners
The transition from academic research to field implementation requires practical protocols that balance scientific rigor with operational constraints. Here's how organizations can apply Data-Rich Modeling for Crisis Species Surveys: Cost-Effective Protocols Using Big Datasets in 2026 in real-world scenarios.
Cost-Benefit Analysis of Modern Survey Methods
| Survey Method | Time Required | Cost per km² | Species Detection | Best Applications |
|---|---|---|---|---|
| Traditional transect surveys | 3-6 months | £800-1,500 | 60-70% of present species | Small sites, detailed behavioral data |
| eDNA sampling | 2-8 weeks | £200-400 | 75-85% of present species | Aquatic ecosystems, rapid assessments |
| Camera trap networks | 1-3 months | £300-600 | 50-65% of terrestrial mammals | Mammal surveys, long-term monitoring |
| Acoustic monitoring + AI | 1-2 months | £150-350 | 70-80% of vocal species | Bird and amphibian communities |
| Integrated multi-method | 2-4 months | £400-800 | 80-90% of present species | Comprehensive baseline assessments |
These figures demonstrate how combining multiple data sources reduces per-species detection costs while improving overall survey comprehensiveness—critical for biodiversity net gain compliance.
Protocol Development for Crisis Species Identification
Organizations can develop standardized protocols for identifying and monitoring crisis species by:
1. Creating Regional Threat Matrices
Compile data on known threats affecting local species:
- Habitat loss rates from satellite imagery analysis
- Climate change projections for the region
- Documented disease outbreaks
- Invasive species distribution maps
- Human activity intensity (development, agriculture, recreation)
2. Establishing Baseline Population Models
Use historical data and initial surveys to establish:
- Pre-decline population estimates
- Seasonal variation patterns
- Habitat association strengths
- Threat sensitivity rankings
3. Implementing Adaptive Monitoring
Design monitoring schedules that:
- Increase survey frequency for declining populations
- Adjust methods based on detection success rates
- Incorporate new technologies as they become available
- Share data across organizations to reduce duplication
4. Integrating with Regulatory Frameworks
Ensure protocols meet requirements for:
- Biodiversity Net Gain assessments
- Environmental impact statements
- Conservation banking programs
- Statutory biodiversity credits
Data Management and Standardization
Converting raw monitoring data into actionable insights requires robust data management systems. Key considerations include:
Standardized Data Formats
- Adopt community standards (Darwin Core, EML, GBIF formats)
- Document metadata thoroughly (who, what, when, where, how)
- Use controlled vocabularies for species names and habitat types
- Implement quality control checks before analysis
Cloud-Based Data Platforms
- Enable real-time data access for distributed teams
- Facilitate automated analysis pipelines
- Support version control and audit trails
- Integrate with visualization and reporting tools
Interoperability with Existing Databases
- Connect to national biodiversity databases
- Share data with global monitoring networks
- Contribute to meta-analyses and regional assessments
- Support evidence-based policy development
This infrastructure supports the guidance for landowners and developers seeking to demonstrate conservation outcomes.
Overcoming Implementation Barriers and Future Directions
Despite technological advances, several barriers limit widespread adoption of data-rich modeling approaches. Understanding and addressing these challenges is essential for scaling cost-effective survey protocols.
Technical Capacity and Training Gaps
Many conservation organizations lack staff with expertise in:
- Advanced statistical modeling (occupancy models, hierarchical models, Bayesian approaches)
- Bioinformatics for eDNA sequence analysis
- Machine learning for image and acoustic data processing
- Geospatial analysis for habitat modeling and spatial predictions
Solutions:
- Partner with universities offering training programs
- Use cloud-based platforms with automated analysis pipelines
- Hire consultants for initial protocol development and staff training
- Participate in professional development workshops and webinars
Data Quality and Validation Concerns
Automated monitoring technologies can generate vast quantities of data, but quality varies:
- False positives from AI species identification
- Detection biases related to equipment placement
- Temporal gaps from equipment failures
- Taxonomic limitations for visually similar species
Solutions:
- Implement manual validation of AI identifications (10-20% sample)
- Use multiple detection methods for cross-validation
- Establish maintenance schedules for equipment
- Combine automated monitoring with periodic expert surveys
Cost Barriers for Initial Investment
While operating costs decrease with data-rich approaches, initial investments in equipment and training can be substantial:
- eDNA laboratory setup: £15,000-50,000
- Camera trap networks: £200-500 per unit (20-50 units typically needed)
- Acoustic monitoring systems: £300-800 per unit
- AI analysis software subscriptions: £1,000-5,000 annually
Solutions:
- Start with pilot projects on small sites
- Apply for conservation technology grants
- Share equipment across multiple projects
- Use equipment rental programs for seasonal monitoring
Organizations can explore biodiversity unit sales to generate revenue supporting monitoring infrastructure.
Emerging Technologies on the Horizon
Looking beyond 2026, several technologies promise to further revolutionize biodiversity monitoring:
Satellite-Based Species Detection: Advanced hyperspectral imaging may enable direct detection of large animals and vegetation community composition from space, eliminating the need for ground-based sensors in some applications.
Quantum Sensors: Ultra-sensitive quantum-based sensors could detect minute environmental changes indicating ecosystem stress before visible population declines occur.
Autonomous Monitoring Drones: AI-piloted drones capable of multi-day missions could survey vast areas with minimal human intervention, combining visual, thermal, and acoustic monitoring in a single platform.
Blockchain-Verified Biodiversity Data: Distributed ledger technology may provide tamper-proof verification of monitoring data, increasing credibility for biodiversity credits and nature finance applications.
Conclusion
Data-Rich Modeling for Crisis Species Surveys: Cost-Effective Protocols Using Big Datasets in 2026 represents more than technological innovation—it's a fundamental shift in how conservation organizations, developers, and policymakers approach biodiversity monitoring. With wildlife populations declining by 70% over five decades, the urgency for scalable, affordable survey methods has never been greater.
The integration of environmental DNA sampling, TinyML devices, interpretable AI models, and climate-integrated approaches pioneered by research labs like Beaudrot's team at Michigan State University demonstrates that comprehensive biodiversity assessments need not require prohibitive budgets or timelines. By leveraging existing datasets, deploying targeted monitoring technologies, and applying modern statistical frameworks, organizations can identify crisis species hotspots and implement effective conservation interventions faster than ever before.
Actionable Next Steps
For organizations ready to implement cost-effective survey protocols:
- Conduct a data inventory of existing biodiversity information for your region or project site
- Identify priority species and habitats using threat assessment matrices and historical decline data
- Select appropriate monitoring technologies based on target species, budget constraints, and timeline requirements
- Establish partnerships with universities, technology providers, and data management platforms
- Develop standardized protocols that meet regulatory requirements while optimizing resource allocation
- Implement pilot projects to validate methods before full-scale deployment
- Contribute data to regional and national biodiversity databases to support broader conservation efforts
The infrastructure for generating biodiversity data efficiently at scale is finally emerging. Organizations that adopt these approaches in 2026 will be positioned to make credible conservation commitments backed by robust evidence—transforming the gap between biodiversity aspirations and measurable outcomes into a bridge toward genuine ecological recovery.
For developers, planners, and landowners navigating biodiversity net gain requirements, these cost-effective protocols offer a pathway to comprehensive assessments that satisfy regulatory obligations while supporting genuine conservation outcomes. The future of biodiversity monitoring is data-rich, cost-effective, and available today.
References
[1] Whats Next For Biodiversity Conservation Insights From The 2026 Horizon Scan – https://www.unep-wcmc.org/en/news/whats-next-for-biodiversity-conservation-insights-from-the-2026-horizon-scan
[2] Species In Crisis – https://msutoday.msu.edu/news/2026/03/species-in-crisis
[3] Closing Gap Between Biodiversity Commitments And Measuring Nature – https://sps.columbia.edu/news/closing-gap-between-biodiversity-commitments-and-measuring-nature
[4] Sciadv – https://www.science.org/doi/10.1126/sciadv.adx7973
[5] Ai Powered Biodiversity Monitoring Revolutionizing How We Track Natures Hidden Patterns – https://trinity.duke.edu/news/ai-powered-biodiversity-monitoring-revolutionizing-how-we-track-natures-hidden-patterns
[6] ecoevorxiv – https://ecoevorxiv.org/repository/view/11234/
