
The skies above North America are growing quieter. Recent research published in Science reveals that bird populations are not just declining—they're declining faster. This acceleration affects 63 species across specific geographic hotspots, demanding urgent action from ecologists, conservation professionals, and biodiversity surveyors. Bending North American Bird Decline Hotspots: Accelerated Survey Strategies for Ecologists in 2026 requires adaptive monitoring protocols, targeted interventions, and innovative approaches to reverse these troubling trends.
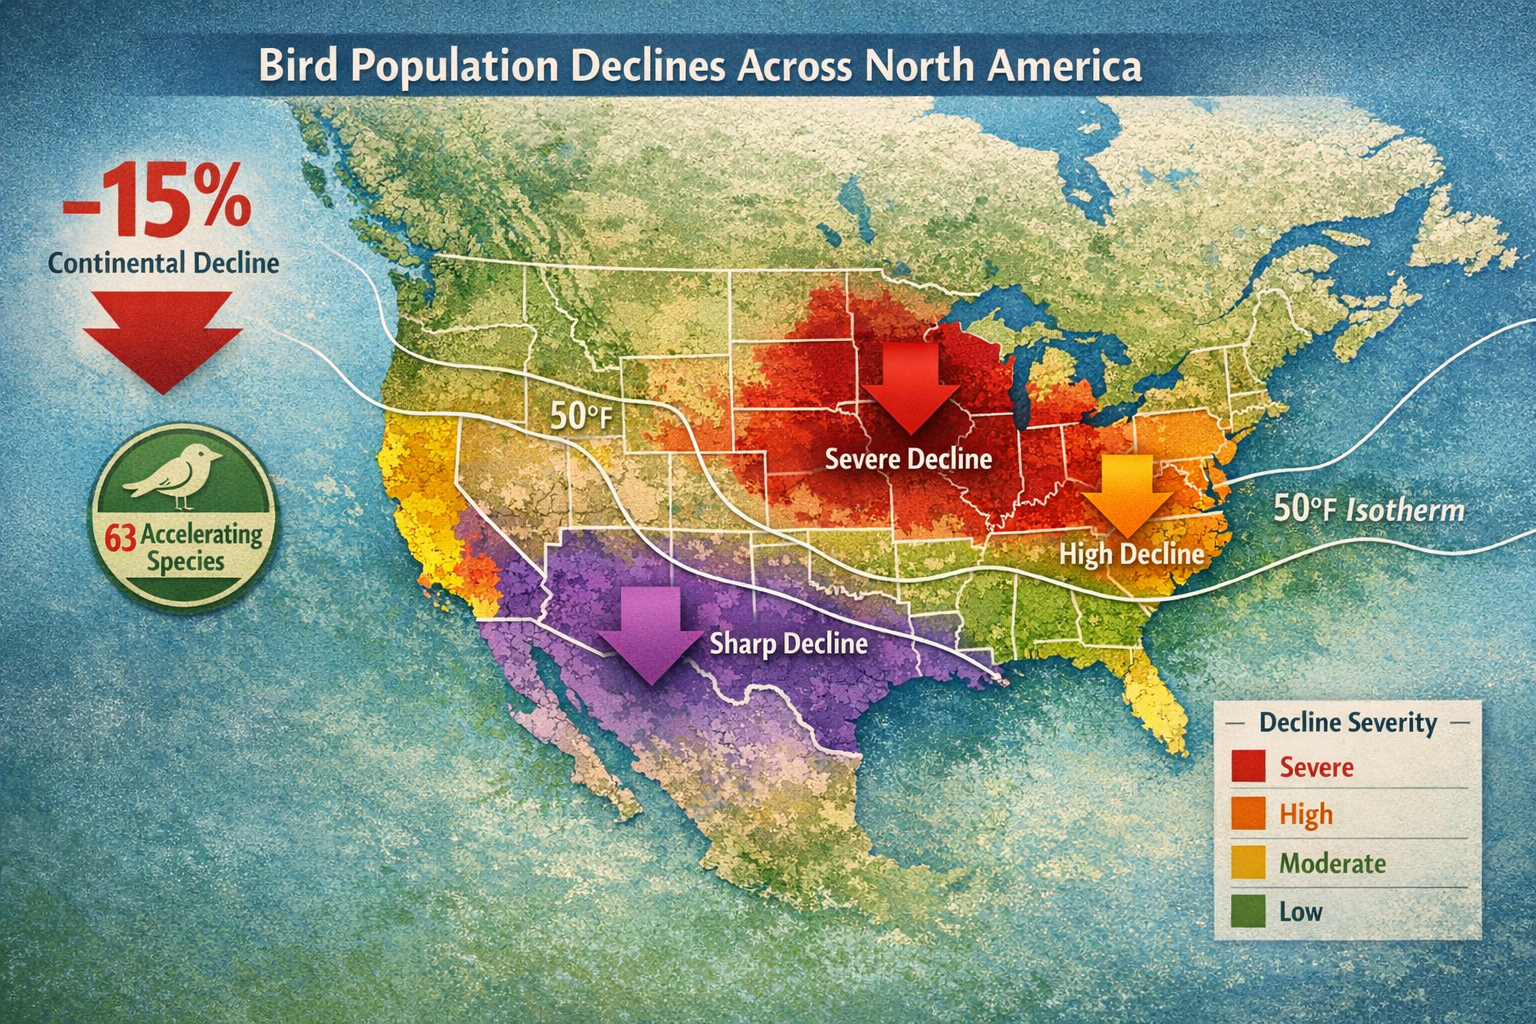
Between 1987 and 2021, the average number of birds recorded per survey route dropped from approximately 2,034 individuals to just 1,730—a 15% continental decline. More alarming than the overall loss is the acceleration pattern: the rate of decline itself is speeding up in critical regions, particularly over the last decade. This means ecologists face a moving target that demands faster, smarter survey methodologies and immediate conservation responses.
Key Takeaways
- 63 bird species (roughly one-quarter of those studied) show significant acceleration of population decline, concentrated in Midwest, Mid-Atlantic, and California hotspots 🔴
- Agricultural intensification—particularly pesticide use, heavy fertilizer application, and large cropland areas—drives acceleration more than any other factor
- Adaptive survey protocols using N-mixture models and Bayesian frameworks can detect acceleration patterns that traditional monitoring misses
- Habitat-specific vulnerability varies dramatically: forest species show positive trends while wetland and open woodland species face accelerating losses
- Integrated conservation strategies combining biodiversity net gain approaches with agricultural reform offer the most promising path forward
Understanding the Geographic Hotspots of Accelerated Bird Decline
Where Acceleration Hits Hardest
The geography of bird decline acceleration reveals distinct patterns across North America. Three primary hotspot regions demand immediate ecological attention in 2026:
Midwest Acceleration Zone 🌾
- States affected: Indiana, Ohio, Kentucky, Illinois, Wisconsin, Michigan
- Primary driver: Agricultural intensification with high pesticide and fertilizer use
- Species impact: Grassland and agricultural edge species most affected
- Temperature correlation: Intermediate mean temperatures around 50°F where human activity peaks
Mid-Atlantic Acceleration Zone 🏙️
- States affected: Delaware, Maryland, New Jersey
- Primary driver: Combined agricultural pressure and urban development
- Species impact: Migratory songbirds and wetland-dependent species
- Unique challenge: Dense human population overlapping critical bird habitat
California Acceleration Zone 🌄
- Regions affected: Central Valley and coastal agricultural areas
- Primary driver: Intensive agricultural practices in critical migration corridors
- Species impact: Insectivorous species facing dual pressure from pesticides and climate warming
- Additional factor: Water scarcity compounding habitat stress
Severity vs. Acceleration: Understanding the Difference
While acceleration hotspots identify where decline rates are increasing, the sharpest overall population losses occur in different regions:
- Florida, Texas, Louisiana, and Arizona show the steepest total declines
- These southern states face different pressure patterns than acceleration zones
- Climate warming impacts baseline populations more severely in these regions
- Understanding both metrics helps ecologists prioritize survey strategies
The distinction matters for survey design. Acceleration hotspots require frequent, repeated monitoring to track changing rates, while severe decline areas need intensive population assessments to prevent local extinctions.
The Agricultural Intensity Connection
Research confirms that agricultural intensification drives acceleration more powerfully than any other variable. Three specific factors correlate most strongly:
- Heavy pesticide use (particularly neonicotinoids affecting insect populations)
- Intensive fertilizer application (altering habitat structure and food webs)
- Large continuous cropland areas (eliminating edge habitat and corridors)
These factors create what researchers call "the war on insects"—a cascade effect where insect populations crash by over 40%, directly starving insectivorous bird species that comprise a significant portion of declining populations.
Accelerated Survey Strategies for Detecting Population Changes in 2026

Traditional bird survey methods, while valuable, often miss acceleration patterns because they focus on overall population trends rather than changes in the rate of change. Bending North American Bird Decline Hotspots: Accelerated Survey Strategies for Ecologists in 2026 requires methodological innovation.
Advanced Statistical Frameworks
N-mixture Models with Bayesian Analysis 📊
The breakthrough research employed N-mixture models within a Bayesian analytical framework combined with spatial modeling. This approach offers several advantages:
- Accounts for imperfect detection: Not every bird present is observed during surveys
- Separates detection probability from true abundance: Provides more accurate population estimates
- Identifies acceleration patterns: Detects when decline rates themselves are changing
- Incorporates spatial autocorrelation: Recognizes that nearby sites share similar pressures
For ecologists implementing these methods in 2026, several software packages now make Bayesian N-mixture modeling accessible:
| Software | Strengths | Learning Curve | Cost |
|---|---|---|---|
| JAGS/R | Flexible, customizable | Steep | Free |
| Stan/R | Fast computation | Moderate | Free |
| PRESENCE | User-friendly interface | Gentle | Free |
| Distance | Specialized for surveys | Moderate | Free |
Adaptive Monitoring Protocols
Frequency-Based Strategies
Traditional annual surveys may miss rapid acceleration. Ecologists should consider:
- Quarterly surveys in identified hotspot regions
- Monthly monitoring during breeding season for priority species
- Opportunistic surveys triggered by environmental events (pesticide application, extreme weather)
- Citizen science integration to increase temporal coverage without proportional cost increases
Habitat-Specific Approaches
Since vulnerability varies dramatically by habitat type, survey strategies should differentiate:
Forest Species 🌲
- Positive population trends (though declining growth rate)
- Annual surveys sufficient for most species
- Focus on habitat quality metrics alongside counts
Wetland Species 💧
- Accelerating declines demand urgent attention
- Quarterly surveys recommended
- Integrate water quality and insect abundance monitoring
- Critical for biodiversity impact assessments
Open Woodland Species 🌳
- Particularly concerning acceleration patterns
- Monthly breeding season surveys
- Document edge habitat changes and agricultural encroachment
Grassland and Agricultural Edge Species 🌾
- Highest acceleration in Midwest hotspots
- Bi-weekly surveys during peak season
- Coordinate with agricultural activity calendars
Technology Integration for 2026
Modern survey strategies leverage technology to increase efficiency and data quality:
Acoustic Monitoring 🎵
- Automated recording units capture 24/7 data
- Machine learning algorithms identify species from vocalizations
- Particularly effective for nocturnal and secretive species
- Reduces observer bias and increases temporal coverage
Remote Sensing and Habitat Assessment 🛰️
- Satellite imagery tracks habitat changes between surveys
- Drone surveys assess habitat quality at fine scales
- LiDAR data reveals vegetation structure changes
- Integrates with biodiversity net gain assessments
Mobile Data Collection Platforms 📱
- Real-time data entry with GPS coordinates
- Immediate data quality checks
- Cloud synchronization for collaborative projects
- Integration with national databases (eBird, Breeding Bird Survey)
Coordinated Survey Networks
Individual surveys gain power when coordinated across landscapes:
- Regional coordination: Synchronize timing across hotspot areas
- Standardized protocols: Enable data comparison and meta-analysis
- Data sharing agreements: Maximize value of each survey effort
- Multi-stakeholder partnerships: Engage landowners, developers, and conservation groups
This collaborative approach mirrors successful biodiversity surveyor strategies that benefit both conservation and development interests.
Intervention Strategies: From Survey Data to Conservation Action
Survey data only matters when it drives effective conservation action. Bending North American Bird Decline Hotspots: Accelerated Survey Strategies for Ecologists in 2026 must connect monitoring to measurable interventions.
Agricultural Landscape Modification
Since agricultural intensification drives acceleration, interventions must address farming practices:
Pesticide Reduction Programs 🚫
- Targeted reduction of neonicotinoids in hotspot regions
- Integrated pest management adoption incentives
- Buffer zones around critical bird habitat
- Timing restrictions during breeding seasons
Habitat Corridor Creation 🌿
- Strategic placement of hedgerows and field margins
- Native plant strips supporting insect populations
- Connectivity between fragmented habitats
- Financial incentives for participating landowners
Regenerative Agriculture Adoption 🌱
- Reduced tillage preserving ground-nesting habitat
- Cover cropping supporting insect food sources
- Rotational grazing creating habitat diversity
- Carbon credit programs funding bird-friendly practices
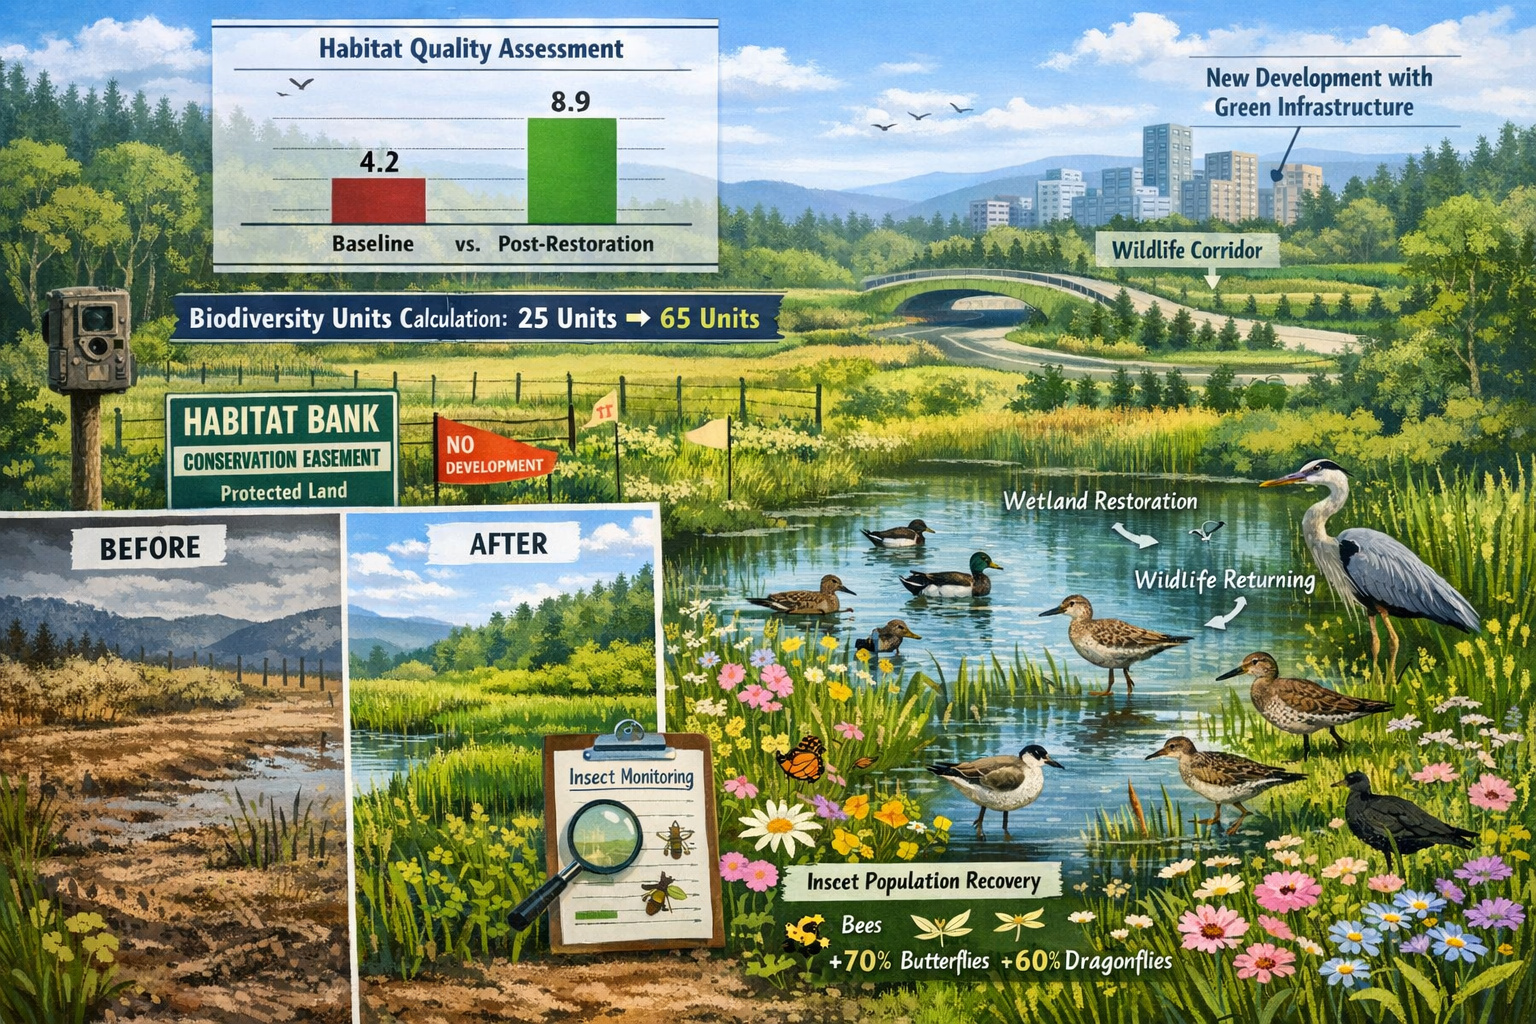
Biodiversity Net Gain Integration
The principles of biodiversity net gain offer a framework for development-driven conservation:
Development Project Requirements 🏗️
- Bird population baselines before project approval
- Mitigation hierarchy: avoid, minimize, restore, offset
- 10% net gain targets specifically for bird habitat
- Long-term monitoring requirements (30+ years)
Habitat Banking Opportunities 💰
- Land banking vs. habitat banking strategies for bird conservation
- Credits generated through agricultural land conversion
- Market mechanisms funding habitat restoration
- Priority placement in acceleration hotspots
On-site vs. Off-site Delivery 📍
- Strategic decisions based on landscape context
- Off-site delivery preferred in fragmented landscapes
- On-site delivery when connectivity opportunities exist
- Hybrid approaches maximizing bird population benefits
Climate-Agriculture Interaction Management
Research shows climate warming creates baseline losses while agricultural intensification drives acceleration. Effective interventions must address both:
Climate Adaptation Strategies 🌡️
- Assisted migration corridors for shifting ranges
- Microclimate refugia preservation
- Water resource protection in warming regions
- Phenological mismatch mitigation (timing of insect emergence vs. breeding)
Synergistic Interventions 🔄
- Agricultural practices that sequester carbon while supporting birds
- Wetland restoration providing both climate resilience and bird habitat
- Urban green infrastructure cooling cities while creating stopover habitat
- Renewable energy siting that avoids critical bird areas
Species-Specific Recovery Plans
Of the 63 species showing accelerated decline, priority species need targeted recovery efforts:
Criteria for Priority Species ⭐
- Acceleration rate exceeding 5% per decade
- Presence in multiple hotspot regions
- Functional importance (seed dispersers, insect controllers)
- Cultural or economic significance
Recovery Plan Components 📋
- Population viability analysis
- Critical habitat designation
- Threat abatement timelines
- Measurable recovery targets
- Adaptive management triggers
Building Collaborative Networks for Landscape-Scale Impact
Individual conservation efforts, while valuable, cannot match the scale of decline acceleration. Success requires coordinated action across jurisdictions, sectors, and stakeholder groups.
Multi-Stakeholder Partnerships
Essential Partners 🤝
- Agricultural producers: Implementing bird-friendly practices
- Conservation organizations: Technical expertise and funding
- Government agencies: Regulatory frameworks and incentives
- Developers: Benefitting nature through biodiversity surveyors
- Academic institutions: Research and monitoring capacity
- Citizen scientists: Expanded survey coverage
Partnership Structures
- Regional conservation collaboratives in hotspot areas
- Agricultural working groups developing incentive programs
- Developer-conservationist partnerships for net gain delivery
- Cross-border coordination for migratory species
Funding Mechanisms for Sustained Monitoring
Long-term survey programs require stable funding:
Traditional Sources 💵
- Government wildlife agency budgets
- Conservation organization grants
- University research programs
- Private foundation support
Innovative Mechanisms 💡
- Biodiversity credit sales funding monitoring
- Development mitigation fees supporting surveys
- Carbon market linkages for bird-friendly agriculture
- Eco-tourism revenue sharing with landowners
Policy Advocacy for Systemic Change
While individual projects matter, systemic policy changes offer the greatest leverage:
Priority Policy Targets 📜
- Pesticide regulations in hotspot regions
- Agricultural subsidy reform favoring bird-friendly practices
- Mandatory biodiversity net gain for all development
- Climate policy integration with conservation goals
- Cross-border migratory bird protection agreements
Measuring Success: Metrics and Adaptive Management
Effective conservation requires clear metrics to assess whether interventions are working.
Population-Level Metrics
Primary Indicators 📈
- Deceleration of decline rates: The ultimate success metric
- Population stabilization: Halting further losses
- Population recovery: Returning to historical baselines
- Range expansion: Species recolonizing restored habitats
Timeframes for Assessment
- Short-term (1-3 years): Habitat quality improvements, insect population recovery
- Medium-term (3-10 years): Breeding success increases, population stabilization
- Long-term (10+ years): Population recovery, acceleration reversal
Habitat-Level Metrics
Complementary Indicators 🌍
- Insect biomass and diversity
- Native plant community composition
- Habitat connectivity indices
- Agricultural practice adoption rates
- Pesticide use reduction percentages
Adaptive Management Triggers
When should strategies change?
Trigger Conditions 🚨
- Decline acceleration continues despite interventions
- Non-target species show unexpected negative responses
- Cost-effectiveness falls below threshold
- New threats emerge (disease, invasive species)
- Climate conditions exceed adaptation capacity
Response Protocols
- Quarterly review of monitoring data
- Annual strategy assessment meetings
- Five-year comprehensive program evaluation
- Rapid response protocols for crisis situations
Conclusion: Turning the Tide on Accelerated Bird Decline
The accelerating decline of 63 North American bird species across identified hotspots represents one of the most urgent conservation challenges of 2026. However, Bending North American Bird Decline Hotspots: Accelerated Survey Strategies for Ecologists in 2026 is achievable through coordinated action combining advanced monitoring, targeted interventions, and systemic policy change.
Key actions for ecologists and conservation professionals:
- Implement adaptive survey protocols using N-mixture models and Bayesian frameworks in Midwest, Mid-Atlantic, and California hotspots
- Address agricultural intensification through pesticide reduction, habitat corridors, and regenerative agriculture incentives
- Leverage biodiversity net gain frameworks to fund habitat restoration and create market mechanisms for conservation
- Build collaborative networks engaging farmers, developers, agencies, and communities in landscape-scale solutions
- Monitor acceleration metrics specifically, not just overall population trends, to detect whether interventions are working
The research is clear: agricultural intensification drives acceleration, climate warming creates baseline losses, and the interaction between these factors is particularly devastating. But the research also shows where to focus efforts and what interventions can work.
For professionals seeking to contribute to these efforts, biodiversity surveyor expertise becomes increasingly valuable. Whether conducting baseline assessments for development projects, implementing habitat banking schemes, or monitoring restoration success, skilled surveyors form the foundation of effective conservation.
The skies above North America can fill with birdsong again—but only if ecologists, conservationists, developers, and landowners act decisively in 2026 and beyond. The acceleration may be severe, but it's not irreversible. With the right survey strategies informing targeted interventions, we can bend the curve of decline and restore thriving bird populations across the continent.
Take action today: Connect with professional biodiversity surveyors to implement accelerated survey protocols on your properties or projects. Together, we can turn monitoring data into conservation success stories.
