
Recent research reveals that observed species range shifts occur at rates approximately four times faster than climate niche models predicted—a finding that fundamentally challenges how biodiversity surveyors approach Biodiversity Net Gain (BNG) site management in 2026. When static baseline assessments meet dynamic ecological reality, the question becomes: how can professionals track and adapt to species movements that outpace traditional monitoring frameworks?
Species Distribution Shifts in BNG Sites: Climate Velocity Mapping Protocols for Biodiversity Surveyors addresses this critical gap by integrating climate velocity modeling with field survey methodologies. As climate zones migrate across landscapes, species must follow suitable conditions or face local extinction. For BNG practitioners, this creates both challenges and opportunities in maintaining the 10% net gain requirement over 30-year timeframes.
Key Takeaways
- Species range shifts occur 4x faster than predicted by traditional climate models, requiring dynamic monitoring approaches rather than static baselines[1]
- Climate velocity mapping quantifies the speed and direction of climate zone movement, enabling surveyors to predict species distribution changes in BNG sites
- Repeat transect surveys integrated with velocity data provide early warning systems for trailing edge contractions and leading edge expansions
- Adaptive management protocols allow BNG strategies to respond to documented species shifts while maintaining regulatory compliance
- Genetic diversity considerations significantly influence range shift dynamics and should inform species selection for habitat creation
Understanding Climate Velocity and Its Impact on BNG Sites
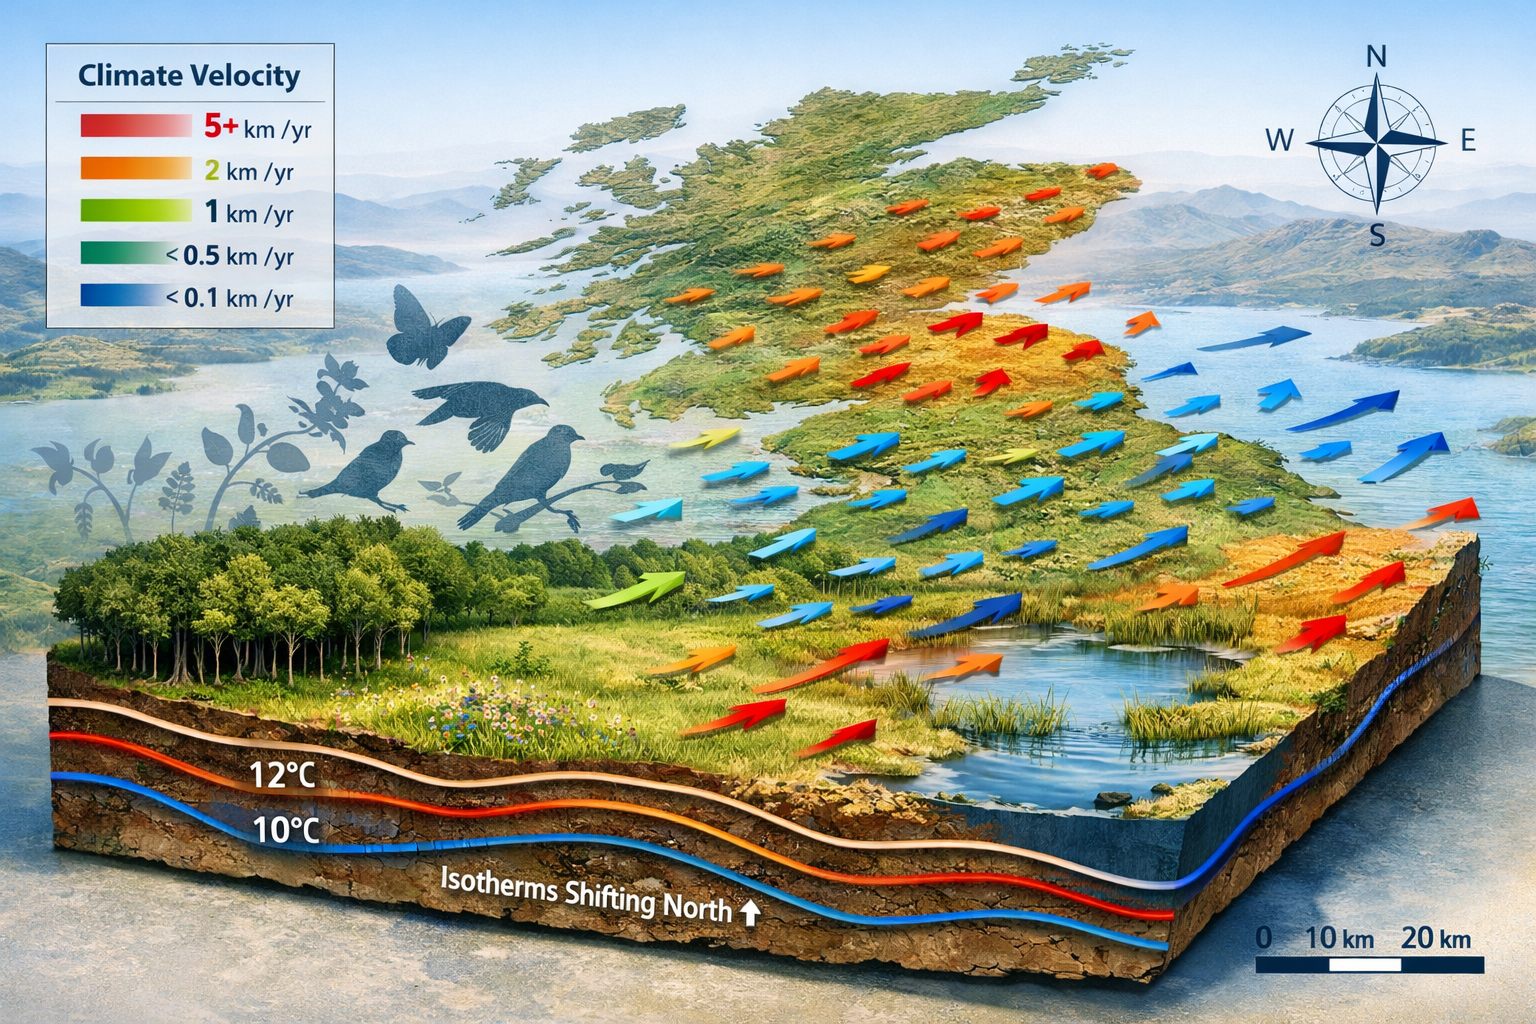
Climate velocity represents the speed and direction that species must move to maintain their current climate conditions. This metric, measured in kilometers per year, provides biodiversity surveyors with a quantifiable framework for predicting how species distributions will shift across BNG sites over the mandatory 30-year monitoring period.
What Makes Climate Velocity Different from Traditional Models
Traditional species distribution models rely on climate envelope approaches that predict where suitable conditions exist but fail to account for the rate of change. Research analyzing thousands of species—including plants, birds, fish, and butterflies—found that 62% of documented range shifts exceeded model predictions, while 38% showed slower-than-expected movements[1].
This variability stems from multiple factors:
- Dispersal limitations that prevent species from tracking climate at optimal speeds
- Habitat fragmentation creating barriers to movement
- Biotic interactions including competition and predation in new ranges
- Genetic diversity that modulates adaptation capacity at range edges[1]
For professionals conducting biodiversity impact assessments, these findings underscore the inadequacy of single-point-in-time surveys for long-term BNG planning.
Calculating Climate Velocity for UK Habitats 🌡️
Climate velocity calculations require three primary data inputs:
- Spatial climate gradients – temperature and precipitation patterns across landscapes
- Temporal climate trends – rate of change in climate variables
- Topographic complexity – elevation and aspect variations that create microclimates
The basic formula: Velocity = Temporal gradient / Spatial gradient
For example, if temperature increases by 0.3°C per decade (temporal gradient) and temperature changes by 1°C per 50 km distance (spatial gradient), the climate velocity equals 15 km per decade.
UK landscapes exhibit highly variable velocities:
| Habitat Type | Average Velocity | Key Considerations |
|---|---|---|
| Lowland grassland | 8-12 km/decade | High vulnerability; limited dispersal corridors |
| Woodland | 5-8 km/decade | Slower-moving tree species lag herbaceous understory |
| Wetland | 10-15 km/decade | Hydrological changes compound climate effects |
| Upland heath | 3-6 km/decade | Topographic refugia provide buffering |
Climate Velocity Mapping Protocols for Species Distribution Shifts in BNG Sites
Implementing climate velocity mapping within BNG frameworks requires systematic integration of spatial data, field observations, and predictive modeling. The Wildlife Conservation Society's Act Green project demonstrates how combining remote sensing with field data creates robust habitat mapping frameworks suitable for conservation and restoration landscapes[2].
Step 1: Baseline Climate and Species Data Collection
Establishing comprehensive baseline data forms the foundation for detecting Species Distribution Shifts in BNG Sites. This process extends beyond standard Phase 1 habitat surveys to include:
Climate microsite characterization:
- Temperature data loggers at 5-10 locations per hectare
- Soil moisture sensors in representative habitat patches
- Aspect and slope measurements for topographic analysis
- Canopy cover assessments affecting microclimate buffering
Species occurrence mapping:
- GPS-referenced presence/absence data for indicator species
- Abundance estimates using standardized survey methods
- Phenological observations noting seasonal timing shifts
- Population age structure data for demographic analysis
The Biodiversity Net Gain assessment process should incorporate these enhanced data requirements from project inception.
Step 2: Velocity Vector Mapping and Corridor Identification
Velocity vectors indicate both the speed and direction species must move to track suitable climate conditions. Creating these maps involves:
GIS-based velocity analysis:
- Import 30-year climate projections (UKCP18 data recommended)
- Calculate spatial climate gradients using elevation and latitude
- Generate velocity vectors as directional arrows on habitat maps
- Identify high-velocity zones requiring priority monitoring
Connectivity corridor assessment:
- Map existing habitat networks between BNG sites
- Identify barriers to species movement (roads, development, unsuitable habitat)
- Calculate effective distances accounting for habitat quality
- Prioritize corridor enhancement in off-site BNG delivery
Research indicates that habitat mapping frameworks integrating remote sensing with expert inputs significantly improve prediction accuracy for species restoration potential[2]. For BNG sites, this approach enables proactive habitat creation aligned with projected species movements.
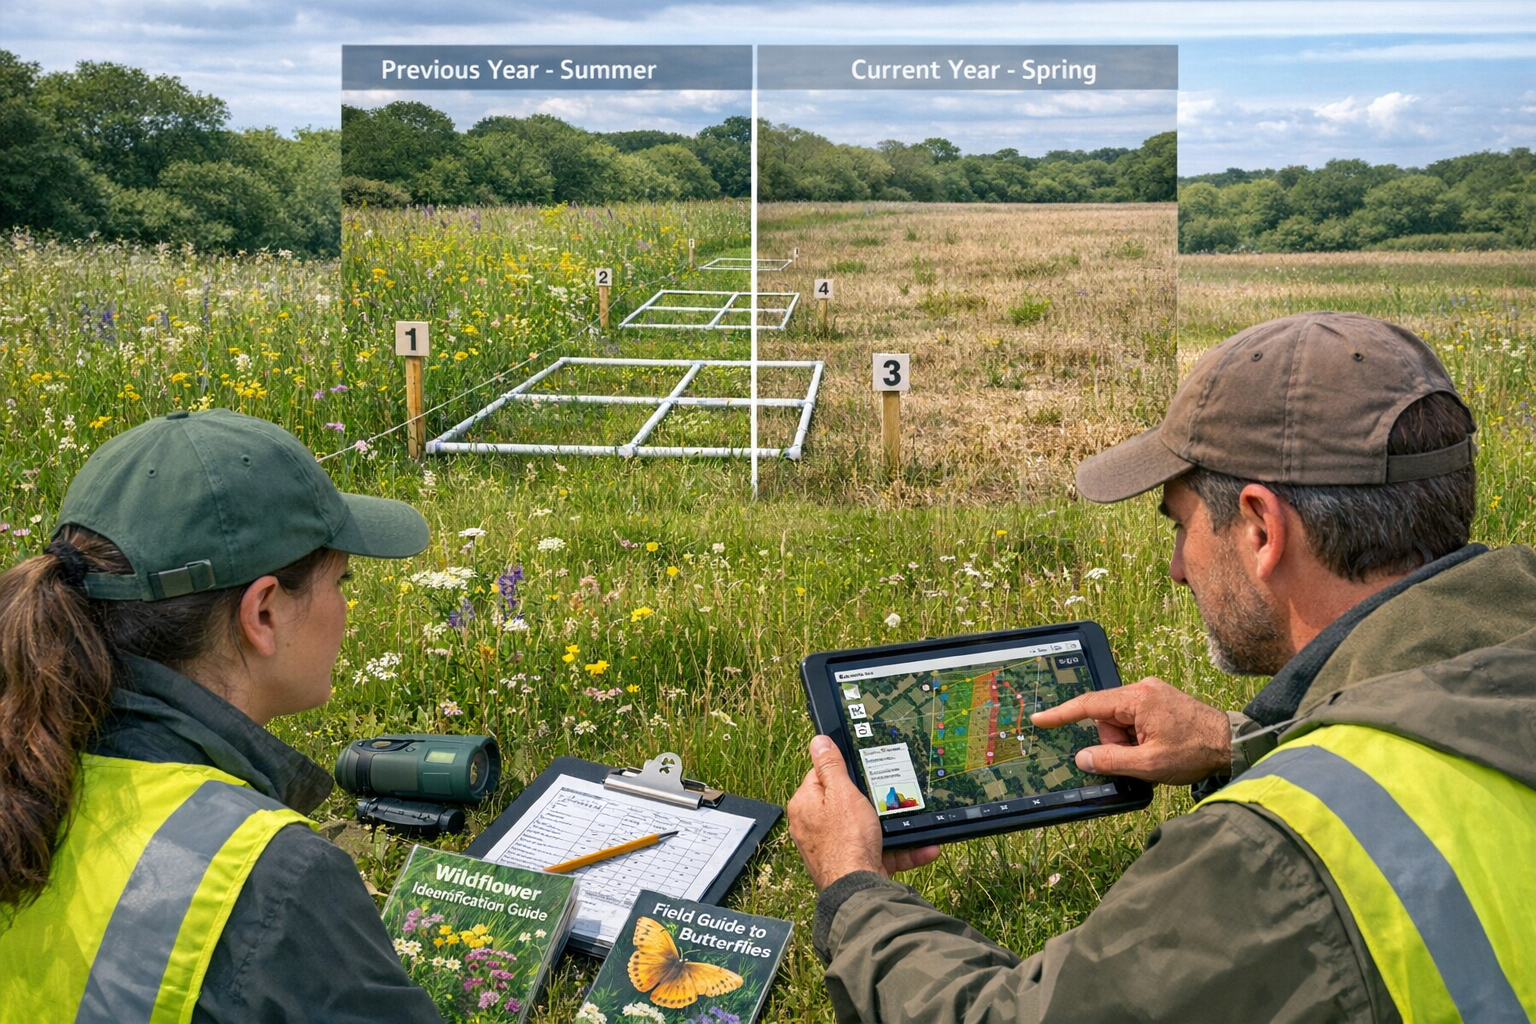
Step 3: Repeat Transect Survey Design
Traditional BNG monitoring occurs at years 1, 3, 5, 10, 20, and 30. Climate velocity protocols require increased temporal resolution during the first decade when range shifts accelerate most rapidly.
Enhanced survey schedule:
- Years 1-5: Annual surveys along permanent transects
- Years 6-10: Biennial surveys with expanded spatial coverage
- Years 11-30: Standard monitoring intervals with targeted species tracking
Transect placement strategy:
- Align transects parallel and perpendicular to velocity vectors
- Establish transects at range edge locations (trailing and leading edges)
- Include reference transects in climate refugia for comparison
- Minimum 3 transects per habitat type per BNG site
Data collection protocols:
- Standardized species lists with abundance categories
- Photographic documentation at fixed points
- Environmental variable measurements (temperature, moisture, pH)
- Phenological stage recording for climate sensitivity indicators
Step 4: Integrating Genetic Diversity Considerations
Recent research published in Ecology Letters demonstrates that species' genetic diversity significantly modulates range shift dynamics under moderate to rapid warming[1]. This finding has direct implications for Species Distribution Shifts in BNG Sites, particularly regarding:
Species selection for habitat creation:
- Prioritize species with documented genetic variation across climate gradients
- Source plant materials from multiple populations representing climate tolerance ranges
- Avoid single-provenance sourcing that limits adaptive capacity
- Consider assisted gene flow for isolated populations
Monitoring genetic indicators:
- Partner with research institutions for genetic sampling at 5-year intervals
- Focus on edge populations showing range expansion or contraction
- Document phenotypic variation potentially linked to local adaptation
- Inform habitat banking strategies with genetic data
Adaptive Management Frameworks for Species Distribution Shifts in BNG Sites
Static management plans cannot accommodate the dynamic reality of climate-driven species movements. Adaptive frameworks allow biodiversity surveyors to maintain BNG compliance while responding to documented ecological changes.
Establishing Decision Triggers and Thresholds
Adaptive management requires predetermined thresholds that trigger intervention. These should be specified in initial BNG management plans and agreed upon with regulatory authorities:
Population decline thresholds:
- 📉 20% decline in target species abundance over 3 years → Enhanced monitoring
- 📉 40% decline over 5 years → Active intervention required
- 📉 60% decline over 5 years → Management plan revision
Range shift indicators:
- New species establishing from climate velocity corridors → Document and assess BNG value
- Target species retracting from site edges → Investigate microclimate enhancement options
- Phenological mismatches exceeding 10 days → Assess trophic cascade risks
Habitat condition changes:
- Vegetation composition shifts exceeding 15% dissimilarity from baseline
- Invasive species establishment facilitated by climate change
- Soil moisture or temperature departures from historical ranges
Intervention Strategies Maintaining BNG Compliance
When monitoring detects significant Species Distribution Shifts in BNG Sites, intervention options must maintain or enhance biodiversity unit values:
Microclimate management:
- Strategic tree planting to create cooling effects in warming habitats
- Water management infrastructure for moisture-dependent species
- Aspect-specific interventions on sloped sites
- Shelter belt creation reducing temperature extremes
Assisted colonization protocols:
- Introduce climate-adapted ecotypes of existing target species
- Facilitate natural colonization through corridor enhancement
- Document all introductions with genetic provenance data
- Monitor establishment success and ecosystem integration
Habitat type transitions:
- Allow managed transitions between habitat types as climate shifts
- Recalculate biodiversity units using updated habitat classifications
- Ensure net gain maintenance through compensatory habitat creation
- Document transitions in annual monitoring reports
For developers and landowners working to achieve 10% biodiversity net gain, these adaptive approaches provide insurance against climate-driven BNG failures.
Reporting and Regulatory Communication
Transparent communication with local planning authorities ensures adaptive management actions align with BNG requirements:
Annual monitoring reports should include:
- Climate velocity vector updates with current species distribution data
- Comparison of observed vs. predicted range shifts
- Photographic evidence of habitat condition changes
- Intervention justifications linked to decision thresholds
- Updated biodiversity unit calculations if habitat types have transitioned
Five-year strategic reviews should assess:
- Overall trajectory of BNG site toward 30-year goals
- Effectiveness of adaptive interventions implemented
- Revised climate projections and velocity calculations
- Recommendations for management plan amendments
Technological Tools Supporting Climate Velocity Protocols
Modern biodiversity surveying increasingly relies on technological integration to enhance data quality and analytical capacity.
Remote Sensing and Satellite Data
Vegetation monitoring:
- NDVI (Normalized Difference Vegetation Index) time series detecting phenological shifts
- Thermal imagery identifying microclimate variations
- LiDAR data for structural habitat complexity assessment
- Multi-spectral analysis for species-level identification in some habitats
Climate data sources:
- UKCP18 projections at 2.2km resolution for local-scale planning
- ERA5 reanalysis data for historical climate baselines
- Weather station networks providing ground-truth validation
- Soil moisture satellite products (SMAP, SMOS) for hydrological monitoring
Mobile Data Collection Platforms
Field surveyors benefit from integrated mobile applications that:
- Record GPS-tagged species observations with timestamp metadata
- Link observations to permanent transect locations automatically
- Upload data to centralized databases in real-time
- Generate automated alerts when observations fall outside expected ranges
- Facilitate photo documentation with standardized naming conventions
Predictive Modeling Software
Several platforms enable biodiversity surveyors to conduct velocity analyses:
- R packages (VoCC, climateStability) for velocity calculation and visualization
- QGIS plugins for spatial climate analysis and corridor mapping
- Maxent for species distribution modeling integrated with velocity data
- Zonation for spatial conservation prioritization accounting for climate change
Case Study Applications in UK BNG Sites
Lowland Grassland Restoration in Southeast England
A 15-hectare BNG site in Kent implemented climate velocity protocols following baseline surveys in 2024. Initial velocity mapping revealed northward climate movement at 11 km/decade, with transects established perpendicular to velocity vectors.
Key findings after 2 years:
- Butterfly species composition shifted 8% toward thermophilic species
- Three plant species showed range edge expansion into the site
- Two target grassland species declined at southern transects but remained stable in northern sections
Adaptive responses:
- Enhanced microclimate diversity through varied mowing regimes
- Created additional flower-rich patches in cooler northern sections
- Adjusted species targets to include climate-adapted grassland specialists
- Maintained overall biodiversity unit values through habitat quality improvements
Woodland Edge Management in Midlands BNG Site
A 22-hectare mixed woodland BNG site incorporated velocity mapping into management planning, identifying moderate velocity (6 km/decade) with significant topographic complexity creating refugia.
Management innovations:
- Established monitoring transects specifically targeting microclimatic gradients
- Documented natural colonization by southern woodland species
- Created structural diversity enhancing microclimate buffering
- Integrated genetic diversity sampling for key tree species showing range expansion
Results demonstrating adaptive success:
- Maintained target woodland bird populations despite regional declines
- Facilitated natural establishment of climate-adapted understory species
- Exceeded 10% net gain targets through enhanced habitat heterogeneity
- Provided demonstration site for biodiversity net gain strategies
Challenges and Limitations in Implementation
Data Availability and Resolution Constraints
Climate projections contain inherent uncertainties that compound over 30-year BNG timeframes. Velocity calculations depend on spatial resolution that may not capture microclimate variations critical to species persistence.
Practical limitations:
- UKCP18 data at 2.2km resolution may miss site-specific topographic effects
- Species distribution data often lacks sufficient temporal depth for trend analysis
- Genetic diversity information remains unavailable for most species
- Baseline surveys may not capture full species assemblages during single-season visits
Resource Requirements and Cost Implications
Enhanced monitoring protocols require additional investment beyond standard BNG commitments:
Estimated cost increases:
- Climate data acquisition and analysis: £2,000-4,000 per site
- Enhanced survey frequency (Years 1-5): 40-60% increase over standard protocols
- Genetic sampling and analysis: £500-1,500 per species per sampling event
- Adaptive intervention implementation: Variable, £5,000-20,000 depending on scale
For developers evaluating biodiversity net gain costs, these additions represent 15-25% increases in total monitoring budgets but provide substantial risk mitigation.
Regulatory Framework Evolution
Current BNG guidance does not explicitly address climate-driven species distribution shifts. Adaptive management approaches require regulatory flexibility that may not exist under rigid compliance frameworks.
Recommended policy developments:
- Clear guidance on acceptable habitat type transitions maintaining net gain
- Streamlined approval processes for science-based adaptive interventions
- Recognition of climate velocity mapping as acceptable monitoring methodology
- Flexible biodiversity unit calculation allowing for documented ecological change
Training and Competency Requirements for Surveyors
Implementing Species Distribution Shifts in BNG Sites: Climate Velocity Mapping Protocols for Biodiversity Surveyors requires expanded skillsets beyond traditional ecological survey training.
Essential competencies:
✅ Climate science fundamentals – Understanding climate projections, uncertainty, and downscaling methods
✅ GIS and spatial analysis – Proficiency in QGIS or ArcGIS for velocity mapping and corridor analysis
✅ Statistical analysis – Ability to detect significant trends in time-series species data
✅ Adaptive management principles – Decision-making frameworks under uncertainty
✅ Regulatory compliance – Navigation of BNG requirements while implementing novel approaches
Professional development pathways:
- Specialized training courses in climate change ecology
- GIS certification programs with conservation applications
- Participation in research partnerships providing genetic sampling expertise
- Peer learning networks sharing velocity mapping case studies
Organizations providing biodiversity surveying services should invest in staff development to maintain competitive advantage as climate-adaptive BNG becomes standard practice.
Future Directions and Research Needs
Integration with National Biodiversity Monitoring
Climate velocity protocols implemented across multiple BNG sites create valuable datasets for national-scale conservation planning. Coordinated monitoring could:
- Identify regional patterns in range shift velocities
- Validate climate model predictions with real-world observations
- Inform strategic habitat network planning
- Contribute to UK Biodiversity Indicators and reporting obligations
Technological Innovations on the Horizon
Emerging technologies promise to enhance velocity mapping capabilities:
Environmental DNA (eDNA):
- Rapid species detection without extensive field surveys
- Early warning of colonizing species
- Cost-effective monitoring of aquatic and soil communities
Machine learning and AI:
- Automated species identification from camera trap and acoustic data
- Predictive models incorporating multiple environmental variables
- Real-time analysis of remote sensing data detecting habitat changes
Drone-based surveys:
- High-resolution thermal and multispectral imagery
- Vegetation structure analysis at fine spatial scales
- Repeated surveys with minimal disturbance
Policy Integration and Scaling
As evidence accumulates demonstrating the necessity of climate-adaptive BNG management, policy frameworks must evolve. Key developments needed by 2030:
- Mandatory climate velocity assessments for BNG sites exceeding 5 hectares
- Standardized protocols ensuring consistency across projects
- Financial mechanisms supporting enhanced monitoring requirements
- Integration with biodiversity credit markets rewarding climate-resilient habitat creation
Conclusion
Species Distribution Shifts in BNG Sites: Climate Velocity Mapping Protocols for Biodiversity Surveyors represents a fundamental evolution in how professionals approach long-term biodiversity management. The evidence is unambiguous: species are moving faster than traditional models predict, and static baseline assessments cannot ensure 30-year BNG compliance in a changing climate.
Climate velocity mapping provides the quantitative framework needed to anticipate, detect, and respond to these shifts. By integrating velocity calculations with enhanced monitoring protocols and adaptive management frameworks, biodiversity surveyors can transform potential BNG failures into opportunities for climate-resilient habitat creation.
Immediate action steps for practitioners:
-
Incorporate climate velocity assessments into all new BNG baseline surveys, calculating site-specific velocities and mapping directional vectors
-
Design enhanced monitoring protocols with increased survey frequency during years 1-5 and transects aligned with velocity gradients
-
Establish clear decision thresholds in management plans that trigger adaptive interventions while maintaining regulatory compliance
-
Invest in professional development building competencies in climate science, GIS analysis, and adaptive management
-
Engage proactively with regulators to establish precedents for climate-adaptive BNG approaches and flexible compliance frameworks
-
Document and share outcomes contributing to the evidence base supporting velocity-informed biodiversity management
The transition from static to dynamic BNG management is not optional—it is essential for delivering genuine, lasting biodiversity gains in a changing climate. Surveyors who embrace these protocols position themselves at the forefront of conservation practice while providing clients with robust, future-proof biodiversity strategies.
For developers, landowners, and conservation professionals navigating the complexities of biodiversity net gain delivery, climate velocity mapping offers both risk mitigation and opportunity. Sites managed with climate foresight will not only meet regulatory requirements but will contribute meaningfully to landscape-scale conservation in an era of unprecedented ecological change.
The tools, protocols, and frameworks exist today. The question is not whether to integrate climate velocity mapping into BNG practice, but how quickly the industry can scale these approaches to meet the challenge of species distribution shifts already underway across UK landscapes.
References
[1] Species Range Shifts Are More Complex Than What The Models Predict – https://csp-inc.org/species-range-shifts-are-more-complex-than-what-the-models-predict/
[2] New Mapping Approach Predicts Habitat Availability For Species Conservation – https://news.mongabay.com/2026/03/new-mapping-approach-predicts-habitat-availability-for-species-conservation/
