
The planet faces an urgent biodiversity crisis. Species populations are declining at unprecedented rates, ecosystems are collapsing, and the natural systems that support human life are under severe threat. Yet amid this crisis, a critical question emerges: Can we reverse these trends? The concept of "Bending Global Biodiversity Curves: Surveyor Scenario Modeling for Net Gain Projections" represents a scientific approach to answering this question through sophisticated modeling techniques that forecast whether coordinated policy actions can halt and reverse biodiversity loss by 2050.
For biodiversity surveyors, planners, and conservation professionals working on the ground, understanding these global scenario models provides essential context for local biodiversity net gain initiatives. The modeling tools and methodologies used to project global trends offer valuable frameworks for forecasting outcomes at project and regional scales.
Key Takeaways
- 🌍 Only 11 bending-the-curve scenarios exist across 138 global biodiversity models, showing how rare positive projection scenarios truly are
- 📊 Current policies lead to continued decline: baseline scenarios project biodiversity losses of 5.9% to 12.7% by 2050 without intervention
- 🔄 Integrated action is essential: reversing biodiversity loss requires coordinated efforts across conservation, agriculture, climate, diet, and waste reduction—not single-sector solutions
- 📈 Modest gains are achievable: ambitious policy scenarios project average biodiversity increases of 3.6% by 2050, though results vary significantly by indicator
- ⚠️ Models have critical gaps: most scenarios inadequately account for climate change impacts and focus on single drivers rather than multiple interacting pressures
Understanding Bending-the-Curve Scenarios in Biodiversity Modeling
What Does "Bending the Curve" Actually Mean?
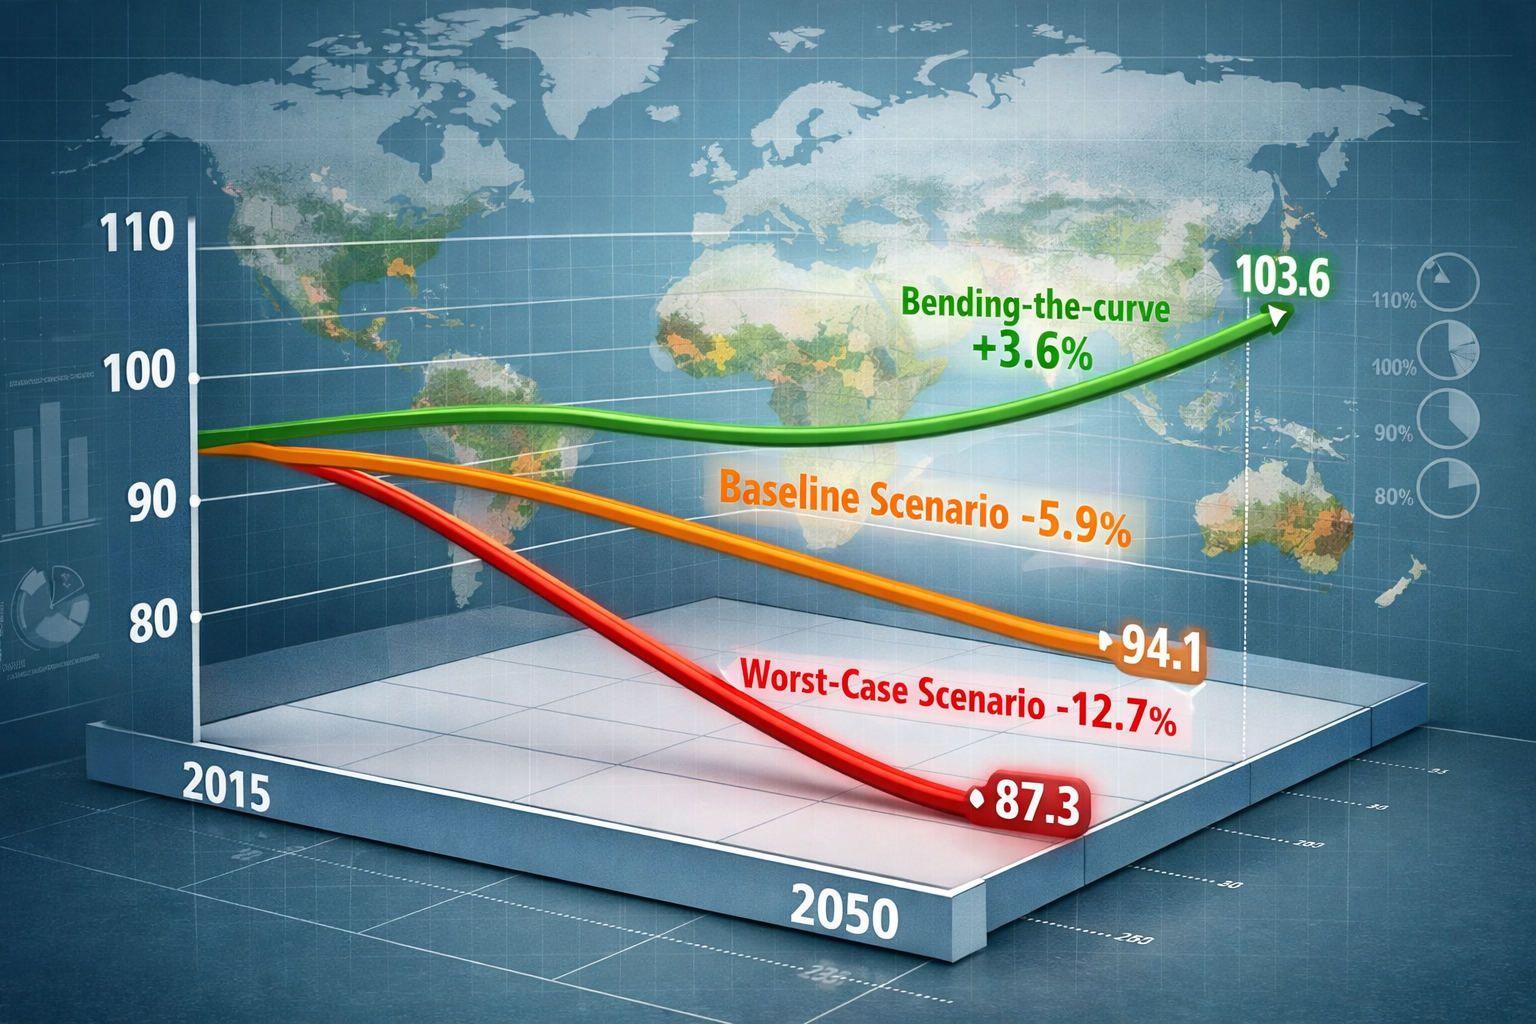
The term "bending the curve" refers to reversing the trajectory of biodiversity decline from downward to upward—achieving net positive gains rather than simply slowing losses. In practical terms, this means projecting scenarios where biodiversity indicators in 2050 show improvement compared to a 2015 baseline[1].
This concept matters enormously for professionals implementing biodiversity net gain explained strategies at local scales. If global models struggle to identify pathways to net positive outcomes, it highlights the challenges facing project-level interventions.
The Scarcity of Positive Scenarios
A comprehensive meta-analysis examining global biodiversity projections revealed a sobering reality: only 11 bending-the-curve scenarios exist among 138 modeled scenarios from 57 research papers[1]. This scarcity demonstrates that:
- Most scientific models project continued biodiversity decline under current policies
- Achieving net positive outcomes requires extraordinarily ambitious interventions
- The scientific community has focused more on documenting decline than modeling recovery pathways
The analysis categorized scenarios into three types:
| Scenario Type | Number of Scenarios | Average Biodiversity Change by 2050 |
|---|---|---|
| Worst-case scenarios | Not specified | -12.7% |
| Baseline (current policy) | Majority of 138 | -5.9% |
| Bending-the-curve | 11 scenarios | +3.6% |
Key Biodiversity Indicators Used in Modeling
Scenario models employ various biodiversity indicators to measure change, each capturing different aspects of ecosystem health:
- Mean Species Abundance (MSA): Measures average population sizes relative to undisturbed conditions
- Living Planet Index (LPI): Tracks population trends of vertebrate species
- Species richness: Counts the number of different species in an area
- Natural vegetation extent: Measures habitat area remaining
Importantly, the same policy intervention can produce different outcomes across indicators[1]. A scenario might show net gains in MSA while only reducing losses in LPI, complicating assessments of success. This variability mirrors challenges faced by surveyors when planning biodiversity net gain projects, where different metrics may tell different stories.
The Modeling Framework Behind Bending Global Biodiversity Curves

How Scenario Models Project Biodiversity Futures
Biodiversity scenario models integrate multiple components to project future outcomes:
- Driver projections: Forecasts of land-use change, climate change, pollution, invasive species, and overexploitation
- Policy interventions: Simulated effects of conservation actions, agricultural reforms, and regulatory changes
- Ecological relationships: Mathematical representations of how species respond to environmental changes
- Spatial dynamics: Geographic patterns of habitat loss, fragmentation, and restoration
These models typically run projections from a 2015 baseline to 2050, allowing comparison of different policy pathways. For surveyors conducting biodiversity impact assessments, understanding this modeling framework provides context for local-scale projections.
The Single-Pressure Problem
A critical limitation emerges in current modeling: nearly all bending-the-curve scenarios account for only one driver—typically land-use change[1]. Meanwhile, only about half of scenarios that merely reduce losses incorporate multiple biodiversity pressures.
This creates a significant realism gap. In the real world:
- Land-use change interacts with climate change
- Agricultural expansion compounds pollution impacts
- Invasive species exploit disturbed habitats
- Multiple pressures act synergistically, often amplifying negative effects
"Single-pressure modeling limits realism and may overestimate our ability to reverse biodiversity loss through land-use interventions alone."
For professionals working on achieving biodiversity net gain without risk, this highlights the importance of considering multiple threats simultaneously rather than focusing exclusively on habitat area.
The Climate Change Blind Spot
Perhaps the most concerning gap: most bending-the-curve studies inadequately account for climate change[3]. This omission risks creating false optimism about the feasibility of reversing biodiversity loss.
Climate change affects biodiversity through:
- Direct physiological stress: Temperature and precipitation changes exceed species' tolerance ranges
- Phenological mismatches: Timing of life cycle events becomes desynchronized (e.g., plants flowering before pollinators emerge)
- Range shifts: Species must migrate to track suitable climate conditions
- Extreme events: Droughts, floods, and fires become more frequent and severe
Models that exclude these dynamics may overestimate species' adaptation capacity[2]. They often rely on coarse statistical relationships between climate and species distributions while overlooking local-scale constraints on adaptation.
Integrated Policy Pathways for Bending Global Biodiversity Curves
Why Single-Sector Interventions Fall Short
The research is unequivocal: bending the curve requires coordinated cross-sectoral action[2]. Single-sector interventions—even ambitious ones—prove insufficient to reverse biodiversity decline.
Consider protected areas as an example. While expanding conservation lands helps, it cannot alone compensate for:
- Continued habitat conversion in unprotected areas
- Climate-driven ecosystem shifts within protected boundaries
- Pollution flowing from surrounding agricultural and urban lands
- Invasive species spreading across landscapes
This principle applies equally at project scales. When planning biodiversity net gain strategies, developers and surveyors must consider interventions across multiple dimensions rather than relying solely on habitat creation.
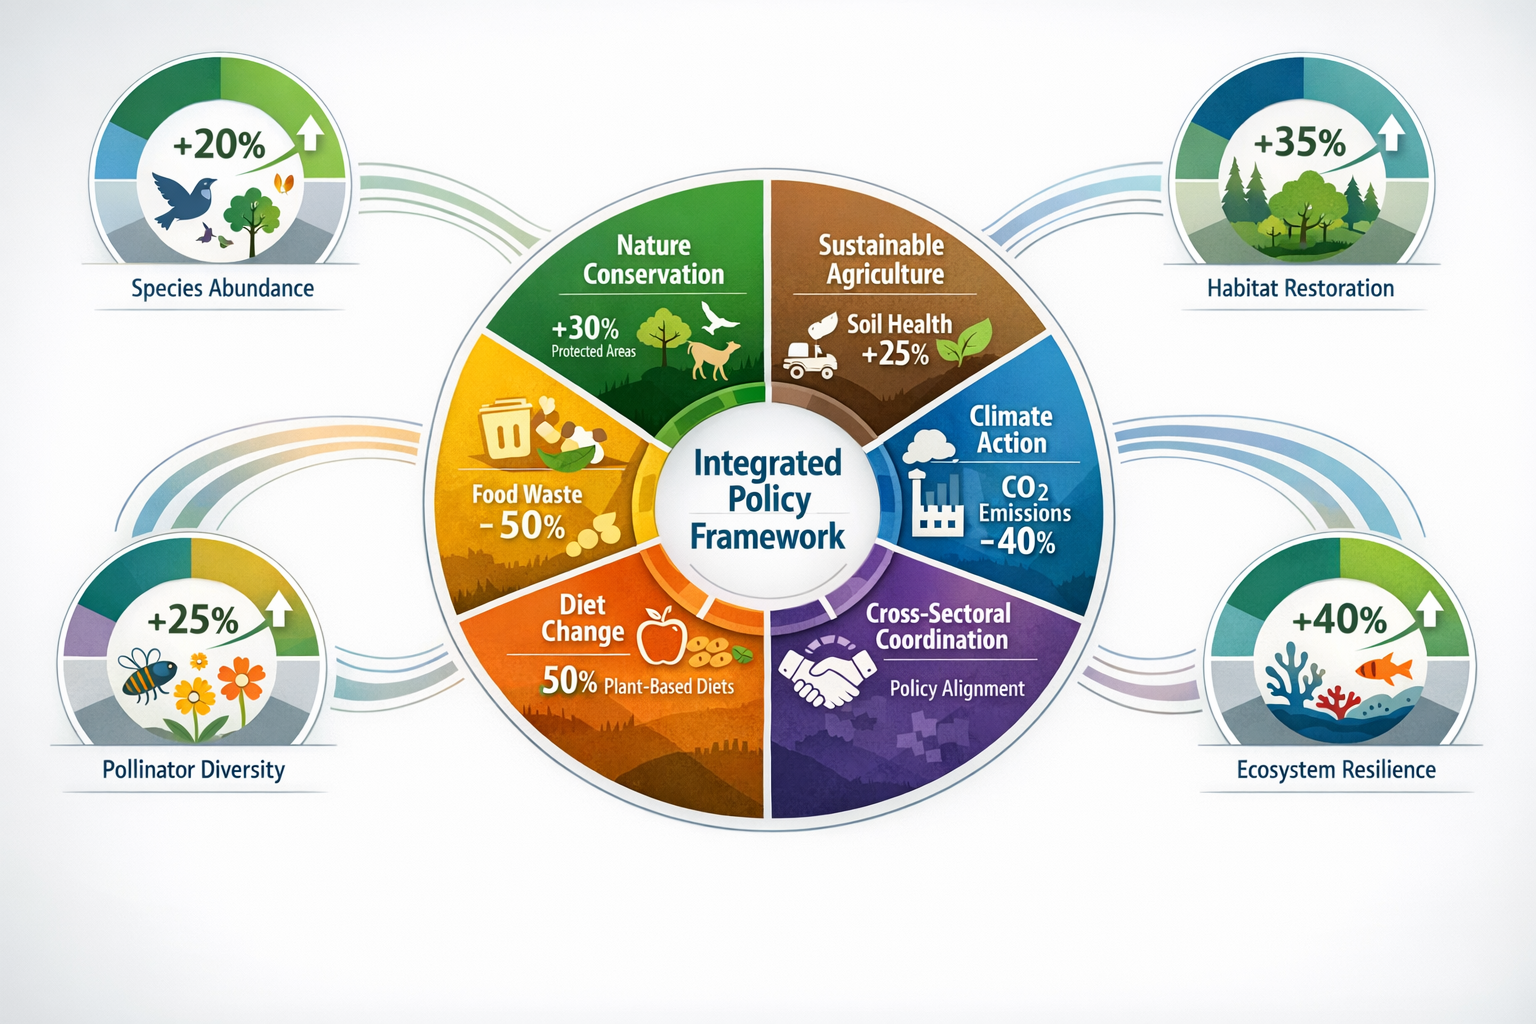
The Four Pillars of Integrated Action
Successful bending-the-curve scenarios incorporate four interconnected policy domains:
1. Nature Conservation 🌳
- Expanding protected area networks to cover critical habitats
- Restoring degraded ecosystems
- Implementing wildlife corridors to maintain connectivity
- Strengthening enforcement against illegal exploitation
2. Sustainable Food Production 🌾
- Adopting regenerative agricultural practices
- Reducing chemical inputs and promoting organic methods
- Implementing agroforestry and mixed farming systems
- Improving livestock management to reduce land pressure
3. Diet Change 🥗
- Shifting toward plant-rich diets in high-consumption regions
- Reducing meat and dairy consumption, particularly from intensive systems
- Promoting sustainable seafood choices
- Addressing overconsumption in affluent populations
4. Food Waste Reduction ♻️
- Improving supply chain efficiency
- Changing consumer behavior around food disposal
- Redirecting surplus food to human consumption
- Converting unavoidable waste to compost or energy
Quantifying Policy Outcomes
When these four pillars work together, models project an average 3.6% positive change in biodiversity indicators by 2050[2]. However, this figure masks substantial variation:
- Some indicators show gains while others merely reduce losses
- One outlier study projected up to 92% recovery of natural vegetation in arable areas under extreme transformation scenarios
- Geographic variation is substantial, with some regions showing stronger responses than others
For surveyors working on biodiversity net gain assessments, these findings underscore the importance of:
- Setting realistic gain targets based on baseline conditions
- Considering multiple intervention types rather than single approaches
- Planning for long-term monitoring to track actual versus projected outcomes
- Understanding that gains may manifest differently across habitat types and species groups
Applying Global Scenario Insights to Local Biodiversity Net Gain Projects
Translating Global Models to Project Scales
While global scenario models operate at continental and planetary scales, their methodological approaches inform local biodiversity net gain planning. Key transferable principles include:
Baseline establishment: Global models use 2015 as a reference point. Similarly, biodiversity net gain reports require rigorous baseline surveys to establish pre-development conditions.
Multiple scenarios: Global analyses compare worst-case, baseline, and ambitious intervention scenarios. Project-level planning should similarly model different design options and their biodiversity outcomes.
Long-term projections: Global models project to 2050 (35 years from baseline). Local BNG plans should consider habitat maturation timelines, recognizing that created habitats may take decades to reach target conditions.
Indicator selection: Just as global models use multiple biodiversity metrics, local assessments benefit from tracking various indicators rather than relying on single measures.
The Importance of Multi-Pressure Assessment
Global scenario research demonstrates that single-pressure modeling underestimates challenges[1]. This insight directly applies to development projects:
When conducting site assessments, surveyors should evaluate:
- ✅ Direct habitat loss from development footprint
- ✅ Edge effects and fragmentation of remaining habitat
- ✅ Pollution risks (light, noise, chemical runoff)
- ✅ Hydrological changes affecting wetlands and watercourses
- ✅ Increased human disturbance and access
- ✅ Climate change vulnerability of proposed habitat types
Architects solving biodiversity net gain challenges should integrate these considerations into design from the earliest stages rather than treating biodiversity as an add-on.
On-Site Versus Off-Site Delivery Decisions
The global research on integrated interventions offers perspective on the on-site versus off-site delivery debate. Key insights include:
Connectivity matters: Just as global models emphasize landscape-scale habitat networks, local BNG strategies should prioritize interventions that enhance ecological connectivity rather than creating isolated patches.
Context determines effectiveness: The same intervention produces different outcomes in different settings. Off-site habitat creation in strategically located areas may deliver greater biodiversity value than constrained on-site measures.
Multiple intervention types: Rather than relying solely on habitat creation, consider combining restoration, enhancement, and management improvements—mirroring the integrated approach of successful global scenarios.
For developers evaluating biodiversity unit costs, understanding these effectiveness variations helps optimize investment allocation.
Challenges and Limitations in Scenario Modeling for Net Gain Projections
Uncertainty in Ecological Predictions
All biodiversity models face inherent predictive uncertainty stemming from:
- Incomplete ecological knowledge: We don't fully understand all species interactions and ecosystem processes
- Stochastic events: Random disturbances like disease outbreaks or extreme weather
- Human behavior unpredictability: Policy implementation varies based on political will and social acceptance
- Non-linear responses: Ecosystems may shift abruptly rather than changing gradually
This uncertainty doesn't invalidate modeling—it emphasizes the need for adaptive management approaches that monitor outcomes and adjust interventions accordingly.
Data Gaps and Taxonomic Bias
Global biodiversity models suffer from significant data limitations:
- Most data comes from well-studied regions (Europe, North America)
- Vertebrates are overrepresented while invertebrates and plants receive less attention
- Soil organisms and microbes are largely absent from models despite their ecological importance
- Marine and freshwater ecosystems receive less coverage than terrestrial systems
At project scales, similar biases emerge. Biodiversity surveys often focus on protected species and conspicuous taxa while overlooking functionally important but less charismatic organisms.
The Standardization Challenge
The meta-analysis revealed that lack of standardized indicators hampers comparison across studies[3]. Different research teams use different:
- Biodiversity metrics
- Spatial resolutions
- Temporal baselines
- Policy scenario definitions
This fragmentation prevents robust synthesis and makes it difficult to identify which interventions work best. The biodiversity net gain community faces similar challenges, with various assessment methodologies and metric calculations in use.
Researchers recommend:
- Adopting standardized biodiversity indicators across studies
- Conducting model intercomparisons to test consistency
- Establishing common scenario frameworks
- Improving transparency in model assumptions and parameters
Future Directions for Bending Global Biodiversity Curves Through Surveyor Scenario Modeling
Improving Model Realism and Comprehensiveness
The next generation of biodiversity scenario models must address current limitations by:
Integrating climate change properly: Future models should fully incorporate climate dynamics, including extreme events, phenological shifts, and adaptation constraints[3].
Multi-pressure modeling: Moving beyond single-driver scenarios to capture interactions among land-use change, climate, pollution, invasive species, and overexploitation[1].
Finer spatial resolution: Improving geographic detail to capture local-scale processes and heterogeneity that influence biodiversity outcomes.
Expanded taxonomic coverage: Including invertebrates, plants, fungi, and microorganisms alongside vertebrates to represent ecosystem functioning more completely.
Enhanced Policy Scenario Development
Future scenario work should explore:
- Implementation pathways: Not just what policies are needed, but how to achieve political and social acceptance
- Economic transitions: Modeling economic impacts and just transition strategies for affected communities
- Regional variation: Recognizing that optimal policy mixes differ across geographic and cultural contexts
- Timeline sensitivity: Testing whether faster or slower implementation affects ultimate outcomes
Technology and Innovation Integration
Emerging technologies offer new opportunities for both global modeling and local implementation:
- 🛰️ Remote sensing: Satellite imagery and drone surveys enable continuous habitat monitoring at multiple scales
- 🤖 Artificial intelligence: Machine learning can identify species, predict habitat suitability, and optimize intervention placement
- 📱 Citizen science platforms: Mobile apps engage public participation in biodiversity monitoring, expanding data collection
- 🧬 Environmental DNA: eDNA sampling detects species presence from water, soil, or air samples, improving survey comprehensiveness
For surveyors, these technologies enhance capacity to establish baselines, monitor outcomes, and validate projections. When creating biodiversity plans for development projects, incorporating these tools improves both assessment quality and cost-efficiency.
Bridging Global Science and Local Action
The ultimate value of global scenario modeling lies in informing local action. Strengthening this connection requires:
Downscaling methodologies: Developing approaches to translate global scenarios into regional and local projections that inform specific projects.
Practitioner engagement: Involving surveyors, planners, and land managers in model development to ensure outputs address real-world decision needs.
Accessible tools: Creating user-friendly interfaces that allow non-specialists to explore scenario outcomes and test intervention options.
Case study documentation: Building libraries of implemented projects with monitored outcomes to validate and refine model predictions.
For professionals working on small development projects, simplified scenario tools could help optimize limited budgets for maximum biodiversity benefit.
Conclusion
The science of Bending Global Biodiversity Curves: Surveyor Scenario Modeling for Net Gain Projections reveals both the magnitude of the challenge and the pathways to success. With only 11 bending-the-curve scenarios identified among 138 global models, achieving net positive biodiversity outcomes by 2050 requires unprecedented ambition and coordination[1].
Key insights for biodiversity professionals include:
Integrated action is non-negotiable: Single-sector interventions cannot reverse biodiversity decline. Success requires coordinated efforts across conservation, sustainable agriculture, diet change, and waste reduction[2].
Current trajectories are insufficient: Without transformative policy changes, biodiversity will continue declining by 5.9% to 12.7% by 2050 compared to 2015 levels[1].
Models have critical gaps: Inadequate treatment of climate change and focus on single pressures mean current scenarios may overestimate our capacity to reverse losses[3].
Modest gains are achievable: With ambitious integrated policies, average biodiversity improvements of 3.6% by 2050 are projected, though outcomes vary significantly by indicator and region[2].
Actionable Next Steps
For biodiversity surveyors, planners, and developers:
- Adopt multi-pressure assessment approaches that consider interactions among habitat loss, climate change, pollution, and other threats rather than single factors
- Implement integrated intervention strategies combining habitat creation, restoration, enhancement, and sustainable management practices
- Use standardized metrics to enable comparison across projects and contribute to broader understanding of what works
- Plan for long-term monitoring to validate projections and enable adaptive management as conditions change
- Engage with emerging technologies like remote sensing, AI, and eDNA to improve assessment quality and cost-effectiveness
The path to bending biodiversity curves—whether at global or project scales—demands ambitious vision grounded in rigorous science. By applying scenario modeling insights to local biodiversity net gain initiatives, surveyors and planners can contribute to the transformative change needed to secure nature's future.
Ready to apply these insights to your development project? Contact biodiversity surveyors to discuss how scenario modeling can optimize your net gain strategy, or explore guidance for developers to understand your obligations and opportunities.
References
[1] Sciadv – https://www.science.org/doi/10.1126/sciadv.aeb2277
[2] Pmc12880551 – https://pmc.ncbi.nlm.nih.gov/articles/PMC12880551/
[3] Can We Bend The Curve Trends In Global Biodiversity Scenarios – https://research-portal.uu.nl/en/publications/can-we-bend-the-curve-trends-in-global-biodiversity-scenarios/
