
The future of sustainable agriculture depends on accurate, standardized biodiversity measurement. As Field to Market: The Alliance for Sustainable Agriculture prepares its 2026 National Indicators Report, a critical opportunity emerges for ecological surveyors to shape how the United States tracks biodiversity across millions of acres of commodity cropland. With the March 2026 request for proposals now active, understanding how farm-scale biodiversity surveys integrate into national reporting frameworks has never been more important.
The Crop Production Biodiversity Metrics: Surveyor Guide to 2026 National Indicators Report Contributions represents a pivotal moment where ground-level ecological assessment meets national-scale environmental monitoring. This comprehensive guide equips surveyors, ecologists, and agricultural professionals with the knowledge needed to contribute meaningful data that will define biodiversity standards for years to come.
Key Takeaways
- 🌾 Field to Market released an RFP on March 10, 2026 for expert authors to develop the biodiversity chapter of the 2026 National Indicators Report, with proposals due March 20, 2026[1]
- 📊 New biodiversity metrics are under assessment as part of the national reporting framework, requiring surveyor input to validate measurement approaches across diverse crop production systems
- 🔬 Advanced monitoring technologies including environmental DNA, acoustic monitoring, and image recognition are transforming how biodiversity is measured in agricultural landscapes[3]
- 🤝 Integration between farm-scale surveys and national indicators creates opportunities for surveyors to contribute data that influences U.S. agricultural policy and conservation priorities
- 📈 USDA data precision standards provide the foundation for crop production metrics, with coefficients of variation as low as 1.0-1.4% for major commodities[2]
Understanding the 2026 National Indicators Report Framework
The 2026 National Indicators Report represents a comprehensive evaluation of environmental outcomes across U.S. commodity agriculture. For the first time, biodiversity metrics will receive dedicated analysis alongside established indicators for soil conservation, water quality, and greenhouse gas emissions[1].
The Role of Biodiversity in Agricultural Sustainability
Biodiversity serves as a critical indicator of agricultural system health and resilience. Unlike single-metric assessments, biodiversity measurement captures the complex interactions between crop production and ecosystem function. The proposed new biodiversity metric under evaluation will assess:
- Species richness across different taxonomic groups
- Habitat quality within and adjacent to production areas
- Functional diversity supporting ecosystem services
- Genetic diversity within crop systems
- Landscape connectivity enabling species movement
This comprehensive approach aligns with emerging biodiversity net gain frameworks that require quantifiable improvements in ecological value.
Timeline and Submission Requirements
The compressed timeline for the 2026 biodiversity chapter development demands rapid mobilization of surveyor expertise. With proposals due just 10 days after the RFP release on March 20, 2026[1], successful contributors must demonstrate:
- Established methodologies for biodiversity assessment in agricultural contexts
- Data collection protocols compatible with national-scale reporting
- Statistical rigor matching USDA precision standards
- Scalability across diverse crop production systems
- Integration capacity with existing indicator frameworks
Crop Production Biodiversity Metrics: Survey Methodologies for National Reporting
Effective contribution to the Crop Production Biodiversity Metrics: Surveyor Guide to 2026 National Indicators Report Contributions requires understanding which survey methodologies produce data suitable for national aggregation.
Traditional Field Survey Approaches
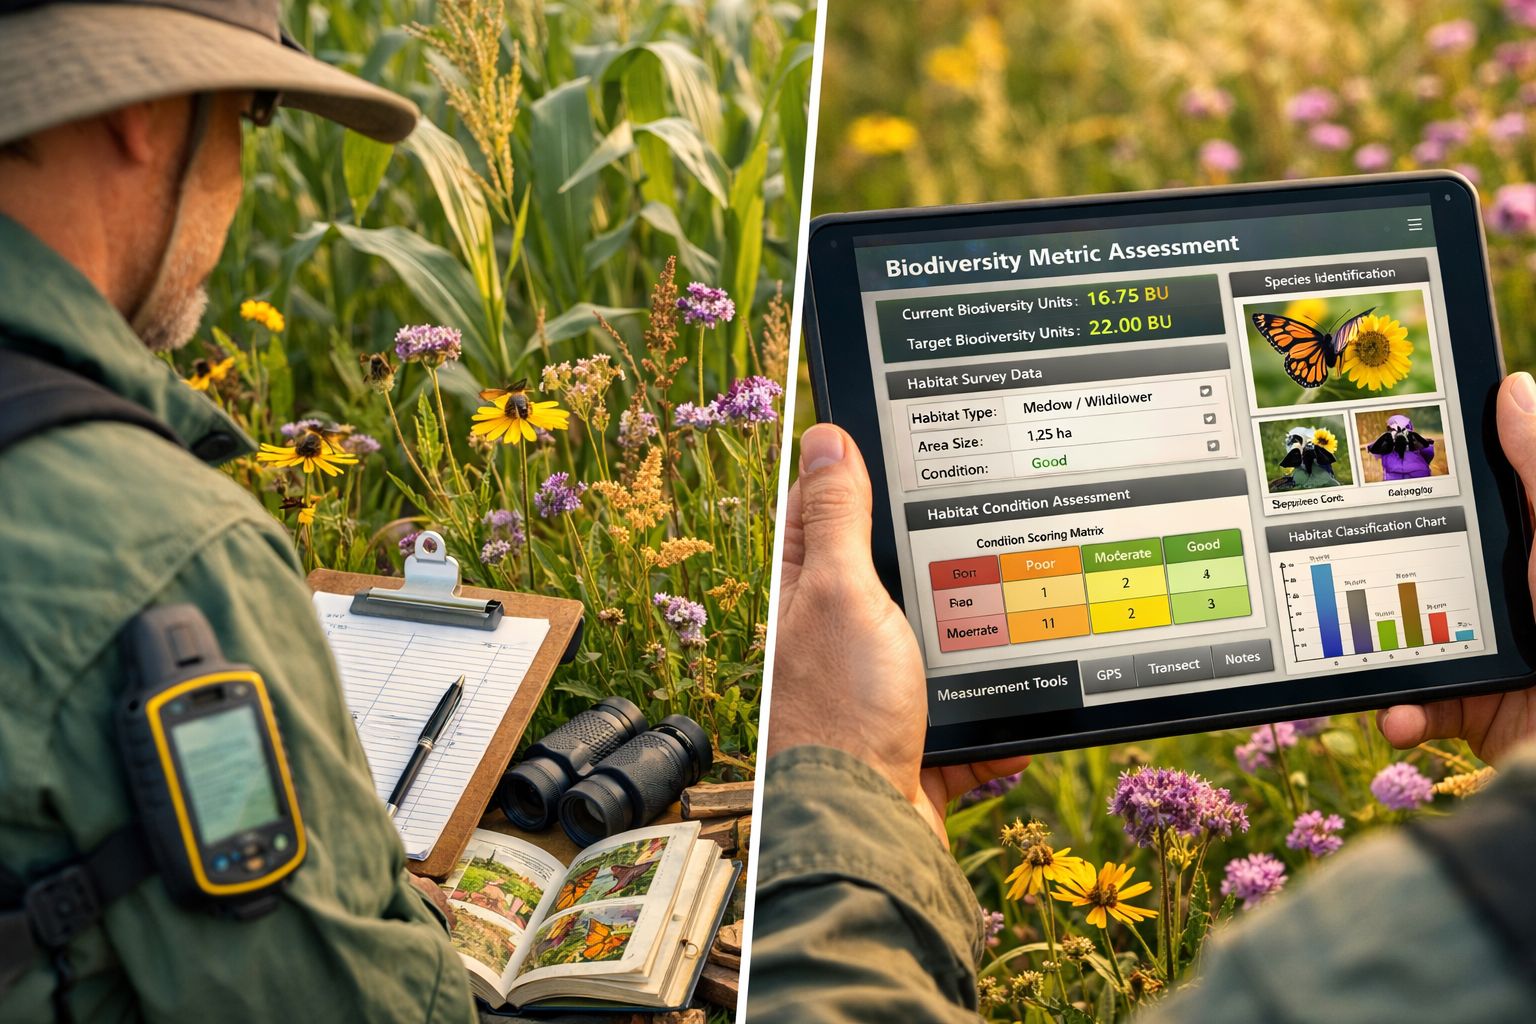
Habitat condition assessments remain foundational to biodiversity measurement. Surveyors evaluate:
- Vegetation structure and composition
- Presence of semi-natural habitats
- Field margin characteristics
- Water feature quality
- Soil health indicators
These assessments provide context for understanding how management practices influence biodiversity outcomes. The methodology mirrors approaches used in biodiversity impact assessments but scales to landscape-level analysis.
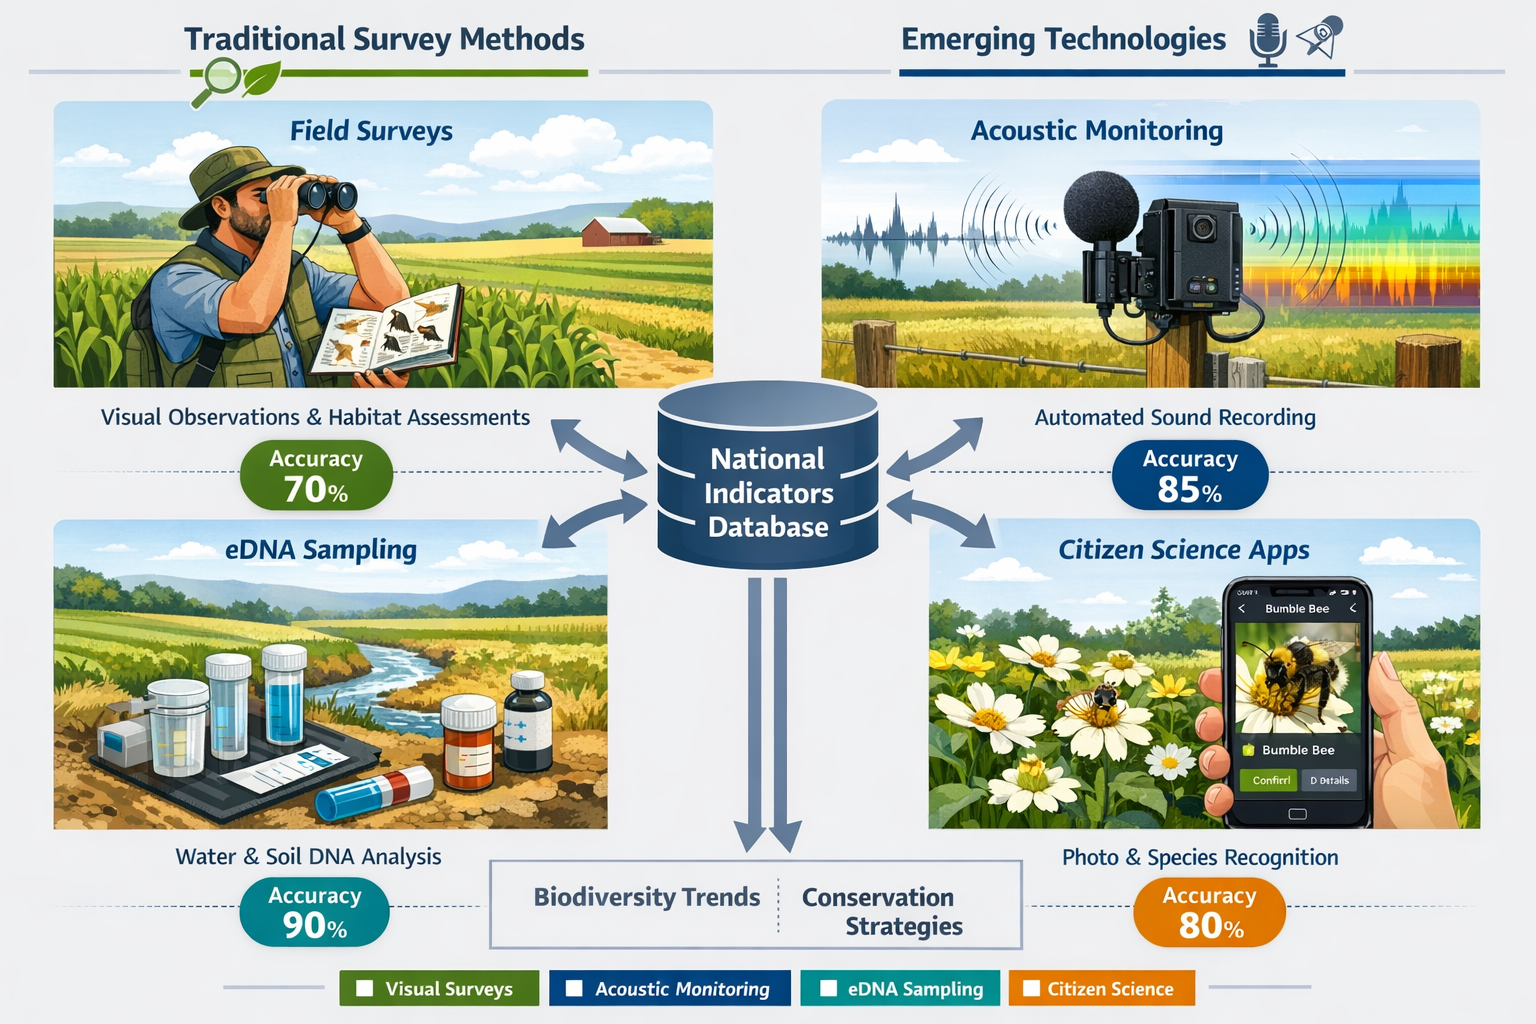
Emerging Technology Integration
Recent advances in biodiversity monitoring are rapidly changing assessment capabilities[3]. Key technologies include:
Environmental DNA (eDNA) Analysis 🧬
Water and soil samples reveal species presence without direct observation. NatureMetrics' 2026 guidance demonstrates how eDNA protocols can support nature-related financial disclosures[8], making this approach increasingly relevant for agricultural reporting.
Acoustic Monitoring 🔊
Automated recording devices capture bird, amphibian, and insect vocalizations across extended periods. This passive monitoring generates vast datasets suitable for trend analysis at regional and national scales.
Image Recognition Technology 📸
Machine learning algorithms identify species from photographs, enabling citizen science contributions and rapid species inventories. This democratization of biodiversity monitoring expands data collection capacity exponentially.
Remote Sensing Analysis 🛰️
Satellite and drone imagery assess habitat extent, quality, and connectivity across large agricultural landscapes, providing spatial context for ground-based surveys.
Data Quality and Precision Standards
The USDA National Agricultural Statistics Service establishes rigorous precision requirements for crop production data[2]. Biodiversity metrics must achieve comparable reliability to integrate effectively with existing indicators.
| Data Type | Precision Standard | Application |
|---|---|---|
| Crop acreage | CV 1.0-1.3% | Habitat extent baseline |
| Production volume | CV 1.0-1.4% | Management intensity proxy |
| Species counts | ±15% confidence | Population trend analysis |
| Habitat quality | Standardized scoring | Condition assessment |
Meeting these standards requires calibrated protocols, trained observers, and statistical validation of survey results.
Integrating Farm-Scale Surveys into National Biodiversity Indicators
The challenge facing surveyors contributing to the Crop Production Biodiversity Metrics: Surveyor Guide to 2026 National Indicators Report Contributions lies in translating site-specific observations into nationally meaningful indicators.
Stratification and Sampling Design
National-scale biodiversity assessment requires representative sampling across:
- Geographic regions (climate zones, ecoregions)
- Crop types (corn, soybeans, cotton, hay, specialty crops)
- Management systems (conventional, organic, regenerative)
- Farm sizes (small-scale to industrial operations)
- Landscape contexts (intensive agricultural areas vs. mixed-use landscapes)
Stratified random sampling ensures that survey effort captures the diversity of U.S. agricultural systems while maintaining statistical power for trend detection.
Metric Standardization and Comparability
For farm-scale data to contribute to national indicators, measurements must use standardized protocols that enable comparison across regions and years. Essential standardization elements include:
Temporal consistency 📅
Surveys conducted during comparable phenological periods ensure that seasonal variation doesn't confound trend analysis. Spring breeding bird surveys, for example, must occur within defined date ranges.
Spatial standardization 📏
Fixed survey areas (e.g., 1-hectare plots, 500-meter transects) enable density calculations and meaningful comparisons between sites.
Taxonomic resolution 🔍
Consistent species identification, whether to species, genus, or functional group level, ensures data compatibility across different surveyor teams.
Effort quantification ⏱️
Recording survey duration, area covered, and observer experience enables statistical correction for detection probability differences.
Linking to Biodiversity Net Gain Frameworks
The integration of biodiversity metrics into agricultural reporting creates synergies with biodiversity net gain requirements increasingly applied to development projects. Surveyors can leverage:
- Habitat classification systems used in BNG assessments
- Condition assessment criteria for habitat quality scoring
- Biodiversity unit calculations that quantify ecological value
- Monitoring protocols designed for long-term trend detection
This alignment enables surveyors to contribute simultaneously to agricultural sustainability reporting and regulatory compliance frameworks. Understanding how to achieve biodiversity net gain targets informs metric development for crop production systems.
Data Management and Reporting Systems
Effective contribution to national indicators requires robust data management infrastructure:
- Digital data collection using standardized forms and mobile applications
- Quality assurance protocols including validation checks and expert review
- Secure data storage with appropriate backup and version control
- Interoperable formats enabling integration with national databases
- Metadata documentation describing survey conditions and limitations
The IPBES Business and Biodiversity Assessment emphasizes that integrating biodiversity considerations into agrifood systems requires accessible, high-quality data[7].
Practical Strategies for Surveyors Contributing to the 2026 Report
Surveyors seeking to contribute meaningful data to the Crop Production Biodiversity Metrics: Surveyor Guide to 2026 National Indicators Report Contributions should implement these strategic approaches:
Building Partnerships with Agricultural Stakeholders
Farmer engagement 🤝
Successful biodiversity monitoring in crop production systems requires willing participation from landowners and operators. Surveyors should:
- Communicate clear value propositions for participation
- Minimize disruption to farm operations
- Share results that inform management decisions
- Respect privacy and data ownership concerns
- Provide recognition for conservation efforts
Industry collaboration 🏢
Partnerships with commodity groups, agricultural retailers, and sustainability initiatives expand survey capacity and ensure relevance to industry priorities. The 2026 Biologicals Survey demonstrates growing industry acceptance of environmental monitoring[5].
Developing Scalable Protocols
Protocols must balance scientific rigor with practical feasibility for widespread implementation:
Tiered assessment approaches
- Level 1: Rapid habitat screening (15-30 minutes per site)
- Level 2: Standard biodiversity survey (2-4 hours per site)
- Level 3: Intensive monitoring (multiple visits, specialized surveys)
This tiered structure enables resource allocation matching survey objectives while maintaining data compatibility across intensity levels.
Training and certification programs
Standardized training ensures consistent data quality across surveyor teams. The Field Studies Council's "Discovering the Biodiversity Metric" online course exemplifies accessible professional development[6].
Leveraging Technology for Efficiency
Modern survey tools dramatically increase efficiency:
- Mobile apps with built-in species identification and GPS integration
- Automated sensors reducing labor requirements for continuous monitoring
- Cloud-based platforms enabling real-time data submission and validation
- AI-assisted analysis accelerating data processing and pattern recognition
These technologies make participation in national monitoring programs feasible for surveyors with limited resources.
Contributing to Metric Validation
The assessment of proposed new biodiversity metrics[1] requires field validation across diverse conditions. Surveyors contribute by:
- Testing metric sensitivity to management changes
- Evaluating practical feasibility of data collection requirements
- Comparing results across different assessment methods
- Documenting limitations and sources of uncertainty
- Recommending refinements based on field experience
This feedback loop ensures that adopted metrics reflect on-the-ground realities of agricultural biodiversity assessment.
Policy Implications and Future Directions
The 2026 National Indicators Report biodiversity chapter will influence agricultural policy, conservation program design, and sustainability standards for years to come.
Informing Conservation Program Design
Federal conservation programs including the Environmental Quality Incentives Program (EQIP) and Conservation Reserve Program (CRP) rely on indicator data to:
- Target funding to priority areas
- Evaluate program effectiveness
- Adjust practice standards
- Demonstrate environmental outcomes
Robust biodiversity metrics enable evidence-based program refinement that maximizes conservation return on investment.
Supporting Sustainable Agriculture Certification
Market-based sustainability initiatives increasingly require biodiversity performance documentation. The Field to Market framework influences:
- Supply chain sustainability requirements
- Corporate environmental commitments
- Consumer labeling programs
- Investment decisions related to agricultural assets
Standardized national indicators provide credible benchmarks for these voluntary programs, as discussed in guidance for biodiversity credits for developers.
Advancing Scientific Understanding
Comprehensive national biodiversity data enables research addressing critical questions:
- How do specific management practices affect biodiversity outcomes?
- What landscape configurations optimize both production and conservation?
- How is agricultural biodiversity responding to climate change?
- Which interventions provide greatest biodiversity benefits per dollar invested?
The scientific literature emphasizes that as biodiversity protection goals expand, impact assessments must evolve to guide conservation efforts[4].
International Reporting Obligations
U.S. biodiversity data contributes to international commitments including:
- Convention on Biological Diversity targets and reporting
- Sustainable Development Goals progress tracking
- Climate and biodiversity nexus analysis
- Trade and sustainability negotiations
National indicators provide the evidence base for demonstrating U.S. leadership in agricultural sustainability.
Overcoming Implementation Challenges
Despite the clear value of comprehensive biodiversity monitoring, significant challenges remain:
Resource Constraints
Funding limitations 💰
Biodiversity surveys require sustained investment in personnel, equipment, and data management infrastructure. Creative funding mechanisms include:
- Cost-sharing with conservation programs
- Integration with existing monitoring efforts
- Leveraging citizen science contributions
- Public-private partnerships
Methodological Complexity
Taxonomic expertise requirements 🔬
Accurate species identification demands specialized knowledge that is increasingly scarce. Solutions include:
- Focus on indicator taxa requiring less specialized expertise
- Investment in taxonomist training and retention
- Technology-assisted identification tools
- Partnerships with academic institutions and natural history museums
Landowner Access
Permission and privacy concerns 🚧
Accessing private agricultural land for surveys requires building trust and demonstrating value. Strategies include:
- Clear data use agreements protecting landowner interests
- Aggregated reporting that maintains anonymity
- Direct benefits to participating landowners
- Industry champion advocacy
Data Integration Complexity
Technical interoperability 💻
Combining data from diverse sources and methodologies presents substantial technical challenges. Essential elements include:
- Standardized data formats and taxonomies
- Comprehensive metadata documentation
- Statistical methods accounting for methodological differences
- Transparent uncertainty quantification
Conclusion
The Crop Production Biodiversity Metrics: Surveyor Guide to 2026 National Indicators Report Contributions represents more than a technical exercise in environmental monitoring—it embodies a fundamental shift toward evidence-based agricultural sustainability. As Field to Market develops the biodiversity chapter for the 2026 National Indicators Report, ecological surveyors have an unprecedented opportunity to shape how the United States measures and manages biodiversity across its vast agricultural landscape.
The integration of farm-scale surveys into national reporting frameworks requires methodological rigor, technological innovation, stakeholder collaboration, and sustained commitment. Surveyors who contribute to this effort will help establish biodiversity metrics that influence conservation policy, guide management practices, and demonstrate agriculture's environmental stewardship for years to come.
Actionable Next Steps
For surveyors and ecological professionals ready to contribute:
- Review the Field to Market RFP and consider submitting a proposal before the March 20, 2026 deadline[1]
- Invest in training on standardized biodiversity assessment methodologies and emerging monitoring technologies
- Build partnerships with agricultural stakeholders, conservation organizations, and research institutions
- Pilot test protocols on diverse farm types to validate feasibility and identify refinements
- Engage with policy processes to ensure surveyor perspectives inform indicator development
- Participate in professional networks sharing best practices and lessons learned
- Explore biodiversity net gain opportunities that complement national monitoring efforts
The success of agricultural biodiversity monitoring depends on the collective expertise, dedication, and innovation of the surveyor community. By contributing high-quality data and practical insights, surveyors ensure that biodiversity metrics reflect the complexity of real-world agricultural systems while maintaining the scientific rigor necessary for national-scale reporting.
The 2026 National Indicators Report biodiversity chapter will stand as a testament to what's possible when ground-level observation meets national-scale vision. The time to contribute is now.
References
[1] Request For Proposals – https://www.sciencesocieties.org/publications/csa-news/2026/april/request-for-proposals
[2] Cranqm26 – https://www.nass.usda.gov/Publications/Methodology_and_Data_Quality/Crop_Production/02_2026/cranqm26.pdf
[3] Pnas – https://www.pnas.org/doi/10.1073/pnas.2519345123
[4] Facets 2025 0424 – https://www.facetsjournal.com/doi/10.1139/facets-2025-0424
[5] Inside The Ag Retailers Guide To Biologicals 2026 Market Trends Challenges And Opportunities – https://www.croplife.com/special-reports/biologicals/inside-the-ag-retailers-guide-to-biologicals-2026-market-trends-challenges-and-opportunities/
[6] Discovering The Biodiversity Metric Online 2026 – https://www.field-studies-council.org/shop/courses/discovering-the-biodiversity-metric-online-2026/
[7] Media Release – https://www.ipbes.net/bba-report/media-release
[8] Whitepapers Guides – https://www.naturemetrics.com/whitepapers-guides
