
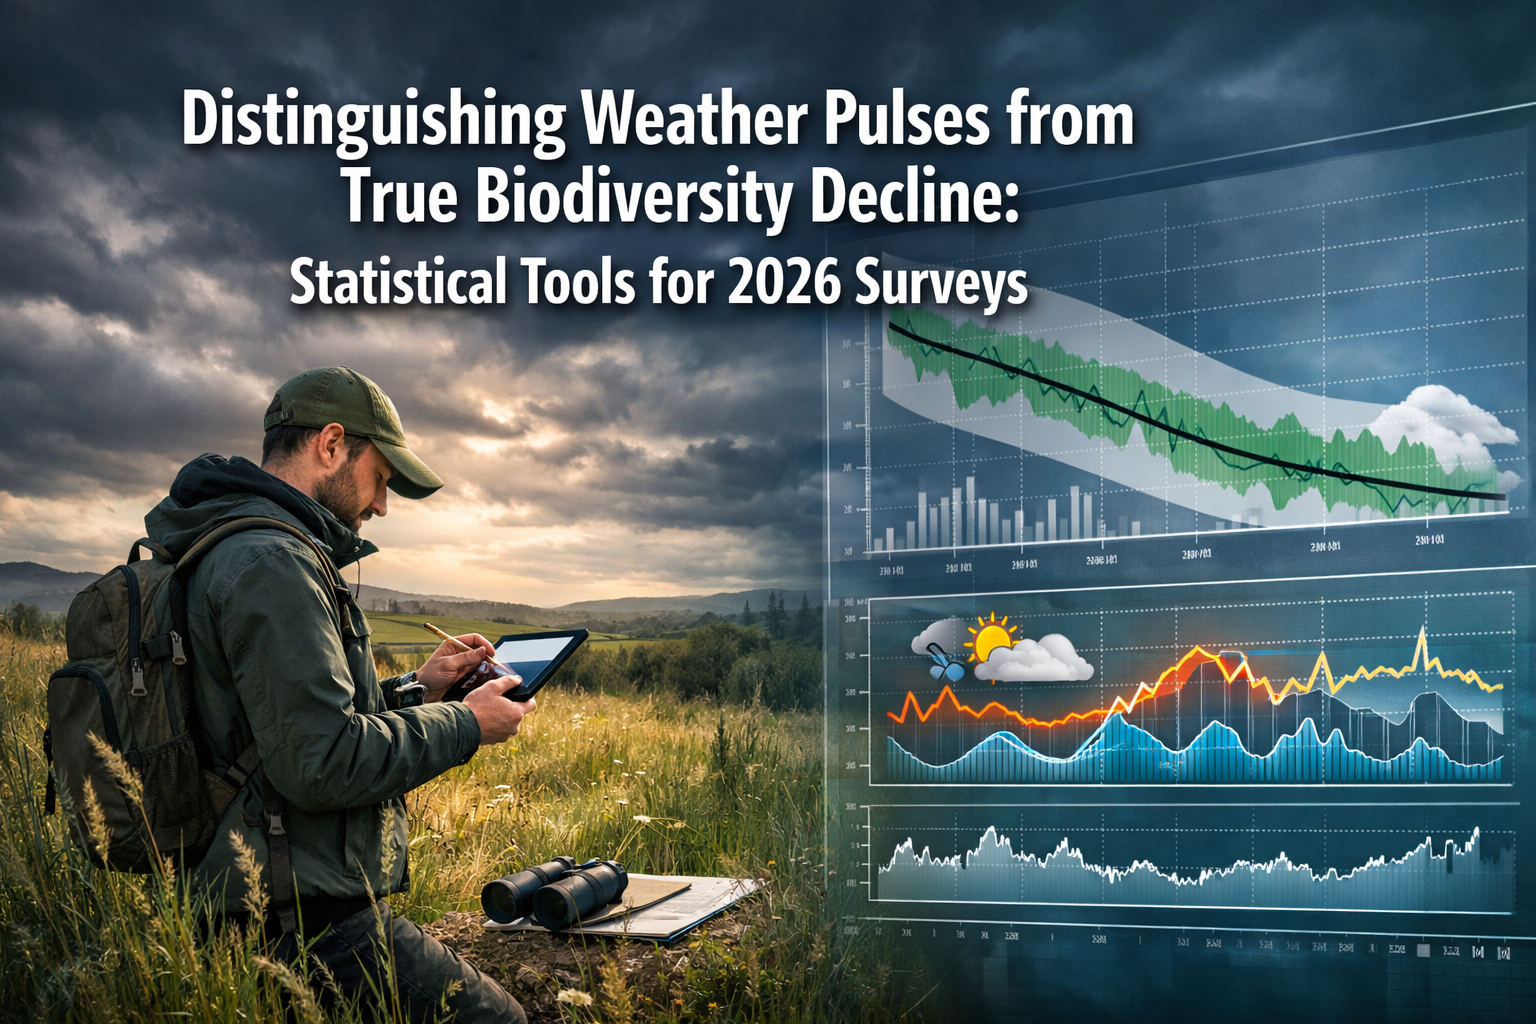
When biodiversity counts drop dramatically between survey periods, the critical question emerges: Is this a temporary weather-driven fluctuation or the beginning of a genuine ecological collapse? For surveyors working in 2026, distinguishing weather pulses from true biodiversity decline has never been more essential—or more challenging. With climate variability increasing and conservation budgets tightening, the ability to separate seasonal noise from long-term signals determines whether interventions happen in time or resources get wasted chasing statistical shadows.
This guide explores the statistical tools for 2026 surveys that empower biodiversity professionals to make confident, data-driven decisions. Understanding these methods transforms raw field observations into actionable conservation intelligence.
Key Takeaways
- Weather pulses create temporary population fluctuations that can mask or mimic genuine biodiversity decline, requiring specialized statistical approaches to separate short-term variation from long-term trends
- Multi-season monitoring frameworks spanning 12-24 months provide the temporal depth necessary to distinguish climatic effects from true ecological degradation
- Advanced statistical tools including GAMs, BACI designs, state-space models, and Bayesian hierarchical approaches offer robust methods for controlling weather covariates in biodiversity assessments
- Integration with biodiversity net gain planning ensures that survey data accurately reflects baseline conditions rather than weather-influenced anomalies
- Standardized protocols and quality control measures improve the reliability of trend detection and support defensible conservation decisions in 2026
Understanding Weather Pulses vs. True Biodiversity Decline 🌦️
What Are Weather Pulses?
Weather pulses represent short-term environmental fluctuations that temporarily alter species abundance, detectability, or activity patterns without causing permanent population changes. These pulses can include:
- Drought events that concentrate species around remaining water sources or suppress insect emergence
- Heavy rainfall periods that reduce flying insect activity or increase amphibian breeding success
- Unseasonable temperature extremes that delay migration timing or alter flowering phenology
- Storm events that temporarily displace mobile species or damage habitat structure
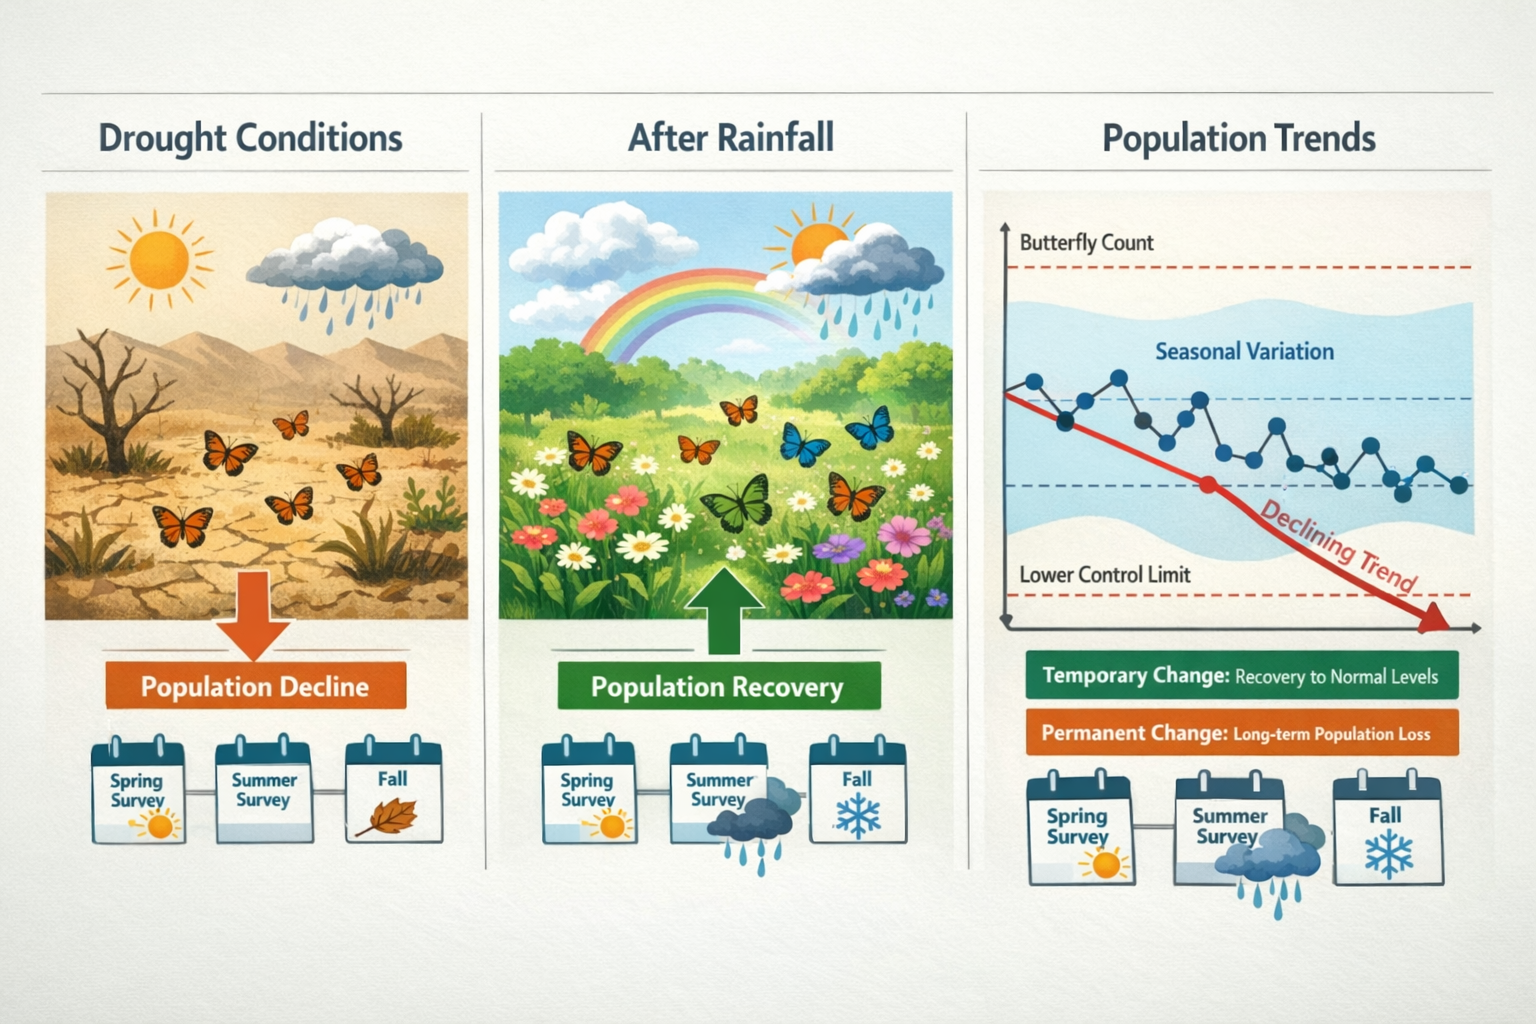
A classic example occurs with butterfly surveys: a cold, wet spring may suppress adult emergence and flight activity, producing counts 60-80% below typical values. Yet the population remains viable, with numbers rebounding once favorable conditions return. Without proper statistical context, this weather pulse could be misinterpreted as catastrophic decline requiring immediate intervention.
Characteristics of True Biodiversity Decline
In contrast, genuine biodiversity decline exhibits distinct patterns that persist across multiple survey periods and weather conditions:
| Weather Pulse | True Decline |
|---|---|
| Rapid population drop followed by recovery | Sustained directional trend downward |
| Correlated with specific weather events | Independent of short-term weather variation |
| Affects detection/activity more than survival | Reflects actual mortality or reproductive failure |
| Reversed within 1-2 seasons | Continues across multiple years |
| Similar magnitude across weather-sensitive species | Selective impacts on vulnerable taxa |
True decline typically results from habitat degradation, invasive species, pollution, disease, or other persistent stressors. These factors compound over time rather than fluctuating with seasonal weather patterns. Recognizing this distinction is fundamental when conducting biodiversity impact assessments for development projects.
Why This Distinction Matters in 2026
The stakes for accurate trend interpretation have escalated significantly. With Biodiversity Net Gain (BNG) requirements now mandatory across England, baseline surveys directly influence compensation calculations and legal obligations. A weather-suppressed baseline could inflate apparent gains, while a weather-enhanced baseline might trigger unnecessary mitigation costs.
Furthermore, conservation triage decisions increasingly rely on robust trend data. Misidentifying a weather pulse as decline could divert limited resources from genuinely threatened populations, while dismissing real decline as weather noise allows preventable extinctions to proceed unchecked.
Statistical Tools for Distinguishing Weather Pulses from True Biodiversity Decline: Statistical Tools for 2026 Surveys 📊
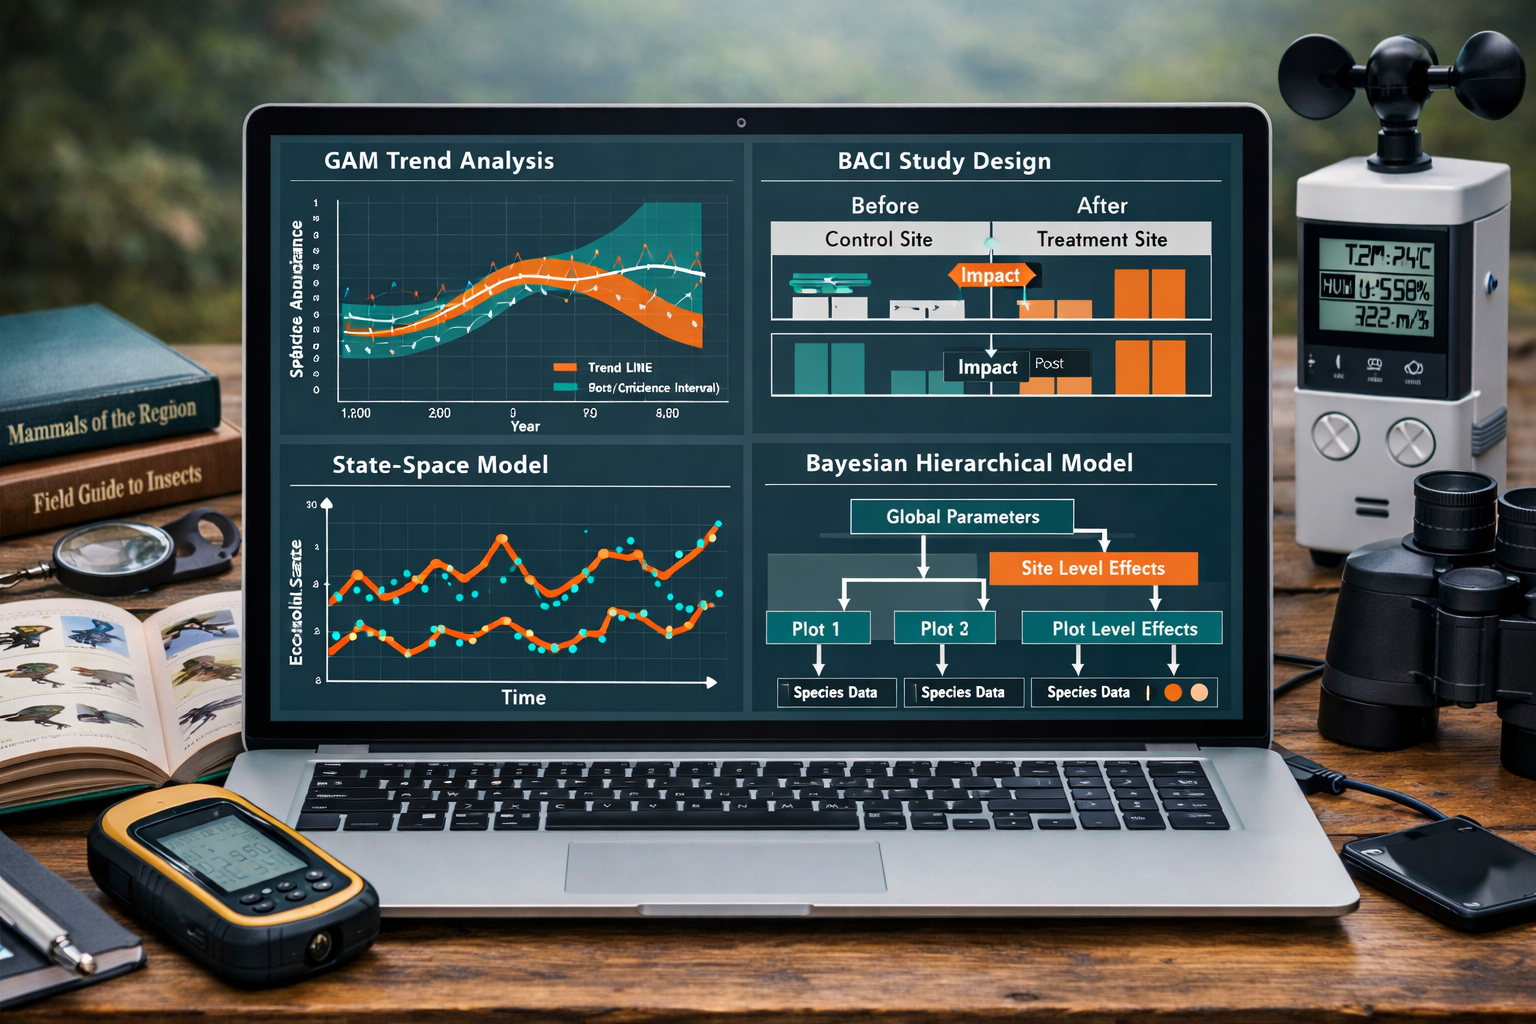
Generalized Additive Models (GAMs)
Generalized Additive Models provide flexible frameworks for separating smooth long-term trends from short-term weather effects. GAMs use non-parametric smoothing functions to model complex ecological relationships without assuming linear trends.
Key advantages for biodiversity surveys:
- Flexible trend estimation that captures non-linear population trajectories
- Weather covariate integration allowing temperature, precipitation, and other variables to be modeled simultaneously
- Smooth function visualization making trends interpretable for non-statisticians
- Robust to outliers caused by extreme weather events
Practical application: A GAM might model bird abundance as a smooth function of time (capturing the underlying trend) plus parametric effects of temperature and rainfall (capturing weather pulses). The smooth trend component reveals whether populations are genuinely declining after accounting for weather variation.
Implementation considerations: GAMs require sufficient temporal data points (typically 15+ survey occasions) and careful selection of smoothing parameters to avoid overfitting. Software packages like R's mgcv library provide accessible tools for biodiversity professionals.
Before-After-Control-Impact (BACI) Designs
BACI designs compare biodiversity changes at impact sites against reference control sites, both before and after interventions or disturbances. This approach is particularly powerful for distinguishing weather pulses from site-specific decline.
Core principle: Weather pulses affect both impact and control sites simultaneously, while true decline at the impact site produces divergent trends between locations.
Design requirements:
- Control sites matched to impact sites for habitat type, landscape context, and weather exposure
- Multiple baseline surveys before the intervention or suspected decline begins
- Continued monitoring through the impact period
- Replicated sites to account for spatial variation
Statistical analysis: BACI analyses typically use mixed-effects models or repeated-measures ANOVA to test for significant interaction between time period (before/after) and site type (impact/control). A significant interaction indicates site-specific change beyond regional weather effects.
This approach aligns well with biodiversity net gain planning, where pre-development baselines must be distinguished from post-development impacts while controlling for regional environmental variation.
State-Space Models
State-space models separate the true underlying ecological state from imperfect observations, explicitly accounting for observation error and process variation. This dual-layer approach is ideal for biodiversity surveys where detection probability varies with weather conditions.
Model structure:
- State equation: Describes how the true population changes over time due to ecological processes
- Observation equation: Links the observed counts to the true state, incorporating detection probability influenced by weather
Benefits for weather pulse separation:
- Partitions variation into biological process (true trends) versus observation error (weather-affected detectability)
- Estimates true abundance even when weather reduces detection rates
- Forecasts future states with uncertainty quantification
- Handles missing data gracefully when weather prevents surveys
Example application: Amphibian call surveys during breeding season are heavily weather-dependent. State-space models can estimate true population trends while accounting for nights when cold temperatures suppress calling activity, preventing weather-induced false declines.
Bayesian Hierarchical Models
Bayesian hierarchical models provide comprehensive frameworks for integrating multiple sources of variation—including weather covariates, spatial effects, temporal autocorrelation, and observation processes—within a unified probabilistic structure.
Key features for 2026 biodiversity surveys:
- Explicit uncertainty quantification through posterior probability distributions
- Integration of prior knowledge from historical surveys or expert judgment
- Flexible covariate structures accommodating complex weather interactions
- Missing data imputation when weather prevents complete survey coverage
- Multi-species models that borrow strength across taxa
Weather covariate integration: Hierarchical models can include weather variables at multiple levels—daily conditions affecting detectability, seasonal patterns influencing phenology, and annual climate trends driving population dynamics.
Practical implementation: Software like JAGS, Stan, or NIMBLE enables Bayesian analysis, though computational demands may require specialist support. The investment yields robust trend estimates with well-calibrated uncertainty intervals essential for conservation decision-making.
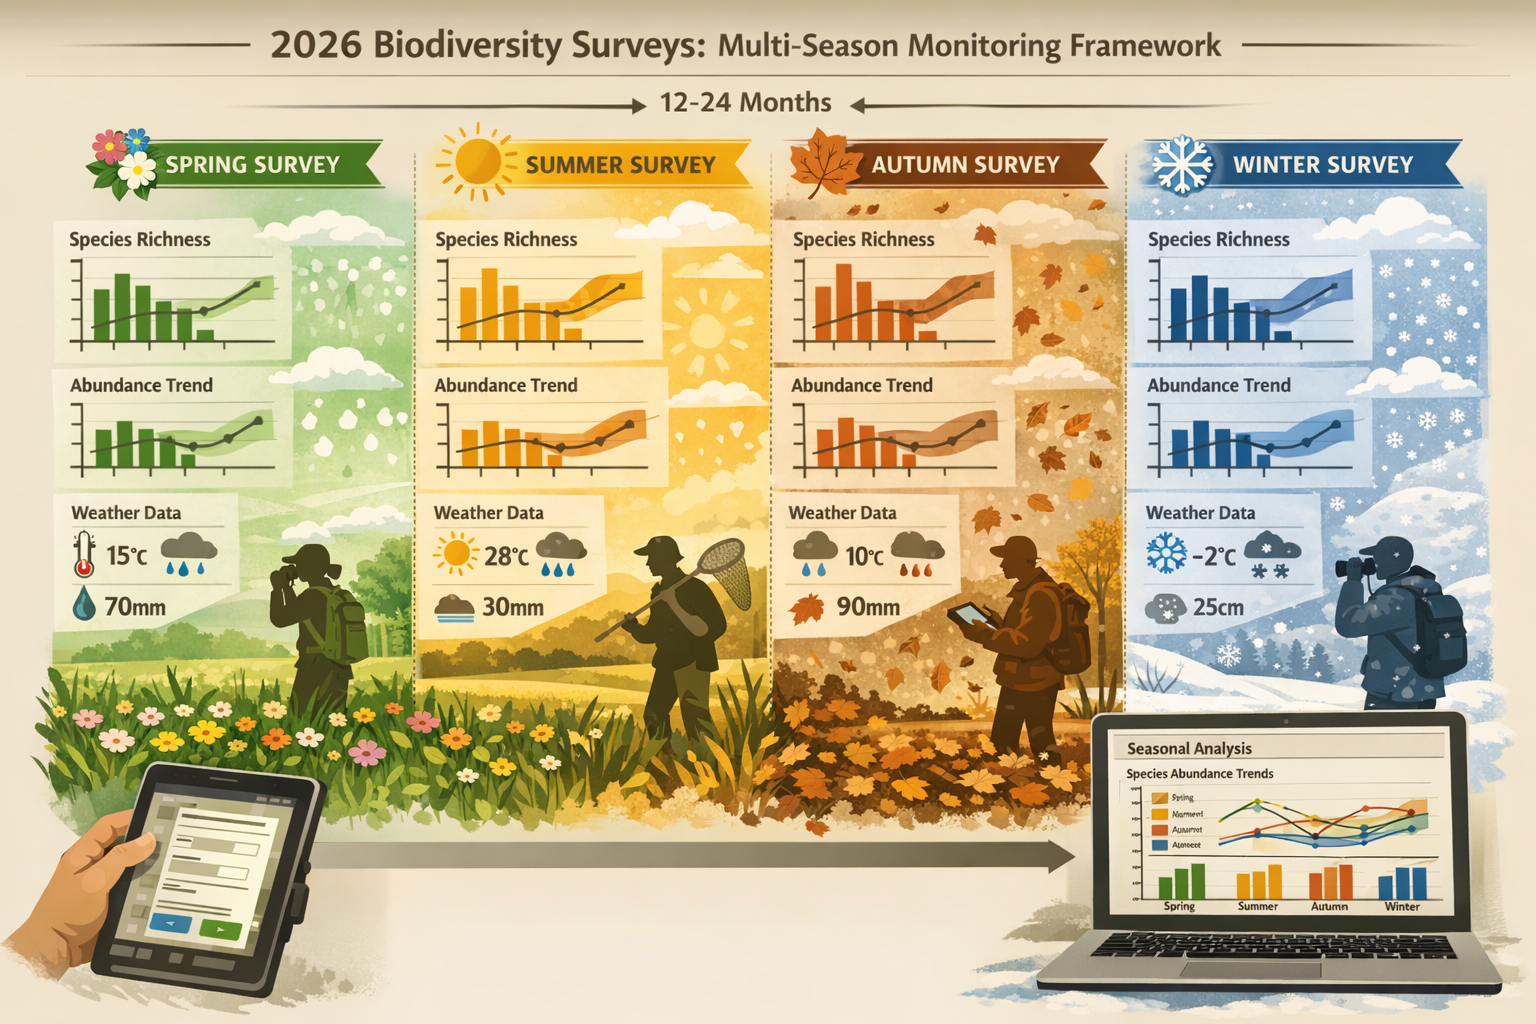
Implementing Multi-Season Monitoring Frameworks for 2026 Surveys 📅
The Case for Extended Temporal Coverage
Single-season surveys cannot reliably distinguish weather pulses from true decline. Multi-season monitoring frameworks spanning 12-24 months provide the temporal replication necessary to separate signal from noise.
Minimum recommended frameworks:
- Breeding bird surveys: 2-3 breeding seasons plus winter surveys
- Butterfly transects: 2 full flight seasons (April-September)
- Amphibian monitoring: 2 breeding seasons plus summer activity surveys
- Plant communities: Spring, summer, and autumn surveys across 2 years
- Bat activity surveys: 2 active seasons (April-October) with hibernation checks
This extended coverage captures natural population fluctuations, weather-driven variation, and sufficient data points for robust statistical analysis. When planning biodiversity net gain projects, this temporal investment in baseline data prevents costly errors in impact prediction and compensation design.
Incorporating Weather Data Collection
Effective weather pulse separation requires parallel collection of meteorological data alongside biodiversity surveys:
Essential weather variables:
- Temperature (daily min/max, survey-time conditions)
- Precipitation (daily totals, antecedent 7-30 day accumulation)
- Wind speed (particularly for flying insects and birds)
- Cloud cover (affecting detectability and activity)
- Phenological indicators (first flowering dates, leaf emergence)
Data sources:
- On-site weather stations providing precise local conditions
- Nearby meteorological stations (within 10km) for gap-filling
- Gridded climate datasets (e.g., Met Office data) for regional context
- Remote sensing products for vegetation indices and soil moisture
Integration protocols: Record weather conditions at each survey occasion and compile daily/weekly summaries for statistical modeling. This creates the covariate data necessary for GAMs, hierarchical models, and other analytical approaches.
Quality Control and Standardization
Standardized survey protocols minimize observer-induced variation that could confound weather effects:
- Fixed survey routes and plot locations ensuring spatial consistency
- Consistent timing windows (time of day, season) reducing temporal bias
- Observer training and calibration maintaining detection consistency
- Equipment standardization for acoustic surveys, camera traps, etc.
- Data validation procedures catching transcription errors and outliers
Documentation requirements: Maintain detailed metadata including observer identity, survey conditions, deviations from protocol, and any unusual observations. This contextual information proves invaluable when interpreting apparent anomalies during analysis.
Adaptive Monitoring Strategies
Adaptive frameworks allow survey intensity to adjust based on emerging patterns:
Trigger-based intensification: If initial surveys suggest possible decline, increase survey frequency or spatial coverage to improve statistical power and trend certainty.
Weather-contingent scheduling: Build flexibility to reschedule surveys when extreme weather would compromise data quality, while maintaining overall seasonal coverage.
Integrated decision frameworks: Use preliminary statistical analyses after year 1 to refine survey design for year 2, optimizing resource allocation based on observed variation patterns.
This adaptive approach aligns with the broader biodiversity net gain strategy, where monitoring plans evolve based on management effectiveness and ecological responses.
Practical Applications in 2026 Conservation Planning 🛠️
Integration with Biodiversity Net Gain Assessments
BNG baseline surveys must accurately represent site conditions rather than weather anomalies. Statistical tools for weather pulse separation ensure that:
- Habitat condition scores reflect genuine ecological quality, not drought-stressed vegetation
- Species abundance estimates account for weather-suppressed detectability
- Trend assessments distinguish declining populations from weather-driven fluctuations
- Compensation calculations are based on robust, weather-adjusted baselines
When creating biodiversity plans for development projects, incorporating multi-season data with statistical weather controls provides defensible baselines that withstand regulatory scrutiny and legal challenge.
Case Study Framework: Grassland Butterfly Monitoring
Consider a development site with important grassland butterfly populations. Initial summer 2025 surveys show 40% lower counts than historical records, raising decline concerns.
Statistical investigation approach:
- Extended monitoring: Conduct surveys through summer 2026, capturing two flight seasons
- Weather data compilation: Gather temperature and rainfall data for both survey years plus 5 previous years
- GAM analysis: Model butterfly abundance as smooth function of time, with temperature and rainfall covariates
- Result interpretation: Analysis reveals 2025 was exceptionally cool and wet, suppressing flight activity. Weather-adjusted trend shows stable population with no genuine decline.
Outcome: Development proceeds with standard BNG mitigation rather than enhanced protection triggered by false decline signal. Statistical rigor saves unnecessary costs while ensuring genuine conservation needs are met.
Decision Trees for Survey Design
Selecting appropriate statistical approaches:
Survey objective → Data characteristics → Recommended approach

Trend detection + Weather varies → GAM with weather covariates
Impact assessment + Control sites available → BACI design
Detection varies with weather → State-space model
Multiple species + Complex variation → Bayesian hierarchical model
Limited data + Simple question → Generalized linear model with weather terms
This decision framework helps surveyors match analytical tools to specific project requirements and data constraints.
Communicating Results to Stakeholders
Effective communication translates complex statistical findings into actionable conservation decisions:
- Visual presentations: Show raw data alongside weather-adjusted trends with confidence intervals
- Plain language summaries: Explain findings without statistical jargon
- Uncertainty quantification: Clearly state confidence levels and alternative interpretations
- Management implications: Link statistical conclusions to specific conservation actions or BNG requirements
When working with developers and planners on biodiversity net gain, clear communication of weather-corrected trends builds trust and supports collaborative conservation outcomes.
Advanced Considerations and Emerging Tools 🔬
Machine Learning Approaches
Machine learning algorithms offer promising tools for pattern recognition in complex biodiversity datasets:
- Random forests for identifying non-linear weather-biodiversity relationships
- Neural networks for predicting species occurrence under varying weather conditions
- Clustering algorithms for detecting regime shifts versus temporary fluctuations
- Ensemble methods combining multiple models for robust predictions
Caution: Machine learning requires large datasets and careful validation to avoid overfitting. Traditional statistical approaches often provide more interpretable results for typical survey scales.
Remote Sensing Integration
Satellite and drone imagery complement field surveys by providing continuous environmental monitoring:
- Vegetation indices (NDVI, EVI) tracking habitat condition between surveys
- Thermal imagery detecting drought stress or microclimate variation
- Phenology tracking documenting seasonal progression and weather impacts
- Habitat mapping providing spatial context for biodiversity patterns
Integration potential: Use remote sensing to identify weather-driven habitat changes that explain biodiversity fluctuations, strengthening causal inference in trend analyses.
Citizen Science and Automated Monitoring
Expanded data collection through citizen science networks and automated sensors increases temporal coverage:
- Acoustic monitors recording continuously across seasons and weather conditions
- Camera traps documenting wildlife activity patterns relative to weather
- Citizen science platforms (iNaturalist, eBird) providing regional context
- Environmental DNA sampling across weather gradients
Statistical opportunities: Large-scale automated data enables sophisticated hierarchical models that partition weather effects from underlying trends across broad spatial and temporal scales.
Climate Change Considerations
Distinguishing weather pulses from climate-driven trends requires additional analytical nuance:
- Trend decomposition: Separate short-term weather variation, multi-year climate cycles, and long-term climate change signals
- Non-stationarity: Recognize that weather-biodiversity relationships may shift as climate changes
- Threshold effects: Detect when weather extremes cross critical ecological thresholds
- Attribution analysis: Distinguish climate-driven decline from other stressors
As climate variability intensifies through 2026 and beyond, these considerations become increasingly critical for accurate biodiversity assessment.
Conclusion: Building Robust Biodiversity Assessments for 2026
Distinguishing weather pulses from true biodiversity decline represents a fundamental challenge for ecological surveyors in 2026. The statistical tools and monitoring frameworks outlined in this guide provide the analytical foundation for confident, defensible trend interpretation. By implementing multi-season monitoring, integrating weather covariates, and applying appropriate statistical models, biodiversity professionals can separate temporary environmental fluctuations from genuine conservation crises.
Key implementation steps:
- Design extended monitoring programs spanning multiple seasons and years to capture natural variation
- Collect parallel weather data alongside biodiversity surveys to enable statistical control
- Select appropriate analytical tools matched to survey objectives and data characteristics
- Apply robust statistical methods including GAMs, BACI designs, state-space models, or Bayesian approaches
- Communicate findings clearly to stakeholders with explicit uncertainty quantification
- Integrate with BNG planning ensuring baselines reflect genuine conditions rather than weather anomalies
The investment in rigorous statistical approaches pays dividends through improved conservation outcomes, defensible regulatory compliance, and efficient resource allocation. As biodiversity loss accelerates and climate variability intensifies, the ability to distinguish signal from noise becomes not just a technical skill but a conservation imperative.
For surveyors, developers, and land managers navigating biodiversity net gain requirements in 2026, these statistical tools transform uncertainty into actionable intelligence. The ecological patterns revealed through weather-adjusted analyses guide where intervention is urgently needed—and where patience and continued monitoring are the wisest course.
By embracing these advanced methodologies, the biodiversity surveying community can deliver the high-quality data that conservation in 2026 demands: precise, weather-corrected, and statistically robust assessments that separate temporary pulses from permanent losses.
