
More than 80% of the UK population now lives in urban areas, yet these concrete jungles harbor surprising pockets of ecological value that could unlock millions in biodiversity credits. Since mandatory Biodiversity Net Gain (BNG) requirements took effect in February 2024, city ecologists face an unprecedented challenge: identifying, quantifying, and enhancing urban biodiversity hotspots while navigating the complexities of human-impacted environments. Understanding Urban Biodiversity Hotspots for Net Gain Compliance: Survey Strategies for City Ecologists in 2026 has become essential for professionals working at the intersection of urban development and ecological restoration.
The landscape has shifted dramatically. Every in-scope planning application must now demonstrate a 10% biodiversity net gain, secured through a 30-year legal commitment[1]. For urban developments, where space is at a premium and baseline habitats are fragmented, this requirement demands innovative survey approaches and strategic identification of enhancement opportunities. This article explores practical, scalable strategies that city ecologists can implement to meet compliance requirements while delivering genuine ecological value.
Key Takeaways
- Mandatory 10% net gain applies to all in-scope urban developments since February 2024, requiring 30-year legal commitments for biodiversity improvements[1]
- Urban green corridors represent the most valuable biodiversity assets in cities, connecting fragmented habitats and maximizing ecological functionality
- Technology integration through survey apps, drone mapping, and citizen science platforms enables scalable, cost-effective urban biodiversity assessment
- Three-tier hierarchy mandates on-site enhancement first, followed by off-site units or statutory credits as last resort[1]
- Baseline assessment challenges in urban areas require specialized protocols accounting for human disturbance, invasive species, and habitat fragmentation[2]
Understanding Urban Biodiversity Hotspots in the BNG Context
What Defines an Urban Biodiversity Hotspot?
Urban biodiversity hotspots are not simply green spaces within cities. They represent ecologically functional areas that support disproportionately high species richness, provide critical habitat connectivity, or maintain rare urban ecosystems. These can include:
- 🌳 Linear green corridors (railway embankments, canal towpaths, street tree networks)
- 🦋 Brownfield sites with pioneer species and rare invertebrates
- 💧 Blue infrastructure (urban ponds, sustainable drainage systems, river corridors)
- 🏢 Green roofs and walls on commercial buildings
- 🌾 Pocket parks and community gardens with native planting
- 🌿 Churchyards and cemeteries with undisturbed grasslands
The Biodiversity Net Gain framework requires these spaces to be assessed using the Statutory Biodiversity Metric, which calculates habitat value through multipliers based on distinctiveness, condition, and strategic significance[4]. Understanding which urban spaces deliver the highest biodiversity units is crucial for compliance.
The Urban Challenge: Space Constraints and Fragmentation
Lack of available space represents the primary implementation challenge for urban BNG compliance[2]. Cities are densely packed with land already allocated for housing, infrastructure, and commercial uses. This creates several specific obstacles:
| Challenge | Impact on BNG Compliance | Survey Implication |
|---|---|---|
| Limited on-site space | Forces reliance on off-site solutions | Prioritize identification of nearby enhancement sites |
| Habitat fragmentation | Reduces ecological functionality | Emphasize connectivity assessment in surveys |
| High land values | Increases cost of biodiversity units | Focus on maximizing value of existing assets |
| Complex ownership | Complicates 30-year management agreements | Requires detailed stakeholder mapping |
| Human disturbance | Affects baseline condition scores | Necessitates specialized disturbance protocols |
For developers and planners working in urban contexts, understanding these constraints is essential. Our guide on achieving 10% biodiversity net gain provides additional context on navigating these challenges.
Survey Strategies for Urban Biodiversity Hotspots for Net Gain Compliance: Survey Strategies for City Ecologists in 2026
Establishing Baseline Conditions in Human-Impacted Sites
Baseline biodiversity assessment in urban environments is particularly challenging due to fragmented ecosystems and lack of undisturbed habitats[2]. City ecologists must develop specialized protocols that account for:
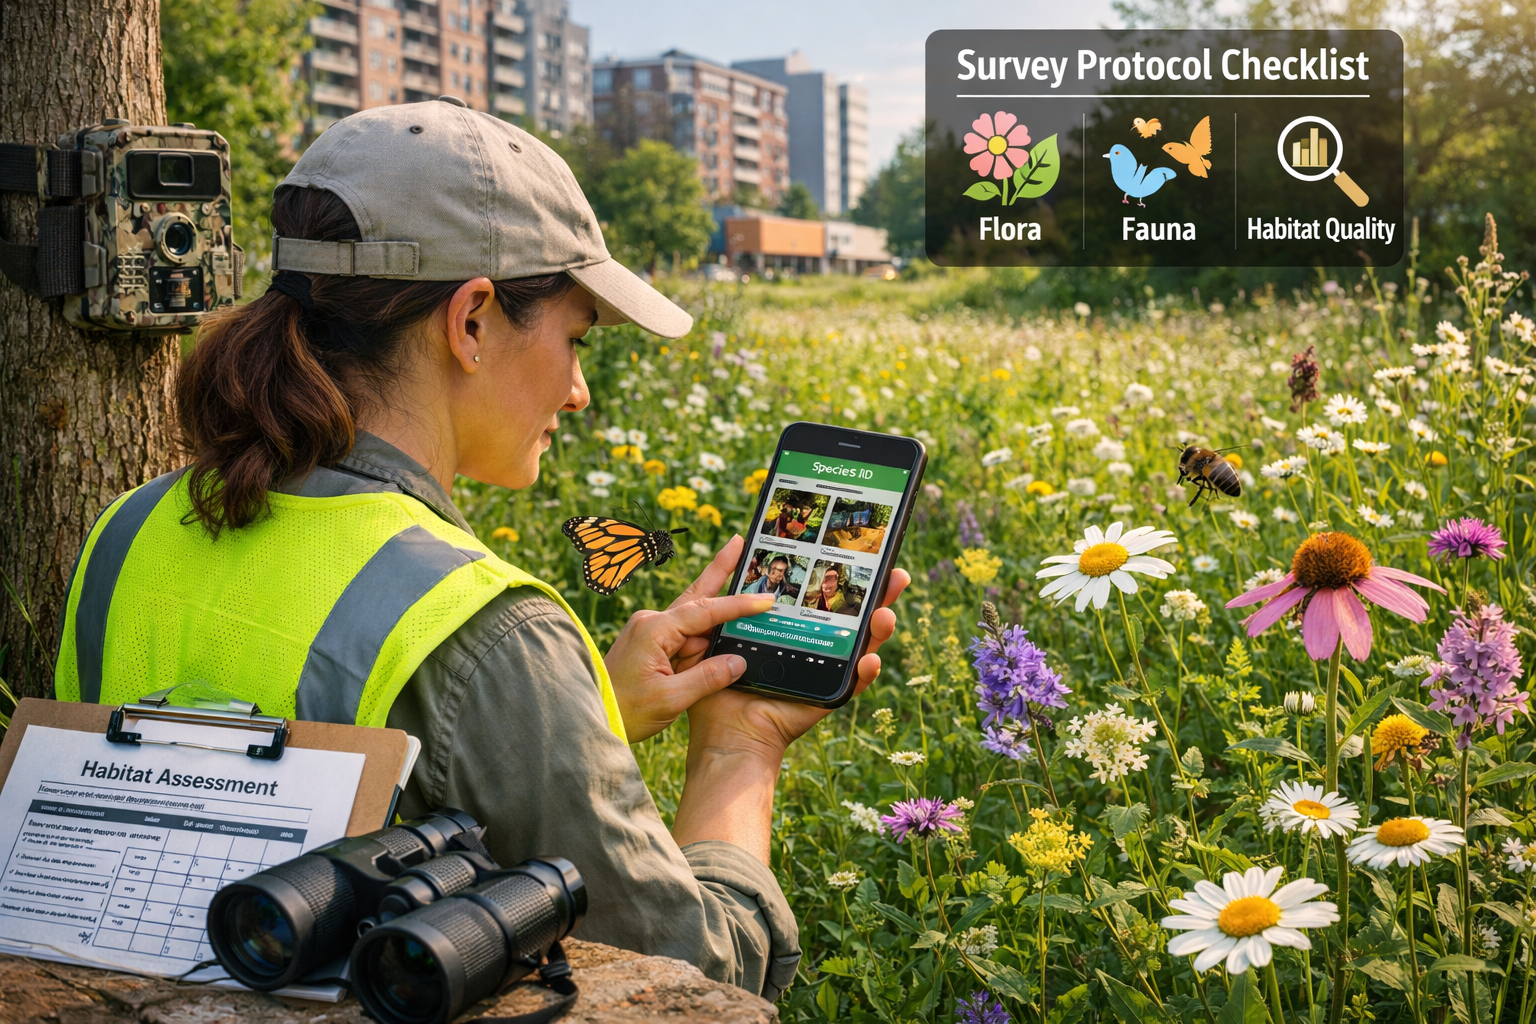
🔍 Modified Survey Protocols for Urban Contexts
1. Extended Survey Seasons
Urban microclimates and heat island effects alter phenology. Extend survey windows by 2-4 weeks compared to rural equivalents to capture species active during warmer urban conditions.
2. Disturbance Indicators Documentation
Record and quantify human impacts systematically:
- Footfall intensity (low/medium/high traffic zones)
- Litter and pollution levels
- Artificial lighting effects on nocturnal species
- Noise pollution measurements
- Presence of domestic animals
3. Invasive Species Mapping
Urban areas harbor disproportionate invasive species populations. Document:
- Japanese knotweed and other Schedule 9 species
- Invasive garden escapes (Cotoneaster, Buddleia on inappropriate sites)
- Non-native fauna (ring-necked parakeets, grey squirrels)
4. Habitat Condition Assessment Adjustments
The Statutory Biodiversity Metric's condition assessment criteria require interpretation for urban contexts. A "poor condition" urban meadow with native species may deliver more ecological value than a "moderate condition" amenity grassland.
Identifying and Mapping Green Corridors
Green corridors represent the highest-value biodiversity assets in urban landscapes. These linear features connect isolated habitat patches, enabling species movement and genetic exchange. Effective corridor identification requires:
Strategic Corridor Assessment Framework
✅ Connectivity Analysis
- Map all potential linkages between existing green spaces
- Identify pinch points where corridors narrow or break
- Assess permeability for target species groups (pollinators, small mammals, birds)
- Calculate corridor width and length ratios
✅ Habitat Quality Evaluation
- Survey vegetation structure (ground layer, shrub layer, canopy)
- Document native species richness
- Assess presence of food plants for priority species
- Identify breeding and foraging opportunities
✅ Enhancement Potential Scoring
Rate each corridor segment for:
- Ease of management access
- Landowner willingness to participate
- Cost-effectiveness of interventions
- Potential biodiversity unit gains
For projects requiring off-site biodiversity solutions, well-documented urban corridors can provide valuable enhancement opportunities.
Scalable Technology Solutions for Urban Surveys
📱 Mobile Survey Applications
Modern biodiversity survey apps have revolutionized urban ecological assessment. Leading platforms in 2026 include:
iRecord and iNaturalist Integration
- Real-time species identification using AI image recognition
- Automatic GPS tagging of observations
- Citizen science data aggregation
- Quality assurance through expert verification networks
Bespoke BNG Survey Apps
Specialized applications now integrate directly with the Statutory Biodiversity Metric, allowing:
- Field-based habitat condition assessments
- Automated unit calculations
- Photo documentation with metadata
- Cloud synchronization for team collaboration
"Citizen science initiatives are being used to map urban biodiversity hotspots, enabling companies to identify priority areas for offsetting and enhancement measures in cities."[5]
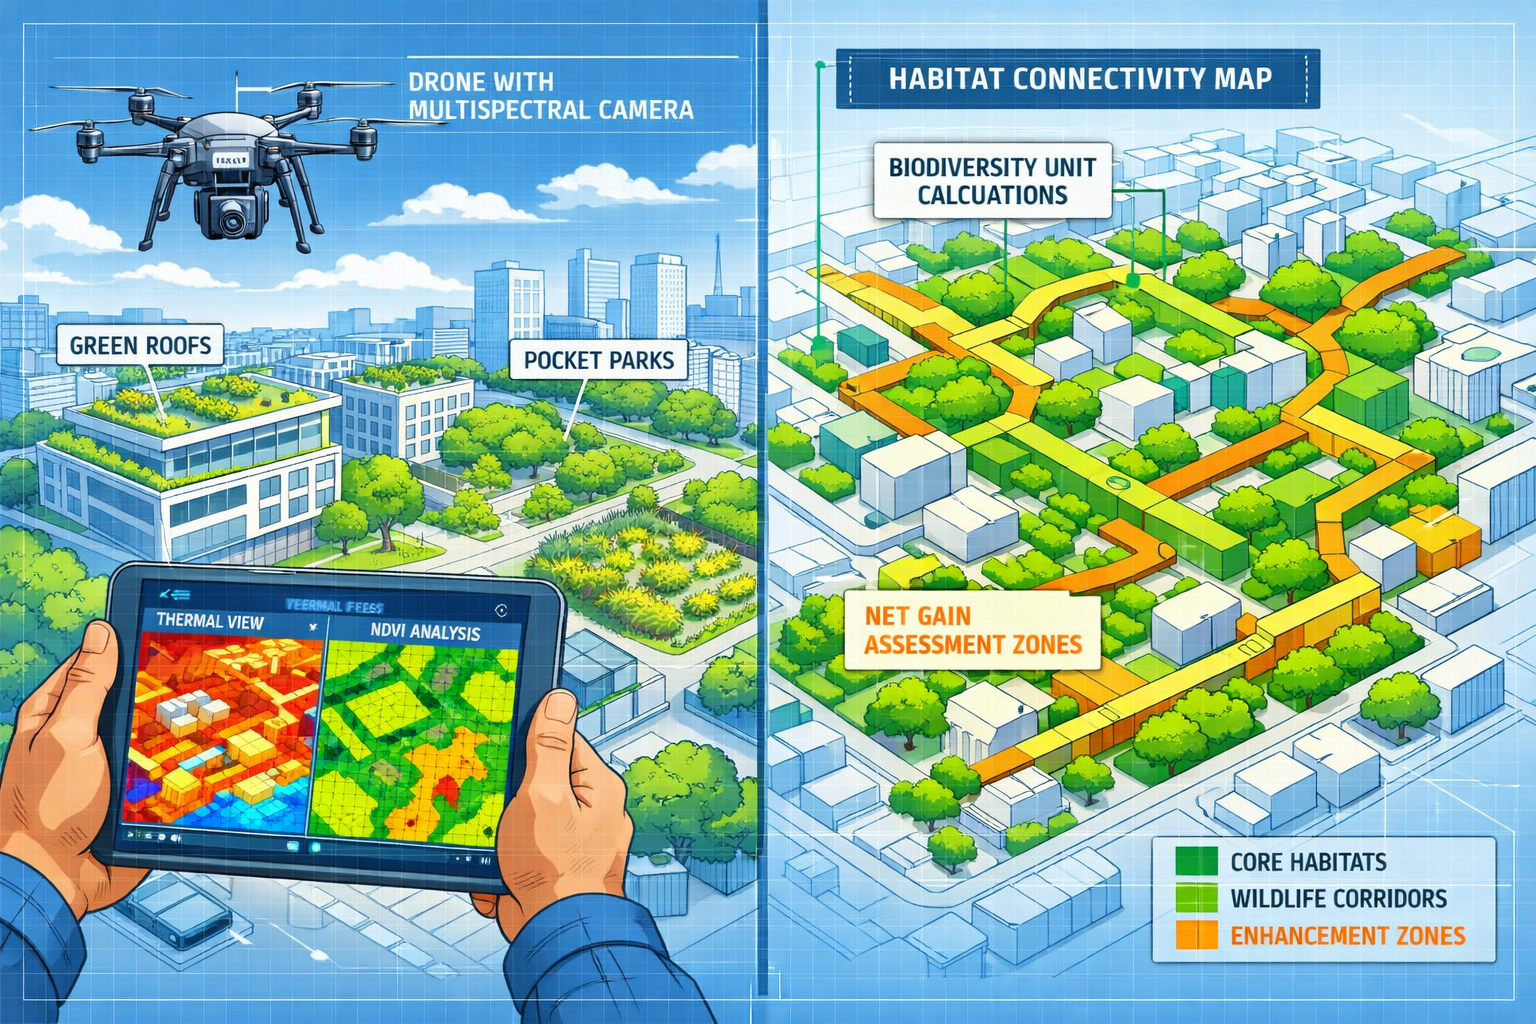
🚁 Drone-Based Habitat Mapping
Unmanned Aerial Vehicles (UAVs) offer unprecedented efficiency for urban biodiversity surveys:
Multispectral Imaging
- NDVI (Normalized Difference Vegetation Index) mapping identifies vegetation health
- Thermal imaging detects water features and microclimate variations
- High-resolution RGB imagery for habitat classification
Practical Drone Protocol for Urban BNG Surveys:
- Pre-flight planning: Obtain necessary permissions (CAA regulations, landowner consent)
- Flight parameters: 50-80m altitude for habitat-scale mapping
- Image capture: 70-80% overlap for photogrammetry processing
- Data processing: Structure-from-Motion software creates 3D habitat models
- Ground-truthing: Validate 15-20% of mapped features with field visits
Cost-Benefit Analysis:
A single drone survey can map 50-100 hectares in one day, compared to 2-5 hectares for traditional walkover surveys. For large urban development sites, this represents 80-90% time savings.
🗺️ GIS-Based Connectivity Modeling
Geographic Information Systems enable sophisticated analysis of urban biodiversity networks:
Least-Cost Path Analysis
- Models optimal routes for species movement between habitat patches
- Incorporates barriers (major roads, railways, buildings)
- Identifies critical connectivity bottlenecks
Circuit Theory Applications
- Calculates multiple potential movement pathways
- Prioritizes corridors for enhancement based on network importance
- Quantifies resilience of connectivity networks
These analytical approaches support strategic decision-making for biodiversity net gain assessments, ensuring interventions deliver maximum ecological value.
Quantifying Biodiversity Units in Urban Hotspots for Net Gain Compliance
Applying the Statutory Biodiversity Metric to Urban Habitats
The Statutory Biodiversity Metric provides consistent measurement framework across projects, using habitat value multipliers to calculate baseline conditions before development and post-development improvements[4]. However, urban applications require careful interpretation.
Key Metric Considerations for Urban Ecologists
Habitat Distinctiveness
Urban habitats often fall into lower distinctiveness categories:
- Amenity grassland: Low distinctiveness (2 units/hectare)
- Modified grassland: Medium distinctiveness (4 units/hectare)
- Urban trees: Medium distinctiveness (varies by canopy structure)
- Species-rich hedgerows: High distinctiveness (6 units/hectare)
Condition Assessment Challenges
Urban habitats rarely meet "good condition" criteria due to:
- Simplified vegetation structure
- Reduced native species richness
- Presence of invasive species
- Human disturbance impacts
Strategic Significance Multipliers
Urban biodiversity hotspots may qualify for strategic significance uplifts if they:
- Fall within Local Nature Recovery Strategy priority areas
- Connect designated sites (SINCs, LNRs)
- Support priority species populations
- Provide ecosystem services to disadvantaged communities
Calculating Enhancement Potential
Enhancement scenarios for urban biodiversity hotspots typically focus on achievable interventions:
High-Impact Urban Enhancements
🌼 Grassland Diversification
- Baseline: Amenity grassland (2 units/ha, poor condition)
- Enhancement: Modified grassland (4 units/ha, moderate condition)
- Net gain: +100% unit increase per hectare
- Implementation: Reduced mowing regime, plug planting, yellow rattle introduction
🌳 Street Tree Network Expansion
- Baseline: Scattered urban trees (0.5 units per tree)
- Enhancement: Connected tree avenue with native species (1.2 units per tree)
- Net gain: +140% unit increase
- Implementation: Infill planting, species diversification, canopy connectivity
💧 Sustainable Drainage System (SuDS) Creation
- Baseline: Sealed surface (0 units)
- Enhancement: Swale with marginal vegetation (6 units/ha)
- Net gain: New habitat creation
- Implementation: Rain garden, bioswale, detention basin with native planting
For developers navigating these calculations, our resource on what you need for a biodiversity net gain report provides comprehensive guidance.
The Three-Tier Hierarchy in Urban Contexts
The mandatory three-tier hierarchy for achieving 10% net gain follows this order: on-site enhancement, off-site biodiversity gains or purchasing units, and government statutory biodiversity credits as last resort[1].
Urban-Specific Hierarchy Considerations:
Tier 1: On-Site Enhancement
- Limited by space constraints in dense urban areas
- Focus on vertical greening (green roofs, walls)
- Maximize value of retained habitats
- Integrate biodiversity into building design
Tier 2: Off-Site Solutions
- Urban green corridor enhancement projects
- Brownfield site restoration within same locality
- Strategic acquisition of nearby enhancement sites
- Biodiversity unit purchases from local providers
Tier 3: Statutory Credits
- Last resort when local solutions unavailable
- Higher cost implications (£42,000-£48,000 per unit in 2026)
- Less desirable from planning policy perspective
- See our guide on biodiversity credits for developers
Practical Implementation: Case Studies and Protocols
Protocol 1: Rapid Urban Biodiversity Corridor Assessment
Time Required: 2-3 hours per kilometer
Equipment: Smartphone with survey app, measuring tape, camera
Output: Habitat condition assessment, enhancement recommendations, biodiversity unit estimate
Step-by-Step Process:
1️⃣ Desktop Preparation (30 minutes)
- Review aerial imagery and historical maps
- Identify corridor boundaries and access points
- Note nearby designated sites and LNRS priorities
- Check for existing ecological records
2️⃣ Field Survey (90-120 minutes per km)
- Walk entire corridor length, recording waypoints every 50m
- Photograph representative sections
- Complete habitat condition assessment forms
- Record target notes for notable features
- Document enhancement opportunities and constraints
3️⃣ Species Recording (integrated with walkover)
- Focus on indicator species (pollinators, birds, plants)
- Use identification apps for real-time verification
- Prioritize recording of priority species
4️⃣ Data Processing (60 minutes)
- Upload records to central database
- Calculate baseline biodiversity units
- Model enhancement scenarios
- Produce summary report with recommendations
Protocol 2: Drone-Assisted Large Site Assessment
Suitable for: Sites >5 hectares, complex topography, inaccessible areas
Time Required: 1 day fieldwork + 2 days processing
Output: High-resolution habitat map, 3D terrain model, biodiversity unit calculations
Implementation Steps:
1️⃣ Permissions and Planning
- Obtain CAA operational authorization
- Secure landowner consent
- Check for airspace restrictions
- Plan flight paths with 75% image overlap
2️⃣ Drone Survey Execution
- Conduct multispectral imaging flight
- Capture RGB imagery for photogrammetry
- Record ground control points for georeferencing
- Document weather conditions
3️⃣ Ground-Truthing
- Visit 15-20 sample points across site
- Verify habitat classifications
- Assess condition at validation points
- Record species data for metric inputs
4️⃣ Data Analysis
- Process imagery in photogrammetry software
- Classify habitats using supervised classification
- Calculate area measurements for metric
- Produce deliverable maps and reports
Community Engagement and Citizen Science Integration
Community stewardship and resident involvement is recommended as a long-term management strategy for urban biodiversity areas, ensuring both ecological and social functions are maintained[2].
Building Citizen Science Networks
BioBlitz Events
- Intensive 24-hour biodiversity recording sessions
- Engage local communities in species identification
- Generate baseline data for urban hotspots
- Build public support for enhancement projects
Ongoing Monitoring Programs
- Train volunteer surveyors in standardized protocols
- Establish permanent monitoring transects
- Use apps for data submission and quality control
- Provide feedback on biodiversity trends
Benefits for BNG Compliance:
- Reduced survey costs through volunteer effort
- Enhanced data coverage across seasons
- Improved public acceptance of development projects
- Demonstration of community benefit for planning applications
For planners seeking to understand how citizen engagement fits within BNG requirements, our article on 8 things planners need to know about biodiversity net gain provides valuable context.
Overcoming Urban-Specific Challenges
Managing the 30-Year Commitment
The 30-year legal commitment required for biodiversity gains means improvements must be secured through planning conditions or conservation covenants rather than being temporary measures[1]. In urban contexts, this creates unique challenges:
Securing Long-Term Management:
- Establish management companies with dedicated funding
- Transfer responsibility to local authorities or wildlife trusts
- Create community land trusts for stewardship
- Implement endowment-style financial mechanisms
Monitoring and Reporting Requirements:
- Year 1, 3, 5, 10, 15, 20, 25, 30 monitoring visits
- Photo-point monitoring at fixed locations
- Condition assessment using metric criteria
- Remedial action triggers if targets not met
Addressing Contamination and Safety Concerns
Urban sites frequently present health and safety challenges:
Risk Assessment Protocols:
- Desktop contamination screening using historical maps
- Phase 1 contamination surveys where indicated
- Asbestos surveys for brownfield sites
- Japanese knotweed treatment plans
Safe Survey Practices:
- Two-person survey teams in isolated locations
- High-visibility clothing in active urban areas
- Tetanus vaccination currency
- First aid certification for field staff
Navigating Complex Land Ownership
Urban biodiversity corridors often cross multiple ownerships:
Stakeholder Mapping Process:
- Identify all landowners along proposed corridors
- Engage Network Rail, Canal & River Trust, Highways England
- Consult with local authority parks departments
- Coordinate with utility companies (rights of way issues)
Negotiation Strategies:
- Emphasize co-benefits (flood management, amenity value)
- Offer funded habitat management in exchange for access
- Explore formal conservation covenant agreements
- Consider compulsory purchase for strategic sites (last resort)
Future Trends: Urban Biodiversity Hotspots for Net Gain Compliance: Survey Strategies for City Ecologists in 2026 and Beyond
Emerging Technologies
AI-Powered Species Identification
Machine learning algorithms now achieve >95% accuracy for common urban species, enabling:
- Automated processing of camera trap images
- Real-time acoustic monitoring of bats and birds
- Rapid vegetation classification from drone imagery
Environmental DNA (eDNA) Sampling
Water and soil samples reveal species presence without direct observation:
- Detect rare or cryptic species in urban ponds
- Monitor invertebrate communities in drainage systems
- Assess soil biodiversity in brownfield sites
LiDAR Integration
Light Detection and Ranging technology provides:
- Precise vegetation structure measurements
- 3D modeling of habitat complexity
- Automated tree canopy mapping at city scale
Policy Developments
The January 2026 IPF report identified emerging opportunities and challenges for institutional real estate investors navigating the mandatory BNG landscape[3]. Key trends include:
- Standardization of urban biodiversity unit pricing
- Development of urban-specific metric adjustments
- Integration with carbon offsetting schemes
- Increased scrutiny of off-site delivery mechanisms
Market Evolution
The biodiversity units market continues maturing:
- Urban-focused habitat banks emerging near major cities
- Specialist urban ecology consultancies expanding
- Technology platforms connecting unit buyers and sellers
- Insurance products for 30-year management risk
For those interested in the commercial aspects, our resources on selling biodiversity units and understanding unit costs provide current market insights.
Conclusion
Urban Biodiversity Hotspots for Net Gain Compliance: Survey Strategies for City Ecologists in 2026 represents both a significant challenge and an unprecedented opportunity to enhance nature in our cities. The mandatory 10% biodiversity net gain requirement, now fully implemented across all development scales, demands that city ecologists adopt sophisticated survey strategies, leverage scalable technologies, and think creatively about enhancement opportunities within constrained urban environments.
Key success factors include:
✅ Strategic identification of high-value urban biodiversity corridors that maximize connectivity and ecological functionality
✅ Technology integration through mobile apps, drone surveys, and GIS analysis to achieve cost-effective, comprehensive assessments
✅ Specialized protocols that account for human disturbance, habitat fragmentation, and the unique characteristics of urban ecosystems
✅ Community engagement that builds long-term stewardship capacity and ensures the 30-year management commitments are sustainable
✅ Practical application of the Statutory Biodiversity Metric with urban-appropriate interpretations and enhancement scenarios
Actionable Next Steps for City Ecologists
- Audit your current survey toolkit – Ensure you have access to modern survey apps, drone capabilities, and GIS analysis software
- Map potential urban corridors in your area of operation using desktop GIS analysis before field surveys
- Develop standardized protocols for rapid urban biodiversity assessment that balance rigor with efficiency
- Build citizen science networks to extend survey coverage and create community buy-in for enhancement projects
- Stay informed on policy developments and metric updates through professional networks and industry resources
- Establish partnerships with landowners, local authorities, and wildlife organizations for long-term management delivery
The transformation of urban environments into functional biodiversity networks will not happen overnight, but with systematic survey approaches, strategic enhancement planning, and commitment to the 30-year management horizon, city ecologists can deliver genuine net gain that benefits both wildlife and urban communities. The tools and strategies outlined in this article provide a practical foundation for navigating this new regulatory landscape while contributing to nature recovery at a landscape scale.
For comprehensive support with biodiversity net gain compliance, from initial surveys through to achieving biodiversity net gain without risk, professional ecological consultancies offer the expertise and resources to ensure successful project delivery in 2026 and beyond.
References
[1] Uk Biodiversity Net Gain The 8905575 – https://www.jdsupra.com/legalnews/uk-biodiversity-net-gain-the-8905575/
[2] Top 5 Challenges Of Implementing The Bng Statutory Metric In Urban Developments – https://www.bng.ai/blog/top-5-challenges-of-implementing-the-bng-statutory-metric-in-urban-developments/
[3] Biodiversity Net Gain Regulations Opportunities And Challenges January 2026 – https://www.ipf.org.uk/resourceLibrary/biodiversity-net-gain-regulations—opportunities-and-challenges–january-2026-.html
[4] Biodiversity Net Gain – https://oneclicklca.com/en/resources/articles/biodiversity-net-gain/
[5] Undp Bhr Lens To Net Zero And Nature Positive – https://www.undp.org/sites/g/files/zskgke326/files/2026-03/undp_bhr-lens-to-net-zero-and-nature-positive.pdf
