
{"cover":"Professional landscape format (1536×1024) hero image with bold text overlay 'Upgrading Baseline Ecology Surveys: Moving Beyond Species Lists to Decision-Ready Biodiversity Indicators' in extra large 70pt white sans-serif font with dark shadow effect, positioned in upper third. Background shows split composition: left side displays ecologist with tablet conducting field survey in diverse grassland habitat with wildflowers and butterflies, right side shows modern digital dashboard with biodiversity metric charts, habitat condition graphs, and BNG calculation interface. Color scheme: natural greens, earth tones, professional blue accents. High contrast, magazine cover quality, editorial style with professional environmental consultancy aesthetic.","content":["Detailed landscape format (1536×1024) image showing side-by-side comparison of old versus new survey approaches. Left panel labeled 'Traditional Approach' displays clipboard with handwritten species checklist, simple tally marks, and basic field notes in black and white. Right panel labeled 'Decision-Ready Indicators' shows modern tablet interface with colorful habitat distinctiveness matrix, condition assessment scoring rubrics, biodiversity unit calculations, and real-time data visualization graphs. Include visual elements: habitat type icons (grassland, woodland, wetland), condition rating stars, numerical biodiversity scores, and connectivity arrows. Professional environmental consultancy aesthetic with clean infographic style, educational diagram quality.","Detailed landscape format (1536×1024) image depicting comprehensive habitat assessment framework in action. Scene shows diverse UK habitat types arranged in grid layout: species-rich grassland, native woodland, wetland, hedgerow, and urban green space. Each habitat section overlaid with transparent data cards displaying distinctiveness rating (Low/Medium/High), condition score (Poor/Moderate/Good), strategic significance indicators, and calculated biodiversity unit values. Include visual elements: measurement tools, assessment criteria checklists, seasonal monitoring calendar icons, and data flow arrows connecting habitats to central BNG calculation dashboard. Color-coded rating system, professional field guide aesthetic, technical precision.","Detailed landscape format (1536×1024) image illustrating integrated biodiversity monitoring technology and workflow. Central focus shows ecologist using modern survey equipment (binoculars, GPS device, digital recorder) in natural habitat setting during spring season with emerging vegetation. Surrounding the field scene are floating digital interface elements: automated habitat boundary mapping tool, real-time species occurrence database, Mean Species Abundance (MSA) calculation widget, temporal trend graphs showing baseline versus current measurements, and scenario modeling projections. Include visual elements: satellite imagery overlay, data synchronization icons, cloud storage symbols, and multi-season comparison timeline. Futuristic yet practical aesthetic, technology-enhanced conservation approach, professional environmental monitoring quality."]
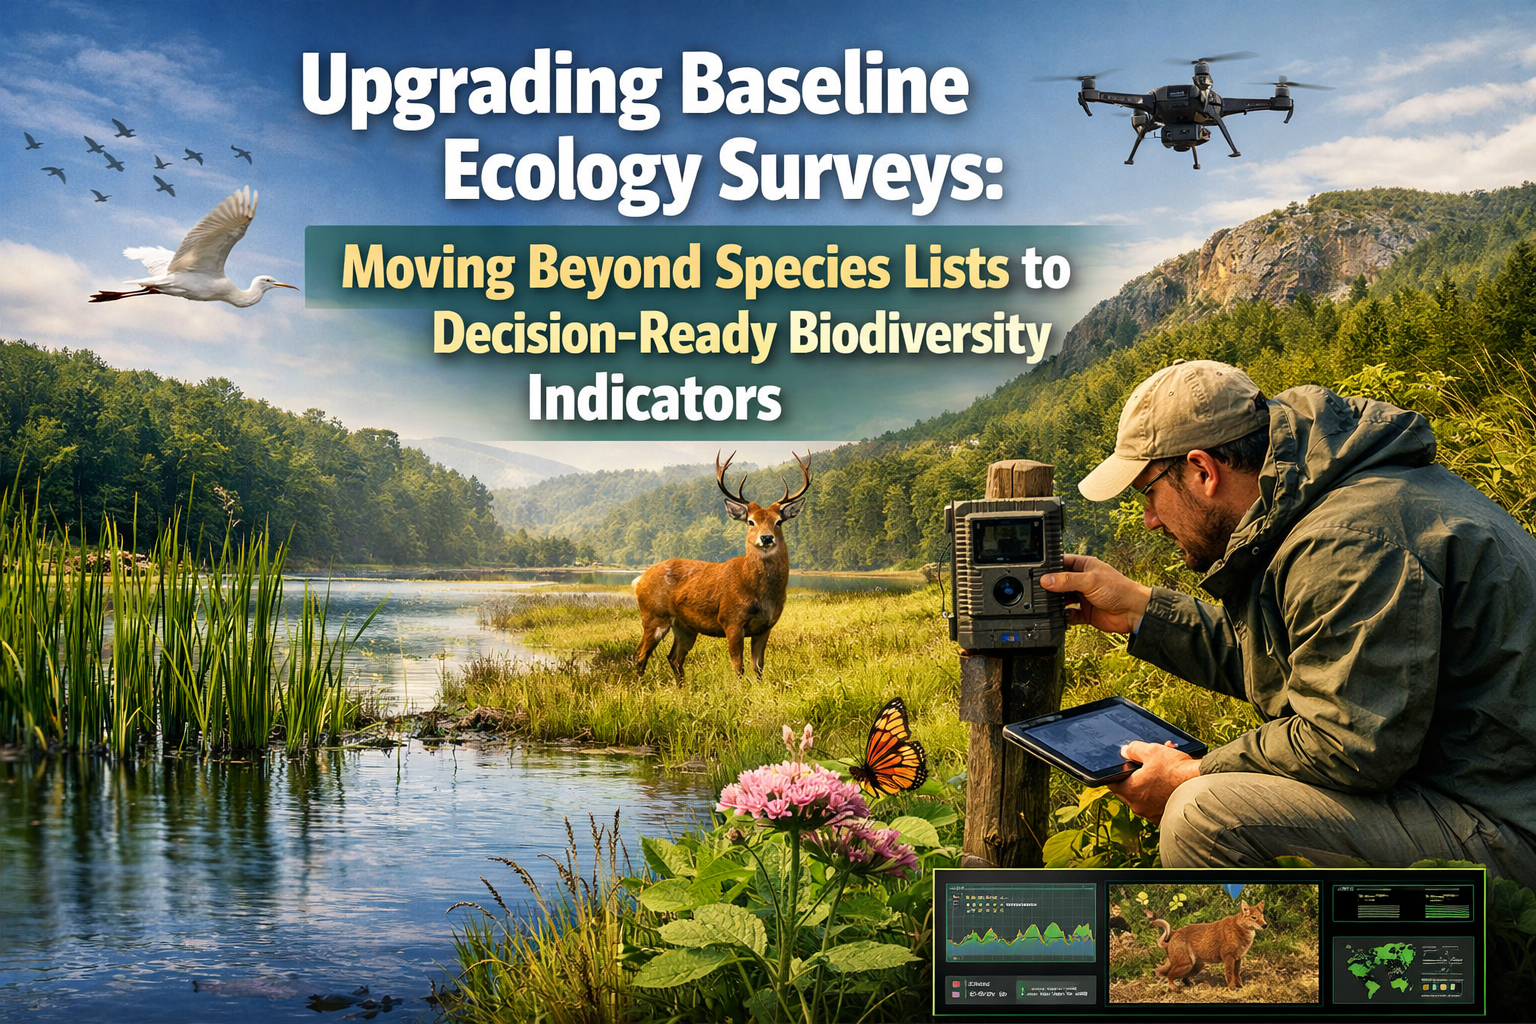
The ecologist crouches in the meadow, clipboard in hand, methodically recording species names. Meadow buttercup: present. Skylark: heard. Common blue butterfly: observed. This familiar scene has defined baseline ecology surveys for decades—but in 2026, it's no longer enough. With global wildlife populations having declined by 73% since 1970 [3], and approximately $7.3 trillion per year in financial flows driving biodiversity loss [1], the ecological consultancy sector faces an urgent question: how can baseline surveys generate the robust, comparable indicators needed for effective biodiversity net gain (BNG) calculations, scenario modeling, and long-term monitoring?
Upgrading baseline ecology surveys: moving beyond species lists to decision-ready biodiversity indicators represents a fundamental shift in how ecologists approach pre-construction and baseline assessments. Rather than producing ad-hoc inventories that sit in filing cabinets, modern surveys must deliver standardized metrics that feed directly into statutory frameworks, investment decisions, and adaptive management strategies.
Key Takeaways
- 🎯 Decision-ready indicators transform raw species data into standardized biodiversity units that enable BNG calculations, regulatory compliance, and investment risk assessment
- 📊 Habitat-based frameworks using distinctiveness, condition, and strategic significance ratings provide more robust baselines than species presence/absence lists alone
- ⏰ Timing matters critically—baselines defined at monitoring start determine all future comparisons, making early spring surveys essential for capturing full biological cycles
- 🔄 Multi-source integration combining ecological surveys, habitat mapping, and species monitoring programmes delivers comprehensive assessment beyond single-metric approaches
- 💼 Financial urgency drives change—with only $220 billion invested in conservation versus $7.3 trillion driving biodiversity loss, improved monitoring systems are economically essential [1]
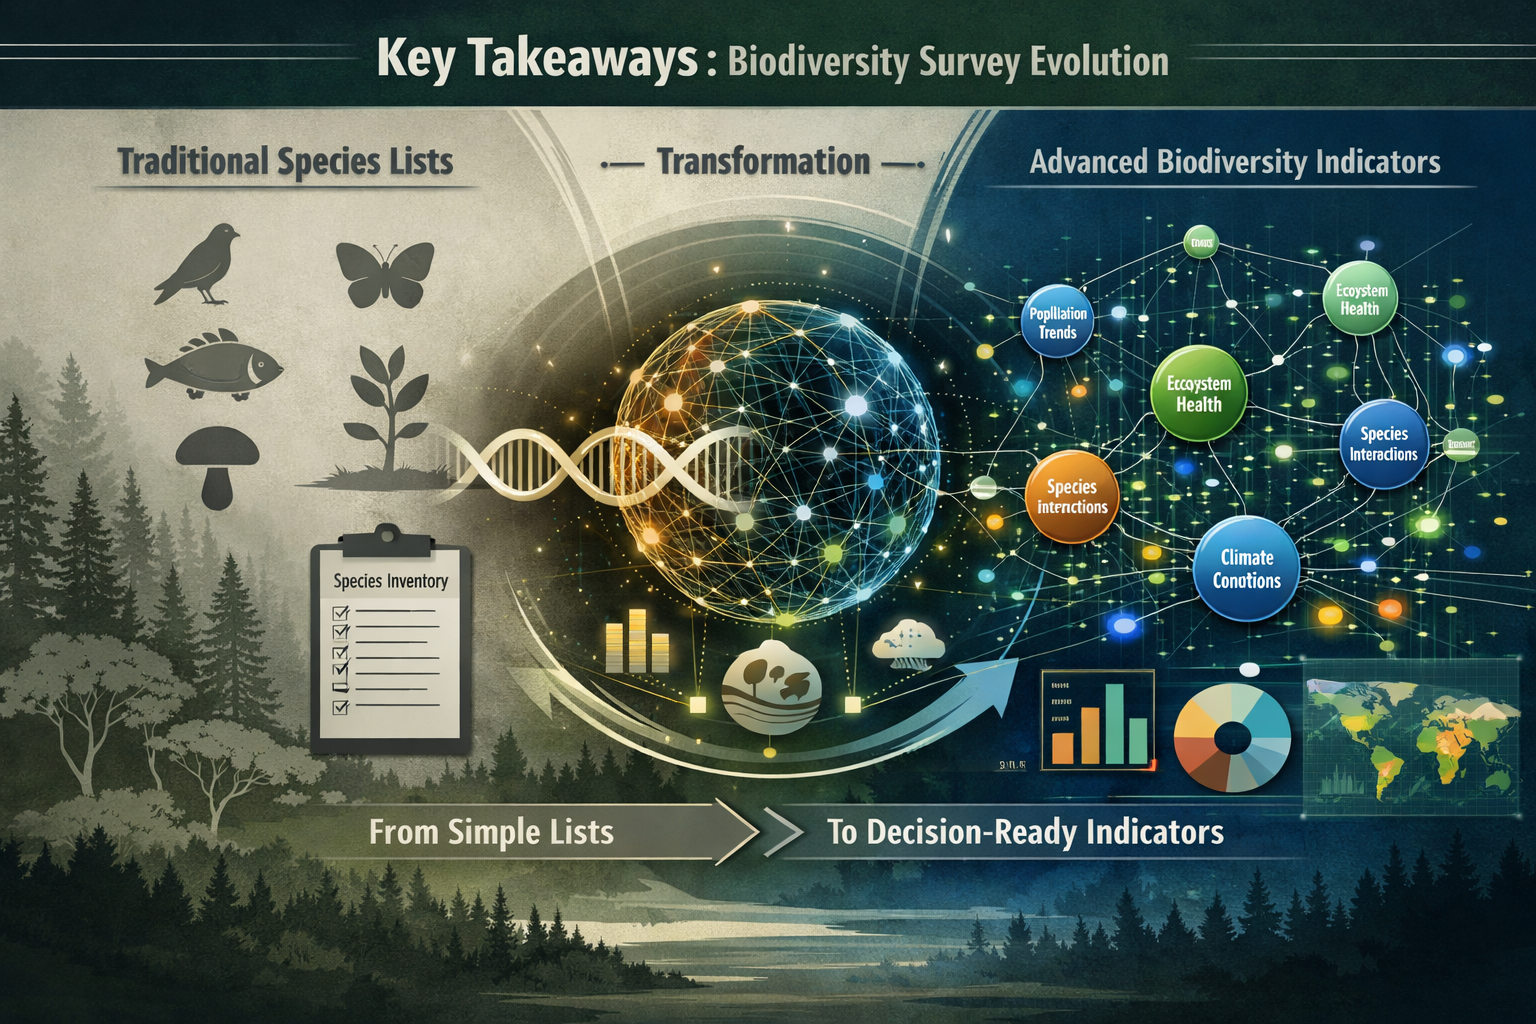
Why Traditional Species Lists Fall Short in 2026
Traditional baseline ecology surveys typically deliver a species inventory: a list of flora and fauna recorded during site visits, often organized taxonomically with abundance estimates or presence/absence notation. While valuable for documenting biodiversity, these lists present significant limitations when stakeholders need actionable information.
The Decision-Making Gap
Planning authorities, developers, and land managers increasingly require answers to specific questions:
- How many biodiversity units does this site currently hold?
- What will the net gain or loss be under different development scenarios?
- Which habitat interventions deliver the greatest measurable uplift?
- How does this site's ecological value compare to regional benchmarks?
A species list cannot directly answer these questions. The Intergovernmental Science-Policy Platform on Biodiversity and Ecosystem Services (IPBES) identified "persistent gaps in knowledge, monitoring, and indicators" that limit understanding of business impacts on biodiversity, particularly at local and sector-specific levels [1]. This gap exists not because ecologists lack data, but because traditional survey outputs aren't structured to support decision frameworks.
Regulatory Drivers Demanding Standardization
England's statutory biodiversity net gain framework now requires local planning authorities to assess whether developments achieve 10% biodiversity net gain using Natural England's biodiversity metric calculation tool [3]. This regulatory shift demands that baseline surveys deliver:
✅ Habitat type classifications aligned with UK Habitat Classification
✅ Condition assessments using standardized criteria
✅ Distinctiveness ratings for each habitat parcel
✅ Strategic significance evaluations
✅ Spatial data enabling accurate area calculations
Traditional species lists, however comprehensive, don't automatically generate these parameters. For guidance on how these elements integrate into biodiversity net gain assessments, ecologists must redesign survey protocols from the ground up.
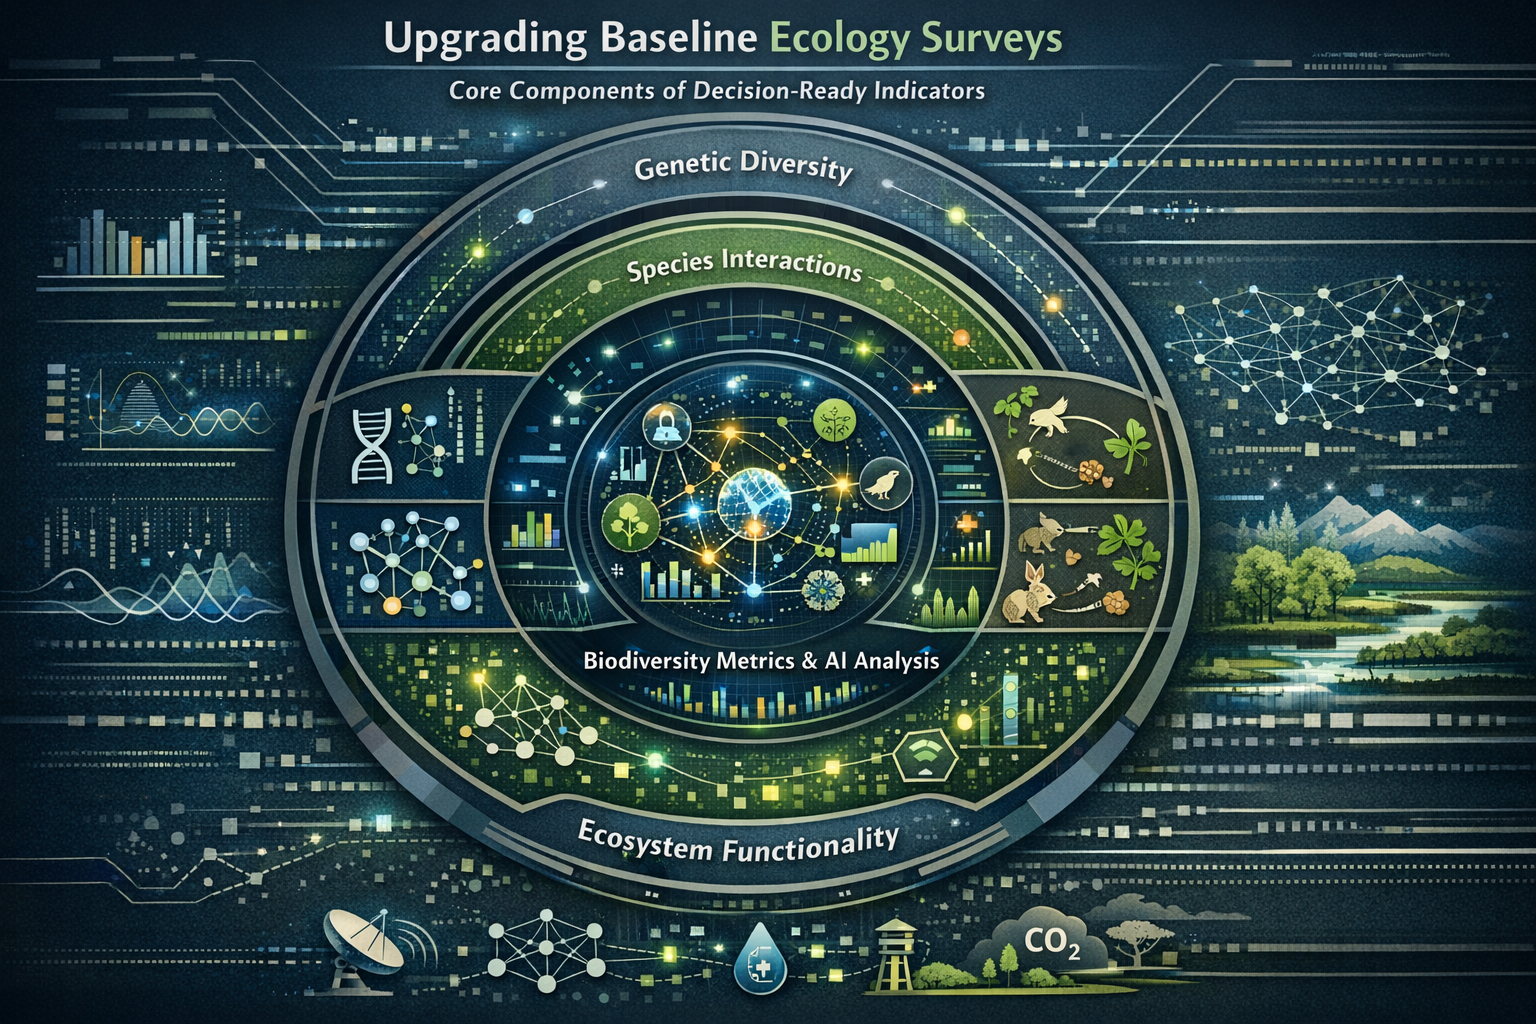
Upgrading Baseline Ecology Surveys: Core Components of Decision-Ready Indicators
Transforming baseline surveys requires integrating habitat-based assessment frameworks with species data to generate standardized biodiversity indicators. This approach doesn't replace species recording—it contextualizes it within quantifiable metrics.
Habitat Distinctiveness and Condition Assessment
The statutory metric framework classifies habitats across multiple types including grasslands, woodlands, wetlands, and urban green spaces, with standardized condition and distinctiveness ratings enabling precise biodiversity valuation [3].
Distinctiveness ratings reflect habitat rarity and ecological importance:
| Distinctiveness Band | Examples | Multiplier |
|---|---|---|
| Very High | Ancient woodland, species-rich grassland | 8 |
| High | Native hedgerows, ponds | 6 |
| Medium | Modified grassland, scrub | 4 |
| Low | Amenity grassland, intensive arable | 2 |
Condition assessments evaluate habitat quality against specific criteria. For example, lowland meadow condition might be scored based on:
- 🌱 Species diversity (number of positive indicator species)
- 🚫 Cover of negative indicator species
- 🌾 Sward structure variation
- 🌳 Scrub encroachment levels
- 💧 Evidence of appropriate management
Each habitat type has bespoke condition assessment sheets. Ecologists must complete these systematically during baseline surveys to generate condition scores (Poor, Moderate, Good) that directly multiply habitat area to produce biodiversity units.
Strategic Significance Mapping
Beyond intrinsic habitat quality, strategic significance considers landscape-scale ecological value:
- Proximity to designated sites (SSSIs, Local Wildlife Sites)
- Connectivity to ecological networks
- Contribution to habitat creation opportunities
- Alignment with local nature recovery strategies
Strategic significance adds a spatial multiplier to biodiversity unit calculations, rewarding habitats that strengthen ecological networks. Baseline surveys must therefore include GIS mapping and landscape context analysis—not just on-site recording. Understanding how to conduct a biodiversity impact assessment requires this broader spatial perspective.
Temporal Baseline Establishment
Evolito's 2026 guidance emphasizes that "baselines are defined the moment monitoring begins, and every future comparison depends on that starting point" [4]. Delayed monitoring creates weakened reference points where degradation may be undetected.
Critical timing considerations:
📅 Early spring initiation allows capture of the full arc of biological activity from first emergence through peak summer and seasonal decline [4]
📅 Multi-season surveys document seasonal variation in habitat condition
📅 Repeat visits establish confidence intervals for species occurrence
📅 Photographic documentation creates visual baselines for future comparison
The Woodland Carbon Code's ongoing biodiversity measurement trials during 2025 and 2026 demonstrate the importance of establishing measurable baseline and future comparison data through standardized protocols [5].

Integrating Advanced Biodiversity Metrics into Survey Protocols
Moving beyond species lists to decision-ready biodiversity indicators requires incorporating quantitative metrics that translate ecological data into comparable units.
Mean Species Abundance (MSA) as an ESG Indicator
Mean Species Abundance is emerging as a vital biodiversity metric for ESG reporting, investment risk assessment, and supply chain sustainability [3]. MSA measures the mean abundance of original species relative to their abundance in undisturbed ecosystems, expressed as a percentage.
MSA applications in baseline surveys:
- Provides a single-number summary of biodiversity intactness
- Enables comparison across different habitat types and geographies
- Supports corporate biodiversity footprinting
- Facilitates scenario modeling of development impacts
While MSA requires extensive reference data, ecologists can contribute to MSA calculations by recording species abundance (not just presence) and linking observations to habitat condition assessments.
Automated Calculation Tools and Digital Integration
Advanced sustainability dashboard technology now enables automated calculation of project boundary area, total area of habitats, hedgerow parameters, and water courses, with instant recalculation capabilities when design changes occur [6]. This technological shift transforms how baseline data is collected and utilized.
Digital survey protocols should:
🔧 Use standardized habitat classification codes compatible with metric calculators
🔧 Record spatial data in GIS-compatible formats
🔧 Photograph condition assessment evidence with geotagged images
🔧 Link species records to specific habitat parcels
🔧 Enable real-time data validation to catch errors in the field
For developers seeking to achieve 10% biodiversity net gain, these digital workflows dramatically accelerate scenario testing and design optimization.
Multi-Source Data Integration
Current best-practice biodiversity assessment incorporates ecological surveys, habitat mapping, and species monitoring programmes—moving beyond single-metric approaches to comprehensive data integration [3].
Integrated baseline survey components:
| Data Source | Contribution to Indicators |
|---|---|
| Phase 1 Habitat Survey | Habitat type classification, area calculations |
| National Vegetation Classification | Detailed habitat condition assessment |
| Protected Species Surveys | Regulatory compliance, strategic significance |
| Desk Study (NBN Atlas, local records) | Historical baseline, species assemblage expectations |
| Remote Sensing (LiDAR, multispectral) | Structural diversity, vegetation health indices |
| eDNA Sampling | Species detection, community composition |
This multi-source approach addresses the IPBES finding that monitoring gaps persist particularly at local and sector-specific levels [1]. By combining field surveys with desk studies and emerging technologies, ecologists generate more robust baselines.
Practical Implementation: Redesigning Survey Methodologies
Translating these principles into field practice requires systematic changes to survey design, data collection, and reporting protocols.
Survey Design Checklist for Decision-Ready Indicators
Before fieldwork begins, ecologists should confirm their survey design will deliver:
✅ Habitat parcels mapped to boundaries suitable for area calculation
✅ Condition assessment criteria identified for each habitat type present
✅ Distinctiveness ratings assigned based on UK Habitat Classification
✅ Strategic significance factors evaluated through desk study
✅ Temporal coverage spanning appropriate seasons for target habitats
✅ Photographic baselines established at fixed points
✅ Data formats compatible with metric calculators and GIS platforms
For small development projects, understanding BNG requirements for small sites helps right-size survey effort while maintaining metric compatibility.
Field Data Collection Protocols
During site visits, data collection must serve dual purposes: documenting biodiversity and generating metric inputs.
Enhanced field recording:
📝 Habitat condition sheets completed in full for each parcel
📝 Species abundance recorded using standardized scales (DAFOR, percentage cover)
📝 Structural features documented (deadwood, scrub density, sward height variation)
📝 Management evidence noted (grazing, mowing, recent disturbance)
📝 Negative indicators recorded (invasive species, pollution, fragmentation)
📝 Geotagged photographs capturing representative areas and specific features
This enhanced protocol requires more time per habitat parcel but generates data that directly populates biodiversity metric calculators without requiring post-survey interpretation or assumption.
Reporting Outputs That Support Decision-Making
The baseline ecology report becomes a decision-support document rather than a descriptive inventory. Key outputs include:
1. Biodiversity Unit Calculation
Present the site's current biodiversity value as a quantified baseline, broken down by habitat type and spatial risk category. This enables direct comparison with post-development scenarios.
2. Scenario Modeling
Demonstrate how different design options affect net biodiversity outcomes. For example, comparing on-site versus off-site delivery of biodiversity gains.
3. Enhancement Opportunity Mapping
Identify specific interventions (habitat creation, condition improvement, connectivity enhancement) with predicted biodiversity unit uplift.
4. Monitoring Recommendations
Specify indicators, survey methods, and temporal frequency for post-implementation monitoring that will enable meaningful comparison to baseline.
5. Data Accessibility
Provide spatial data in shareable formats (GIS shapefiles, KML) and tabular data compatible with metric calculators, enabling clients and stakeholders to explore scenarios independently.
Addressing Implementation Challenges and Capacity Building
Upgrading baseline ecology surveys presents practical challenges that the consultancy sector must address systematically.
Skill Development and Training Needs
Generating decision-ready biodiversity indicators requires ecologists to develop competencies beyond traditional species identification:
🎓 Habitat classification expertise using UK Habitat Classification
🎓 Condition assessment proficiency across diverse habitat types
🎓 GIS and spatial analysis skills for accurate area calculation
🎓 Metric calculator fluency to validate field data generates sensible outputs
🎓 Scenario modeling capability to support client decision-making
Professional development programmes and internal training initiatives must prioritize these competencies to meet 2026 regulatory demands.
Quality Assurance and Consistency
The shift to standardized metrics heightens the importance of quality assurance. Inconsistent condition assessments or habitat classification errors directly affect biodiversity unit calculations and regulatory compliance.
Quality assurance measures:
- Peer review of habitat classifications and condition assessments
- Calibration exercises where multiple surveyors assess the same parcels
- Photographic evidence requirements for condition scoring
- Senior ecologist sign-off on metric calculations
- Third-party verification for high-value or contentious sites
Organizations seeking guidance on achieving biodiversity net gain without risk should prioritize robust QA protocols.
Data Management and Long-Term Accessibility
Baselines are only valuable if they remain accessible for future comparison. The EU's 7th National Report on Biodiversity finds the EU is on track to achieve 16 out of 45 targets under the Kunming-Montreal Global Biodiversity Framework [2], demonstrating that long-term tracking against baselines is essential for measuring progress.
Data management best practices:
💾 Centralized repositories for baseline survey data
💾 Standardized metadata documenting survey methods, dates, and conditions
💾 Version control for metric calculations as methodologies evolve
💾 Archival formats ensuring data remains usable across software updates
💾 Data sharing agreements clarifying access rights for monitoring purposes
Without systematic data management, even the most sophisticated baseline surveys lose value over time.
The Broader Context: Biodiversity Monitoring in 2026
Upgrading baseline ecology surveys aligns with broader shifts in biodiversity monitoring and corporate accountability.
Regulatory Momentum and Policy Alignment
The statutory BNG framework in England represents just one element of expanding biodiversity regulation. Planners navigating BNG requirements increasingly demand baseline surveys that support strategic planning decisions, not just project-level compliance.
Policy developments driving survey methodology evolution include:
- Local Nature Recovery Strategies requiring landscape-scale baseline data
- Corporate biodiversity disclosure mandates increasing demand for ESG metrics
- Nature-based solution verification requiring robust before-after monitoring
- Biodiversity credit markets demanding standardized habitat condition assessments
Economic Drivers and Investment Context
The massive financial imbalance—$7.3 trillion driving biodiversity loss versus $220 billion invested in conservation [1]—creates economic pressure for improved monitoring. Investors and lenders increasingly require quantified biodiversity risk assessments before committing capital.
Baseline surveys that generate decision-ready indicators enable:
- Investment risk screening identifying biodiversity-related financial exposure
- Natural capital accounting quantifying ecosystem service flows
- Supply chain due diligence assessing biodiversity impacts across operations
- Green finance verification confirming environmental claims
For landowners exploring biodiversity unit sales, robust baseline assessments establish the credibility needed to attract buyers in emerging biodiversity markets.
Technological Innovation and Emerging Tools
Rapid technological advancement is transforming what's possible in baseline biodiversity assessment:
🔬 eDNA metabarcoding detects species from environmental samples
🛰️ Satellite remote sensing monitors habitat condition at landscape scale
🤖 Automated species identification using AI image recognition
📱 Mobile survey apps with built-in validation and metric integration
☁️ Cloud-based platforms enabling real-time data sharing and collaboration
These technologies don't replace field ecologists but augment survey capacity and improve data quality. Organizations that integrate emerging tools into baseline survey protocols gain competitive advantage and deliver superior client value.
Conclusion: From Species Lists to Strategic Ecological Intelligence
Upgrading baseline ecology surveys: moving beyond species lists to decision-ready biodiversity indicators is not merely a technical refinement—it represents a fundamental reimagining of the ecologist's role in development and land management. In 2026, baseline surveys must serve as the foundation for quantified decision-making, regulatory compliance, investment assessment, and adaptive management.
The transition requires systematic changes across survey design, field protocols, data management, and reporting. Ecologists must develop new competencies in habitat classification, condition assessment, spatial analysis, and metric calculation. Organizations must invest in quality assurance, digital infrastructure, and long-term data stewardship.
Yet the imperative is clear. With wildlife populations declining by 73% since 1970 [3], and financial flows driving biodiversity loss outpacing conservation investment by more than 30-to-1 [1], the ecological consultancy sector cannot afford to deliver baseline surveys that sit unused in filing cabinets. Decision-makers need strategic ecological intelligence—quantified, comparable, actionable indicators that illuminate pathways toward genuine biodiversity recovery.
Actionable Next Steps
For ecologists and organizations ready to upgrade baseline survey methodologies:
- Audit current survey templates against biodiversity metric requirements—identify gaps in habitat classification, condition assessment, and spatial data collection
- Invest in training for UK Habitat Classification, condition assessment protocols, and metric calculator proficiency
- Implement digital survey tools that integrate field data collection with GIS mapping and metric calculation
- Establish quality assurance protocols including peer review, calibration exercises, and photographic documentation standards
- Develop scenario modeling capabilities to demonstrate how baseline data supports client decision-making
- Create data management systems ensuring baseline surveys remain accessible for long-term monitoring
- Engage with emerging technologies (eDNA, remote sensing, AI identification) to enhance survey efficiency and data quality
For developers, planners, and land managers commissioning baseline surveys, demand decision-ready biodiversity indicators from the outset. Clarify that survey outputs must include habitat classifications, condition assessments, biodiversity unit calculations, and spatial data compatible with metric calculators. Understanding what you need in a biodiversity net gain report helps set appropriate expectations.
The era of the species list as an endpoint has passed. Baseline ecology surveys in 2026 must deliver the quantified, standardized, spatially-explicit indicators that enable genuine biodiversity net gain, support investment decisions, and track progress toward recovery targets. The tools, frameworks, and regulatory drivers are in place—now the ecological consultancy sector must rise to meet this elevated standard.
References
[1] Ipbes Publishes Its Business And Biodiversity Assessment – https://www.biodiversa.eu/2026/02/10/ipbes-publishes-its-business-and-biodiversity-assessment/
[2] Progress Made Biodiversity Swifter Action Needed 2026 02 12 En – https://environment.ec.europa.eu/news/progress-made-biodiversity-swifter-action-needed-2026-02-12_en
[3] Biodiversity Metrics – https://www.icebergdatalab.com/news/environmental_news/biodiversity-metrics
[4] Why Monitor Biodiversity In 2026 – https://evolito.earth/stories/why-monitor-biodiversity-in-2026
[5] Trialling Measurement Biodiversity Baseline – https://www.woodlandcarboncode.org.uk/trialling-measurement-biodiversity-baseline
[6] Watch – https://www.youtube.com/watch?v=lucVHr-5MBE
