
Tropical flowering plants are now blooming an average of 2.04 days later per decade—a shift documented across 230 years of herbarium specimens that reveals how climate change is quietly rewriting the seasonal calendars that govern plant-pollinator relationships [2]. This temporal disruption presents a critical challenge for biodiversity surveyors, ecologists, and land managers conducting pollinator assessments in 2026: traditional survey windows no longer capture the full spectrum of flowering and pollinator activity, potentially undermining baseline data essential for Biodiversity Net Gain (BNG) assessments and conservation planning.
Understanding Phenological Shifts in Pollinator Surveys: Adapting 2026 Protocols for Climate-Altered Flowering Windows has become essential for accurate ecological monitoring. As flowering times drift and pollinator emergence patterns change at species-specific rates, the risk of temporal mismatch—where plants bloom when their pollinators are absent, or vice versa—threatens both reproductive success and the validity of survey data used to inform land management decisions.
Key Takeaways
- Climate-driven phenological shifts vary dramatically by species, with some advancing, some delaying, and others remaining unchanged—requiring flexible, extended survey protocols rather than fixed seasonal windows [4]
- Individual-level variation is being obscured in population-wide surveys, yet this variation determines whether critical plant-pollinator interactions succeed or fail [1]
- Extended monitoring periods and multi-visit protocols are essential in 2026 to capture shifted flowering windows and establish accurate BNG baselines
- Citizen science integration expands temporal and spatial coverage, providing the repeated observations necessary to detect phenological mismatches
- Fitness-linked measurements—not just overlap metrics—are needed to identify which timing shifts actually threaten pollination services and ecosystem function
Understanding Phenological Shifts in Plant-Pollinator Systems 🌸
What Are Phenological Shifts?
Phenology refers to the timing of recurring biological events—when plants flower, when pollinators emerge, when seeds disperse. Climate change is altering these carefully synchronized calendars, creating temporal shifts that ripple through entire ecosystems.
Recent research confirms that tropical flowers are blooming weeks later than historical patterns in some regions [7], while other studies document advancement in temperate systems. The critical insight for 2026 protocols: these shifts are not uniform. Different plant species respond differently to temperature cues, precipitation patterns, and photoperiod signals [4].
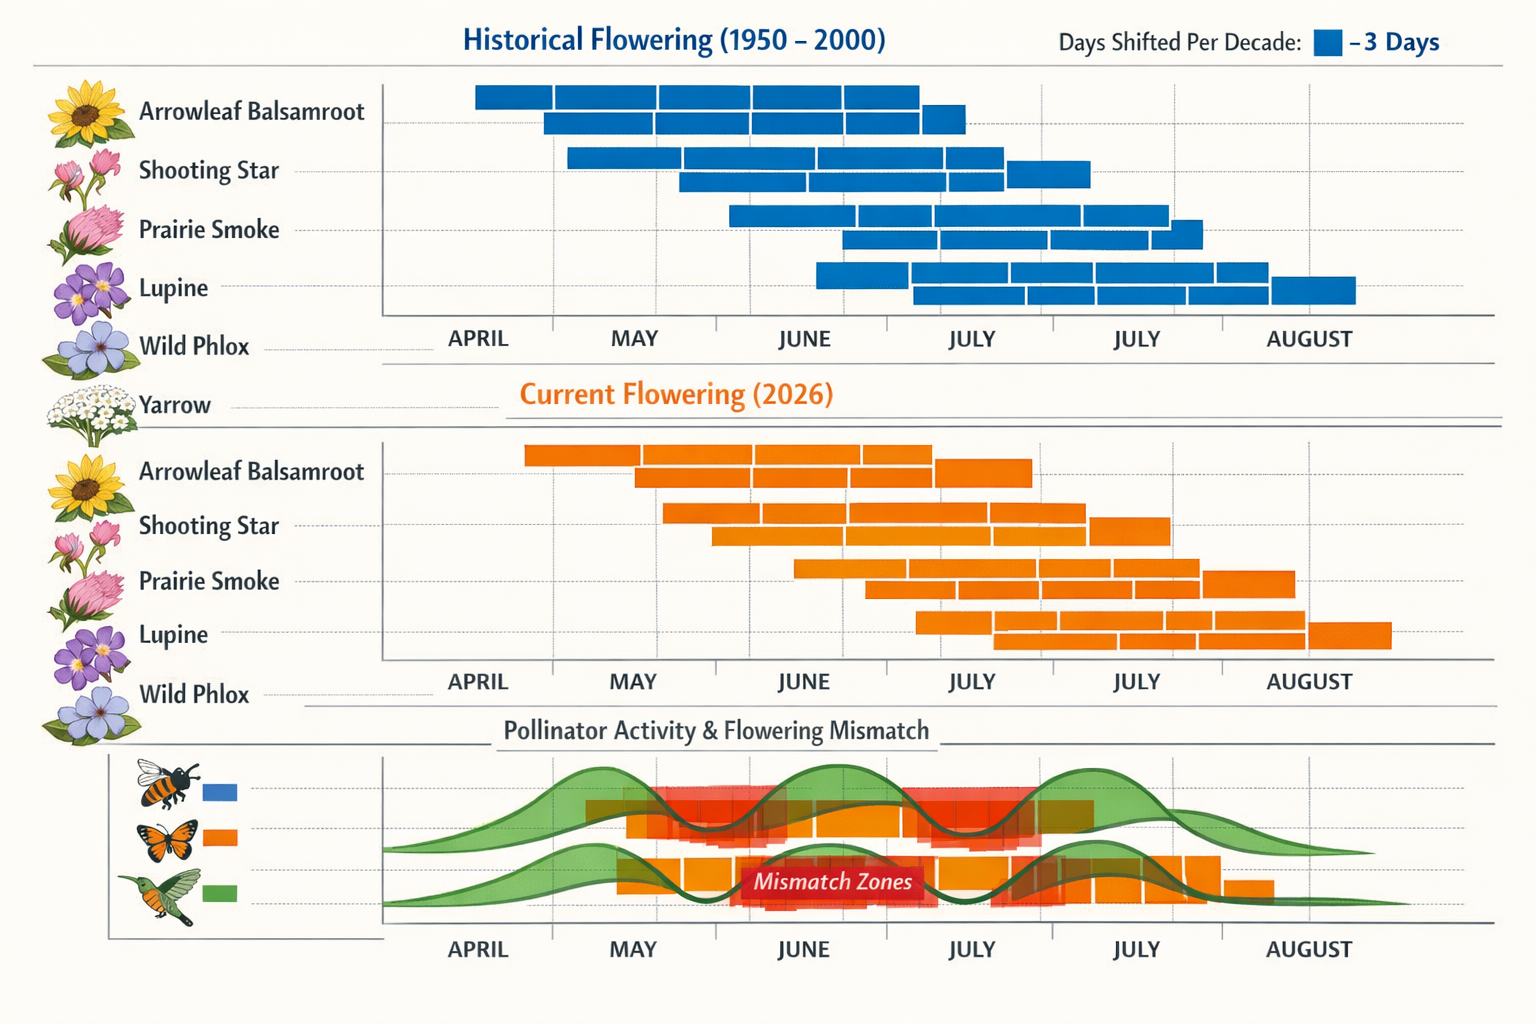
The Mismatch Problem
When flowering times shift at different rates than pollinator emergence, the result is phenological asynchrony—a temporal gap that can weaken or eliminate mutualistic interactions entirely [1]. This mismatch threatens:
- Plant reproductive success when flowers bloom before or after pollinator activity peaks
- Pollinator nutrition when food resources are unavailable during critical life stages
- Ecosystem stability as cascading effects disrupt food webs
- Survey accuracy when monitoring occurs outside actual activity windows
Historical wildflower data spanning over a century continues to reveal these trends [6], providing the long-term baseline necessary to distinguish climate-driven changes from natural variation.
Three Critical Complexities for 2026 Protocols
Current phenological monitoring faces significant challenges that must inform updated survey approaches [1]:
- Capturing phenological mosaics: Within-population and among-population variation creates complex patterns that population-level averages obscure
- Linking timing to fitness: Measuring overlap is insufficient—protocols must assess whether mismatches actually reduce reproductive success
- Integrating full life cycles: Single flowering events don't capture the complete temporal dynamics of plant-pollinator relationships
Phenological Shifts in Pollinator Surveys: Adapting 2026 Protocols for Extended Monitoring Windows
Why Traditional Survey Windows Fail in 2026
Standard pollinator survey protocols typically specify fixed seasonal windows—for example, "conduct three visits between May and July." These rigid timeframes assume stable phenological patterns that no longer exist. When flowering windows shift by weeks or even months, fixed-date surveys risk:
- Missing peak flowering entirely for early or late-shifting species
- Underestimating pollinator diversity when emergence no longer aligns with survey dates
- Generating misleading baseline data for BNG assessments that inform 30-year management plans
- Failing to detect critical mismatches that threaten pollination services
Adaptive Survey Windows: A 2026 Framework
Modern protocols must embrace phenology-responsive scheduling rather than calendar-based timing. This framework includes:
🗓️ Pre-Season Phenological Forecasting
Before establishing survey dates, conduct:
- Thermal accumulation modeling using growing degree days (GDD) to predict flowering onset
- Historical comparison against 10+ year datasets to identify shift trends
- Indicator species monitoring using early-blooming sentinel plants to trigger survey initiation
📊 Extended Temporal Coverage
Replace three-visit protocols with:
| Traditional Protocol | 2026 Adapted Protocol |
|---|---|
| 3 visits, May-July | 5-7 visits, April-September |
| Fixed monthly intervals | Phenology-triggered visits |
| Single daily time window | Multiple daily time windows |
| Peak-season focus | Full-season coverage |
🔄 Multi-Visit Intensity During Transition Periods
Increase survey frequency during:
- Early season (March-April) to catch advanced bloomers
- Late season (August-September) to capture delayed species
- Predicted mismatch windows when historical data suggests temporal gaps
Integrating Individual-Level Measurements
Population-level surveys mask the individual variation that determines interaction success [1]. Enhanced 2026 protocols should incorporate:
- Individual plant tracking: Mark and monitor specific plants across the season to document flowering duration and pollinator visitation
- Microhabitat variation: Survey across environmental gradients (sun/shade, wet/dry) to capture phenological mosaics within sites
- Fitness proxies: Measure seed set, fruit production, or pollen deposition to link timing with reproductive outcomes
These individual-scale measurements are particularly relevant for developers conducting biodiversity impact assessments, where accurate baseline characterization determines BNG liability and mitigation requirements.
Process-Based Models for Predictive Protocols
Rather than relying solely on observational surveys, 2026 approaches should integrate process-based phenological models [1]. These models use:
- Temperature response curves (reaction norms) derived from experimental data
- Individual-level parameters scaled to population predictions
- Climate scenario projections to forecast future phenological shifts
This modeling approach allows surveyors to anticipate where and when mismatches are likely to intensify, enabling proactive monitoring focus.
Phenological Shifts in Pollinator Surveys: Practical Implementation for Ecologists and Land Managers
Developing Site-Specific Timing Calendars
Creating customized phenological calendars for survey sites involves:
Step 1: Compile Historical Data
Gather existing records from:
- Herbarium specimens documenting flowering dates across decades [2][3]
- Previous ecological surveys conducted on or near the site
- Citizen science databases (iNaturalist, UK Pollinator Monitoring Scheme)
- Agricultural extension records for crop-pollinator systems
Step 2: Identify Key Species and Their Shift Rates
Focus on:
- Dominant flowering plants that provide major nectar/pollen resources
- Specialist pollinators with narrow temporal activity windows
- Conservation priority species relevant to BNG objectives
Document known shift rates—for instance, the 2.04 days/decade average masks individual species variation from 0.037 to significantly higher rates [2].
Step 3: Create Flexible Survey Windows
Design monitoring schedules with:
- Buffer periods extending 2-3 weeks before and after historical peak dates
- Trigger-based visits initiated when indicator species reach specific phenological stages
- Contingency dates allowing schedule adjustment based on real-time observations
Citizen Science Integration for Enhanced Coverage 👥
Community science programs dramatically expand monitoring capacity, providing the repeated observations across broad geographic areas essential for detecting phenological shifts [9].
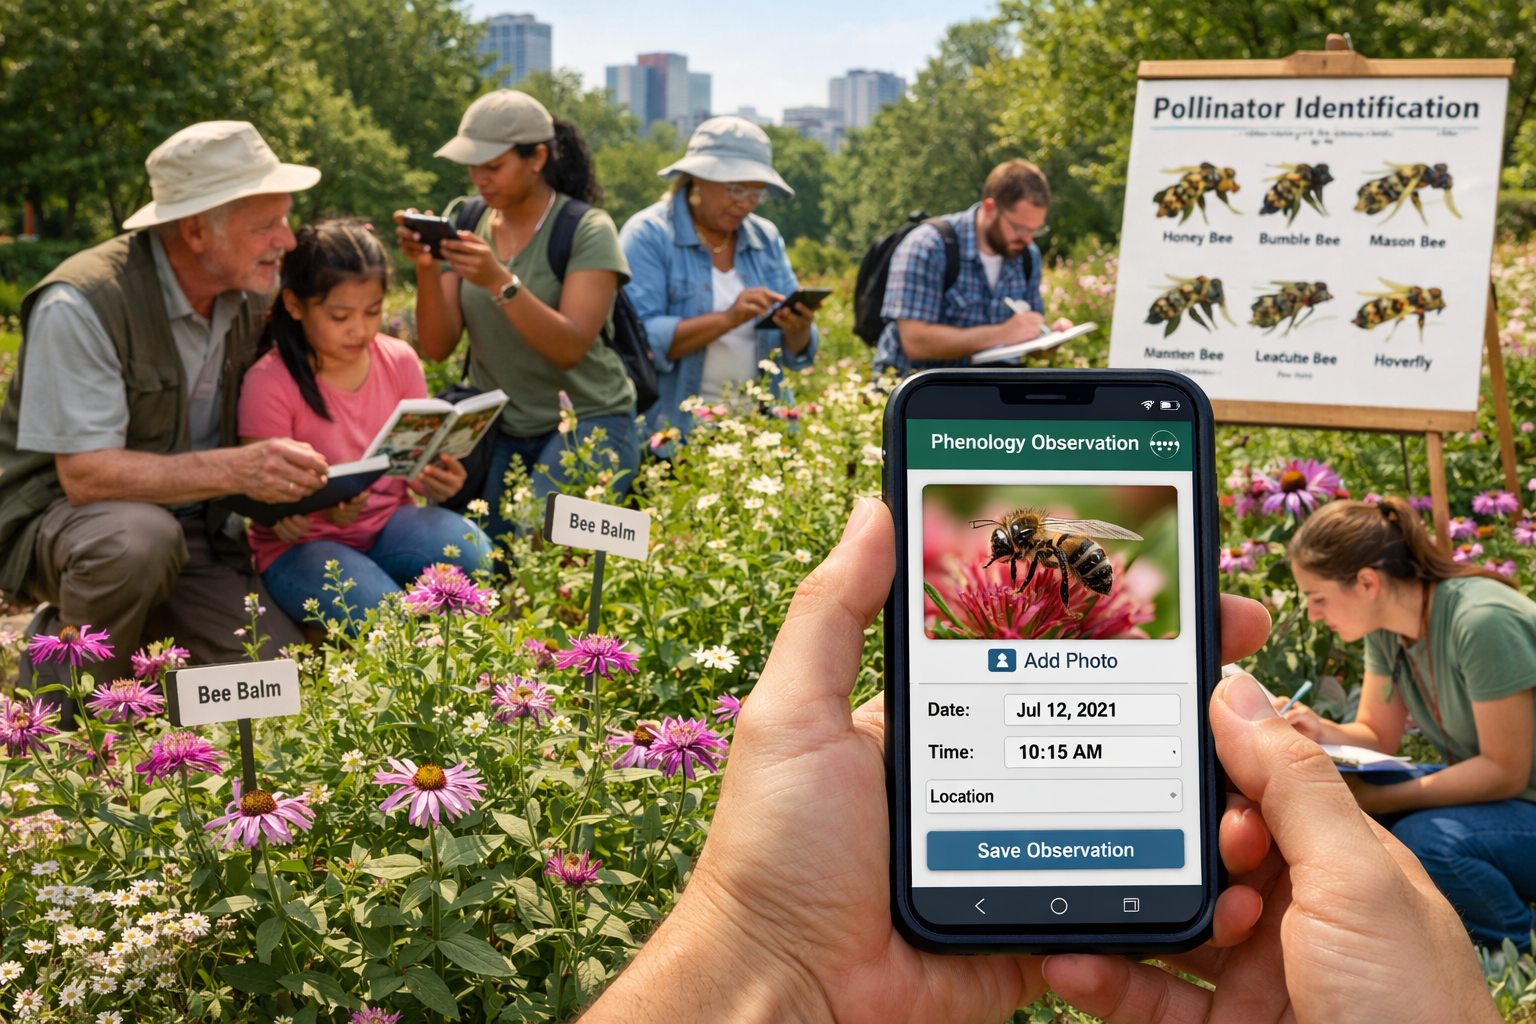
Successful 2026 Citizen Science Models
Recent initiatives demonstrate effective approaches:
- Phenology Week (March 16-20, 2026) engaged hundreds of observers in synchronized monitoring across North America [9]
- Redbud Phenology Project provided structured training through January 2026, equipping community scientists with standardized protocols [5]
- Regional phenology networks coordinate observations across environmental gradients
Best Practices for Integration
When incorporating citizen science into professional surveys:
✅ Provide clear, standardized protocols with visual guides for species identification and phenological stage recognition
✅ Use accessible technology like smartphone apps with photo verification and GPS tagging
✅ Implement quality control through expert verification of submitted observations
✅ Coordinate timing so citizen observations complement professional survey visits
✅ Share results to maintain engagement and demonstrate data value
For landowners managing biodiversity assets, citizen science offers cost-effective supplementary monitoring that strengthens long-term management evidence.
Linking Phenology to BNG Baselines and Outcomes
Accurate phenological data directly impacts BNG calculations and management success:
Baseline Assessment Implications
Phenological mismatches affect:
- Habitat distinctiveness scores when pollinator-dependent plant communities show reduced reproductive success
- Condition assessments where temporal asynchrony indicates functional degradation
- Connectivity evaluations as phenological isolation reduces effective habitat networks
Management Intervention Timing
Understanding shifted phenologies informs:
- Habitat creation schedules: Plant establishment timing to ensure flowering aligns with pollinator activity
- Mowing/cutting regimes: Adjusted to avoid disrupting critical flowering periods
- Supplementary planting: Selecting species that fill temporal gaps in nectar/pollen availability
These considerations are essential for achieving 10% Biodiversity Net Gain through functionally effective interventions rather than merely structural habitat creation.
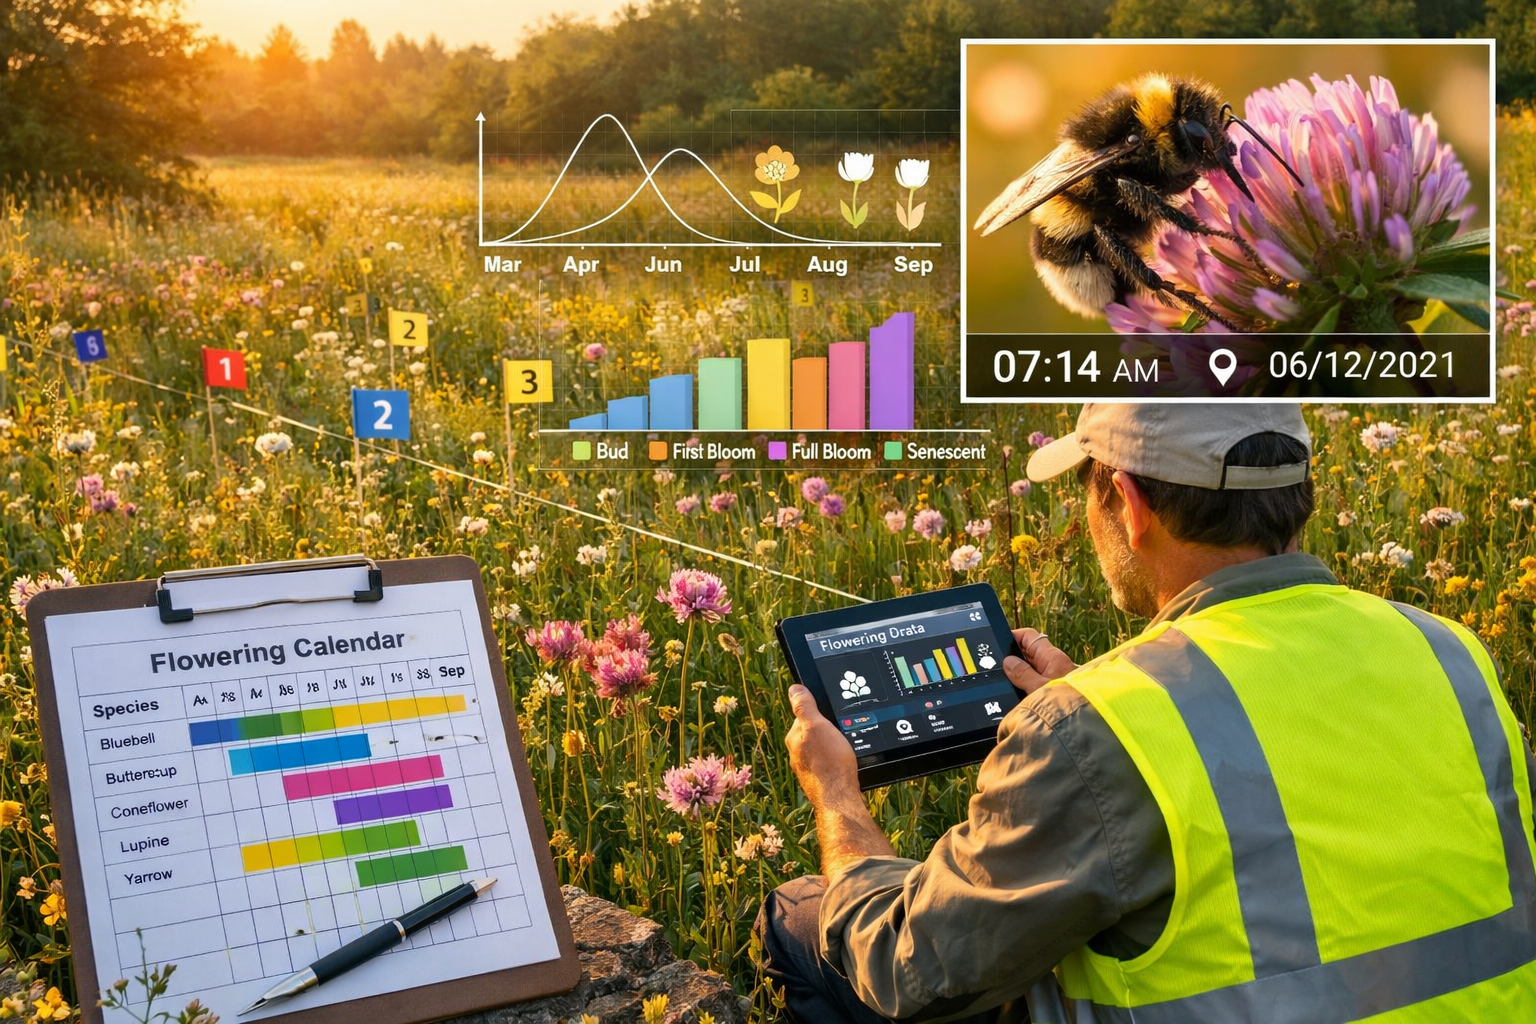
Technology-Enhanced Monitoring Tools
Modern survey protocols benefit from technological advances:
| Technology | Application | Phenological Benefit |
|---|---|---|
| Automated cameras | 24/7 flower visitor recording | Captures activity outside human survey hours |
| Environmental sensors | Continuous temperature/humidity logging | Links phenological events to microclimate drivers |
| Drone imagery | Landscape-scale flowering assessment | Identifies spatial patterns in phenological progression |
| Mobile apps | Real-time data entry with GPS/timestamps | Standardizes observations across multiple surveyors |
| DNA barcoding | Pollen identification from pollinator bodies | Reveals cryptic interactions missed by observation |
Regional Phenological Shift Patterns: UK Context
While global patterns show diverse responses, UK-specific trends inform local protocol adaptation:
- Spring-flowering species generally advancing (earlier flowering) in southern England
- Summer-flowering species showing mixed responses with some delays
- Upland and northern populations experiencing different shift rates than lowland/southern counterparts
- Urban heat island effects creating phenological advancement in cities versus rural areas
Surveyors must account for this spatial heterogeneity when developing regional survey protocols, potentially requiring location-specific timing adjustments even within relatively small geographic areas.
Addressing Data Gaps and Uncertainty
Phenological research continues to reveal knowledge gaps that affect protocol design [1]:
Current limitations include:
- Insufficient data linking phenological overlap metrics to actual fitness consequences
- Limited understanding of compensatory mechanisms (e.g., pollinator diet flexibility)
- Incomplete knowledge of threshold mismatch levels that trigger population declines
- Scarce long-term datasets for many plant-pollinator systems
2026 protocols should therefore:
- Acknowledge uncertainty in reports and assessments
- Implement precautionary monitoring with broader temporal coverage when data are limited
- Prioritize fitness measurements where feasible to build the evidence base
- Contribute to long-term datasets through consistent, repeated surveys
For professionals navigating BNG requirements, transparent documentation of phenological uncertainty strengthens defensible baseline assessments and management plans.
Advanced Considerations for Phenological Shift Monitoring
Taxonomic-Specific Protocols
Different pollinator taxa require tailored approaches due to varying life history traits:
Bees 🐝
- Solitary species: Single-generation life cycles create narrow activity windows highly vulnerable to mismatch
- Social species: Multi-generational colonies show greater temporal flexibility
- Survey adaptation: Focus on emergence timing for spring specialists; track colony development for social species
Hoverflies
- Multi-generational: Several generations per year create extended activity periods
- Temperature-dependent development: Particularly sensitive to thermal accumulation shifts
- Survey adaptation: Monitor across full season; track generation timing shifts
Butterflies and Moths 🦋
- Host plant dependence: Larval food plant phenology equally critical as adult nectar sources
- Migration patterns: Some species show phenological flexibility through mobility
- Survey adaptation: Coordinate monitoring with both larval and adult resource availability
Climate-Driven vs. Other Phenological Drivers
Not all phenological variation results from climate change [8]. Protocols must distinguish:
- Photoperiod cues: Day length remains constant, providing stable signals for some species
- Precipitation patterns: Water availability affects flowering independently of temperature
- Biotic interactions: Herbivory, competition, and facilitation influence timing
- Management interventions: Mowing, grazing, and other practices override climate signals
Robust survey designs incorporate environmental data collection (temperature, precipitation, soil moisture) alongside phenological observations to enable driver attribution.
Scaling from Site to Landscape
Individual site surveys contribute to landscape-level understanding when:
- Standardized protocols enable data aggregation across sites
- Coordinated timing allows regional synchrony assessment
- Metadata documentation captures site characteristics affecting phenological responses
- Data sharing platforms facilitate multi-site analysis
This landscape perspective is particularly valuable for landowners considering biodiversity unit sales, as regional phenological patterns inform habitat banking site selection and management strategies.
Future-Proofing Survey Protocols
Given ongoing climate change, 2026 protocols should be designed for continued adaptation:
Build in flexibility:
- Annual protocol reviews incorporating latest phenological data
- Adaptive triggers allowing mid-season schedule adjustments
- Modular survey components that can be added/removed as understanding evolves
Invest in capacity:
- Train surveyors in phenological assessment techniques
- Develop institutional knowledge of site-specific patterns
- Establish long-term monitoring commitments beyond minimum BNG requirements
Embrace innovation:
- Pilot emerging technologies (AI-powered image recognition, acoustic monitoring)
- Participate in research collaborations advancing phenological science
- Contribute data to national/international monitoring networks
Conclusion
Phenological Shifts in Pollinator Surveys: Adapting 2026 Protocols for Climate-Altered Flowering Windows represents more than a technical adjustment to monitoring schedules—it reflects a fundamental recognition that the temporal architecture of ecosystems is changing beneath our feet. The 2.04 days per decade shift documented in tropical systems [2], the weeks-long delays in some flowering events [7], and the species-specific variation in phenological responses [4] collectively demand that ecological surveyors abandon fixed-calendar approaches in favor of flexible, phenology-responsive protocols.
For biodiversity professionals conducting BNG assessments, the implications are clear: baseline surveys using outdated temporal windows risk underestimating pollinator diversity, mischaracterizing habitat condition, and generating management plans that fail to address functional ecological relationships. Extended monitoring periods, individual-level measurements, citizen science integration, and process-based forecasting models provide the tools necessary to capture climate-altered phenological realities.
Actionable Next Steps
For ecological consultants and surveyors:
- Audit existing protocols against 2026 best practices, identifying fixed-date assumptions that require revision
- Compile site-specific phenological baselines using historical data, herbarium records, and citizen science databases
- Implement extended survey windows with 5-7 visits spanning early spring through late summer
- Integrate individual-level tracking for key plant-pollinator interactions relevant to BNG objectives
For land managers and developers:
- Budget for expanded monitoring recognizing that accurate phenological assessment requires additional survey effort
- Engage professional biodiversity surveyors with expertise in phenological monitoring and climate change ecology
- Incorporate phenological considerations into habitat management plans, adjusting intervention timing to support shifted flowering windows
- Establish long-term monitoring commitments that track phenological trends across 30-year BNG management periods
For policy makers and planners:
- Update guidance documents to explicitly address phenological shift considerations in BNG assessments
- Support citizen science infrastructure that expands phenological monitoring capacity
- Fund research linking phenological metrics to fitness outcomes and ecosystem service provision
- Recognize temporal uncertainty in regulatory frameworks, allowing adaptive management approaches
The evidence is unambiguous: climate change is rewriting the seasonal calendars that govern plant-pollinator relationships, and our survey protocols must evolve accordingly. By implementing phenology-responsive monitoring in 2026, the biodiversity sector can ensure that conservation and development decisions rest on accurate ecological baselines that reflect contemporary—and future—environmental realities. The pollinators, plants, and ecosystems they support depend on our capacity to adapt as rapidly as the climate itself is changing.
References
[1] Timing is everything: an overview of phenological changes to plant-pollinator interactions – https://academic.oup.com/icb/article/65/4/932/8128833
[2] Phenological shifts in tropical flowering plants – https://journals.plos.org/plosone/article?id=10.1371%2Fjournal.pone.0342105
[3] Tropical flowering phenology herbarium data – https://pmc.ncbi.nlm.nih.gov/articles/PMC12935240/
[4] Timing is everything: an overview of phenological changes to plant-pollinator interactions – https://experts.arizona.edu/en/publications/timing-is-everything-an-overview-of-phenological-changes-to-plant/
[5] Redbud Phenology Project training – https://www.youtube.com/watch?v=dhTFpOD1zNU
[6] Century of wildflower data – https://northernwoodlands.org/articles/article/century-of-wildflower-data
[7] Tropical blooming weeks climate impacts – https://phys.org/news/2026-02-tropical-blooming-weeks-climate.html
[8] Climate change intensifying plant-pollinator mismatch – https://www.pnas.org/doi/10.1073/pnas.2506265122
[9] Phenology Week March 16-20, 2026 – http://www.usanpn.org/news/article/phenology-week-march-16-20-2026
