
The world's biodiversity is declining at an unprecedented rate, but a new global agreement offers hope—if field practitioners know exactly what to measure. Designing ecology surveys for the Kunming–Montreal Global Biodiversity Framework: what field practitioners actually need to measure has become the critical question for ecologists, surveyors, and conservation professionals working on projects that must demonstrate real contributions to reversing nature loss by 2030.
Adopted in December 2022, the Kunming–Montreal Global Biodiversity Framework (KMGBF) sets 23 ambitious targets for protecting and restoring nature by 2030. As of 2026, countries are submitting their 7th National Reports and updating National Biodiversity Strategies and Action Plans (NBSAPs). Yet analysis reveals a concerning gap: few countries have set national targets addressing even half the elements within any global target. This disconnect between global ambition and national implementation creates confusion for field practitioners who need clear, actionable survey protocols.
For biodiversity surveyors working on development projects, biodiversity net gain assessments, or conservation initiatives, understanding which metrics align with GBF targets is essential. The framework demands more than traditional species counts—it requires integrated measurements of ecosystem health, genetic diversity, and ecosystem services.
Key Takeaways
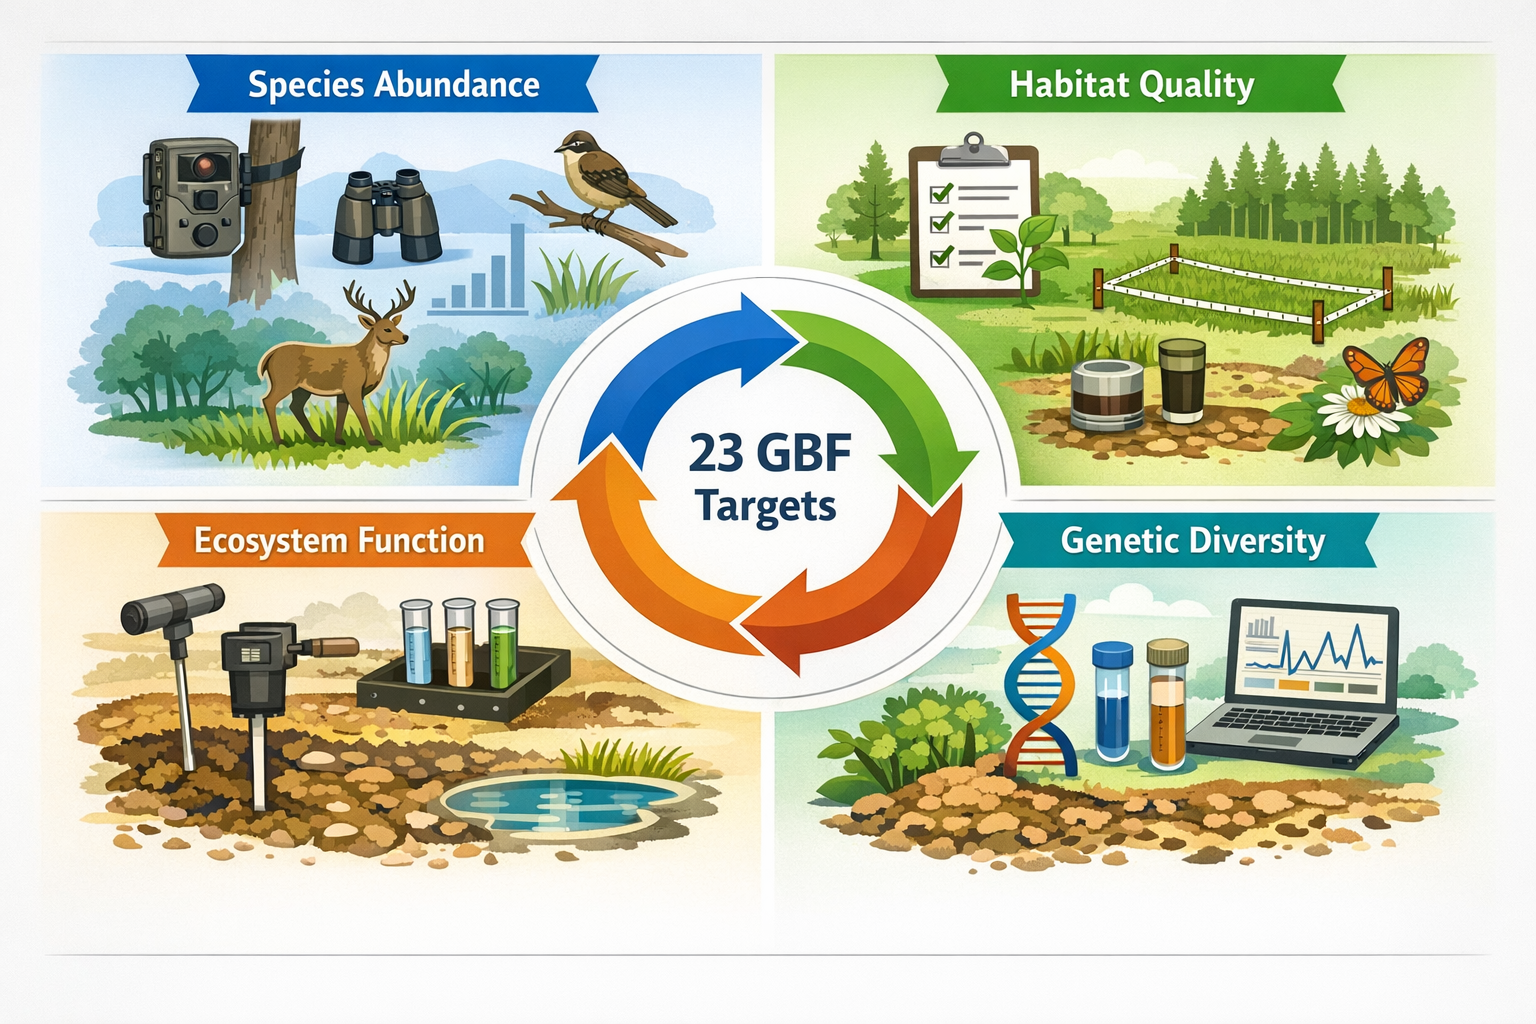
- 🎯 Target-Aligned Metrics: The KMGBF requires measuring four core dimensions—species abundance, habitat quality, ecosystem function, and genetic diversity—not just species presence/absence
- 📊 Baseline Documentation: Establishing robust baseline data in 2026 is critical for demonstrating progress toward 2030 targets and avoiding project delays
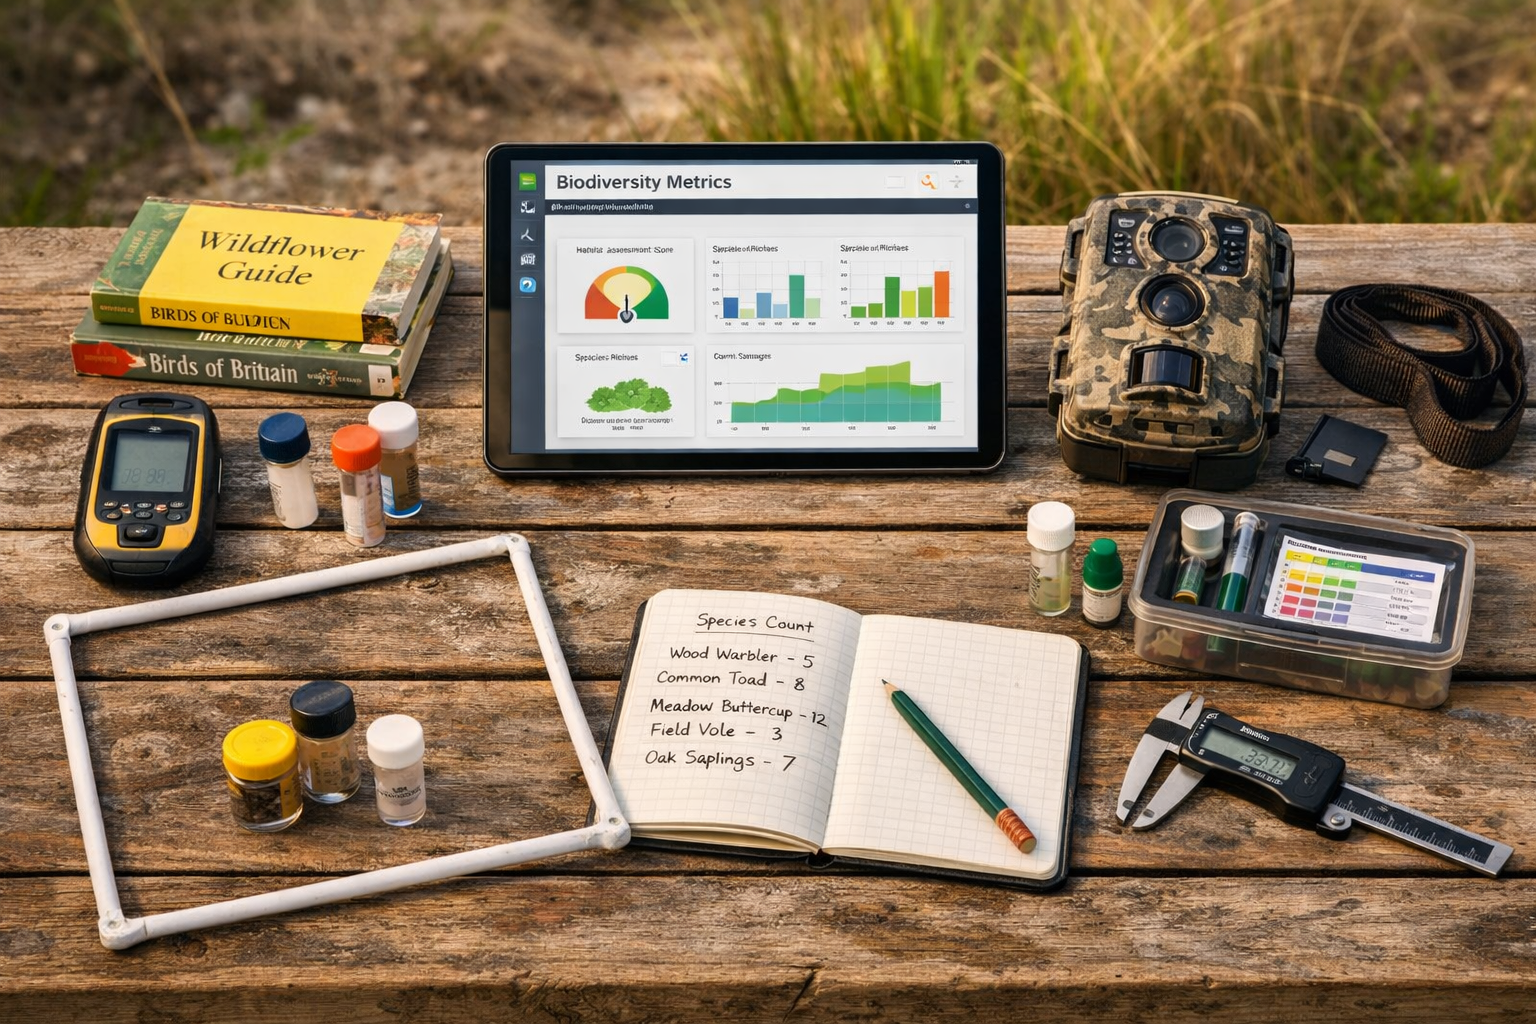
- 🔄 Integrated Approaches: Successful surveys combine traditional field methods with remote sensing, eDNA analysis, and citizen science to capture multiple biodiversity dimensions efficiently
- 📈 Temporal Monitoring: One-time surveys are insufficient; designing repeat measurement protocols enables tracking trends that demonstrate GBF contribution
- 🌍 Spatial Connectivity: Surveys must assess habitat connectivity and landscape-scale patterns, not just site-specific biodiversity values
Understanding the Kunming–Montreal Global Biodiversity Framework and Its Measurement Requirements
The KMGBF represents a paradigm shift from previous biodiversity agreements. Unlike the failed Aichi Targets (2011-2020), which focused primarily on protected area expansion, the new framework takes a holistic approach to nature recovery. For field practitioners, this means survey designs must capture multiple dimensions of biodiversity simultaneously.
The Four Pillars of GBF Measurement
The framework's 23 targets fall into four distinct categories, each requiring specific measurement approaches:
Pillar 1: Reducing Threats to Biodiversity 🛡️
Targets 1-8 focus on minimizing pressures like habitat loss, pollution, invasive species, and climate change. Field surveys must document threat intensity and distribution, not just biodiversity outcomes.
Pillar 2: Meeting People's Needs Through Sustainable Use 🌾
Targets 9-13 address sustainable management of wild species, agriculture, and urban areas. Practitioners need to measure ecosystem services alongside biodiversity metrics.
Pillar 3: Tools and Solutions for Implementation 🔧
Targets 14-23 cover protected areas, restoration, access and benefit-sharing, and finance. Survey data must support spatial planning and demonstrate restoration success.
Pillar 4: Implementation Support 💼
Cross-cutting targets require monitoring capacity, knowledge transfer, and equitable participation—demanding inclusive survey methodologies.
Key Targets That Drive Survey Design
Several targets have particularly significant implications for ecology survey design:
| Target | Measurement Focus | Survey Implications |
|---|---|---|
| Target 1 | Spatial planning for biodiversity | Habitat mapping, connectivity analysis, threat assessment |
| Target 2 | 30% of degraded ecosystems under restoration | Baseline condition assessment, restoration monitoring protocols |
| Target 3 | 30% of land and sea protected | Habitat quality within and outside protected areas |
| Target 4 | Species recovery and genetic diversity | Population monitoring, genetic sampling protocols |
| Target 8 | Climate change mitigation and adaptation | Carbon stock measurement, climate resilience indicators |
| Target 10 | Sustainable agriculture and aquaculture | Farmland biodiversity, pollinator surveys, soil health |
Understanding these targets helps practitioners prioritize which metrics matter most for their specific project context. For instance, a biodiversity net gain report supporting a development project should explicitly link survey findings to relevant GBF targets.
Designing Ecology Surveys for the Kunming–Montreal Global Biodiversity Framework: Core Metrics and Indicators
Translating global targets into field-ready survey protocols requires identifying specific, measurable indicators. The Convention on Biological Diversity has established a monitoring framework with headline indicators, component indicators, and complementary indicators—but field practitioners need practical guidance on what to actually measure.
Essential Biodiversity Variables (EBVs)
The Group on Earth Observations Biodiversity Observation Network (GEO BON) developed Essential Biodiversity Variables as standardized measurements that capture major dimensions of biodiversity change. These provide the scientific foundation for GBF-aligned surveys:
1. Species Populations 📊
- Species abundance: Population size and density estimates
- Species distribution: Occurrence records, range maps, occupancy models
- Species traits: Functional characteristics affecting ecosystem roles
2. Community Composition 🌿
- Taxonomic diversity: Species richness, evenness, diversity indices
- Community abundance: Relative abundance patterns across species
- Trait diversity: Functional diversity metrics
3. Ecosystem Structure 🏞️
- Live cover fraction: Vegetation cover, canopy density
- Ecosystem distribution: Habitat type extent and configuration
- Ecosystem vertical profile: Vegetation structure complexity
4. Ecosystem Function ⚙️
- Primary productivity: Biomass accumulation rates
- Nutrient retention: Soil health, water quality indicators
- Disturbance regime: Fire frequency, flooding patterns
5. Genetic Composition 🧬
- Genetic diversity: Allelic richness, heterozygosity
- Effective population size: Breeding population estimates
- Inbreeding: Genetic health indicators
Practical Measurement Protocols for Field Practitioners
Converting EBVs into field protocols requires selecting appropriate survey methods. Here's what practitioners should actually measure in 2026:
For Terrestrial Habitats:
✅ Vegetation Structure
- Quadrat sampling (1m² or 4m²) along transects for plant species composition
- Point-intercept method for ground cover percentage
- Vertical structure assessment using densiometers or LiDAR where available
✅ Invertebrate Diversity
- Pitfall trapping for ground-dwelling species (standardized trap-nights)
- Sweep netting for flying insects (standardized effort)
- Malaise traps for comprehensive flying insect sampling
- eDNA from soil samples for below-ground diversity
✅ Vertebrate Populations
- Camera trapping for mammals (minimum 30-day deployment)
- Point counts for birds (distance sampling protocol)
- Acoustic monitoring for bats and nocturnal species
- Amphibian breeding surveys at aquatic features
✅ Habitat Quality Indicators
- Soil pH, organic matter content, and compaction
- Deadwood volume and decay stage distribution
- Water quality parameters (pH, dissolved oxygen, turbidity)
- Connectivity metrics using landscape analysis tools
For Aquatic Ecosystems:
✅ Water Quality Baseline
- Physico-chemical parameters (temperature, pH, conductivity, dissolved oxygen)
- Nutrient levels (nitrogen, phosphorus)
- Macroinvertebrate biotic indices (BMWP, ASPT scores)
✅ Aquatic Biodiversity
- Fish community surveys using electrofishing or netting
- Macrophyte surveys (percentage cover, species composition)
- eDNA water sampling for comprehensive species detection
Linking Survey Data to GBF Targets
The critical step many practitioners miss is explicitly connecting their measurements to specific GBF targets. When conducting a biodiversity impact assessment, create a clear matrix showing:
- Which targets your project affects (positive or negative)
- Which indicators you're measuring for each relevant target
- Baseline values and target thresholds for 2030
- Monitoring frequency to track progress
This approach transforms generic ecology surveys into GBF-aligned monitoring programs that demonstrate corporate or national contributions to global biodiversity goals.
Implementing Field-Ready Survey Protocols: Tools, Technologies, and Best Practices
With clear metrics identified, the next challenge is implementing efficient, cost-effective survey protocols that generate GBF-aligned data. Field practitioners in 2026 have access to powerful technologies that weren't available during previous biodiversity frameworks.
Technology Integration for Efficient Data Collection
Remote Sensing and GIS Integration 🛰️
Modern biodiversity surveys should combine ground-truthing with remote sensing data:
- Satellite imagery analysis: Use freely available Sentinel-2 or Landsat data to map habitat extent and detect changes over time
- Drone surveys: Capture high-resolution imagery for vegetation structure analysis and hard-to-access areas
- LiDAR data: Assess vertical habitat structure and biomass without extensive field measurements
- Habitat connectivity modeling: Use tools like Circuitscape or Linkage Mapper to assess landscape permeability
Environmental DNA (eDNA) Sampling 🧪
eDNA has revolutionized biodiversity detection efficiency:
- Water samples: Detect aquatic species presence from filtered water samples
- Soil samples: Reveal below-ground biodiversity including fungi, invertebrates, and plant roots
- Air samples: Emerging technology for detecting pollen and airborne environmental DNA
- Cost-effectiveness: One eDNA sample can detect dozens of species versus days of traditional surveys
Acoustic Monitoring 🎵
Automated acoustic recorders capture biodiversity data 24/7:
- Bat detectors: Full-spectrum or zero-crossing units for bat activity and species identification
- Bird song recorders: AudioMoth or similar devices for continuous avian monitoring
- Amphibian calls: Targeted recording during breeding seasons
- Analysis software: Use BirdNET, Kaleidoscope, or similar AI-powered tools for automated species identification
Camera Trapping Networks 📷
Motion-activated cameras provide robust mammal and bird data:
- Standardized deployment: Minimum 30-day periods, consistent camera heights and settings
- Grid or targeted placement: Systematic grids for population estimates or targeted placement at features
- AI-assisted identification: Platforms like Wildlife Insights automate species classification
- Occupancy modeling: Analyze detection/non-detection data for population trends
Designing Sampling Strategies for GBF Alignment
The sampling design determines whether your survey data can answer GBF-relevant questions. Consider these approaches:
Stratified Random Sampling 📐
Divide your study area into habitat types or condition classes, then randomly sample within each stratum. This ensures representation across all ecosystem types and enables habitat-specific analysis.
Gradient-Based Sampling 📈
Place survey points along environmental gradients (e.g., distance from development, elevation, moisture) to understand how biodiversity responds to environmental variables—critical for climate change adaptation (Target 8).
Before-After-Control-Impact (BACI) Design 🔄
For restoration or development projects, establish control sites alongside impact sites and survey both before and after intervention. This robust design demonstrates causation, not just correlation.
Temporal Replication ⏰
GBF targets focus on 2030 outcomes, requiring repeat surveys:
- Annual surveys: For rapidly changing systems or high-priority sites
- Biennial or triennial: For slower-changing habitats or budget-constrained projects
- Seasonal variation: Multiple surveys within years to capture phenological differences
Quality Assurance and Data Standards
Survey data only contributes to GBF monitoring if it meets quality standards:
Taxonomic Accuracy ✅
- Use qualified ecologists with relevant taxonomic expertise
- Photograph or collect voucher specimens for verification
- Submit records to national biodiversity data centers
- Participate in inter-observer reliability testing
Data Management 💾
- Record data digitally in the field using tablets or smartphones
- Follow Darwin Core standards for biodiversity data formatting
- Include essential metadata: survey effort, weather conditions, observer identity
- Archive data in accessible repositories (GBIF, national biodiversity networks)
Uncertainty Quantification 📊
- Report detection probabilities, not just presence/absence
- Calculate confidence intervals for abundance estimates
- Document survey limitations and potential biases
- Use occupancy models that account for imperfect detection
Cost-Effective Survey Design
Budget constraints are real. Optimize survey efficiency through:
Multi-Taxa Surveys 🦋🦎🐦
Design field visits to sample multiple taxonomic groups simultaneously rather than separate specialist surveys.
Citizen Science Integration 👥
Engage volunteers for data collection on common species, freeing professional time for specialist surveys. Platforms like iNaturalist provide quality-controlled species records.
Tiered Approach 🎯
Conduct rapid assessments across large areas to identify priority sites, then intensive surveys at key locations.
Technology Investment 💡
Initial costs for camera traps, acoustic recorders, or eDNA equipment are offset by reduced field time and improved detection rates over multiple years.
For practitioners working on biodiversity net gain projects, these efficient approaches ensure comprehensive baseline data without excessive costs.
Translating Survey Results into GBF Contributions and Reporting
Collecting high-quality biodiversity data is only half the challenge. Field practitioners must translate survey results into meaningful contributions to GBF targets and communicate these effectively to stakeholders, regulators, and national reporting mechanisms.
Calculating Biodiversity Metrics from Field Data
Raw survey data requires analysis to generate GBF-relevant indicators:
Diversity Indices 📐
- Shannon-Wiener Index: Measures species diversity accounting for richness and evenness
- Simpson's Index: Probability two randomly selected individuals are different species
- Berger-Parker Index: Dominance of the most abundant species
Population Trend Analysis 📈
- Occupancy modeling: Estimate site occupancy while accounting for detection probability
- Distance sampling: Calculate population density from point count or transect data
- Mark-recapture: Estimate population size for individually identifiable species
Habitat Quality Scores 🌿
- Condition assessment: Compare current state to reference conditions
- Distinctiveness ratings: Classify habitats by conservation importance
- Strategic significance: Assess connectivity and landscape context
For UK practitioners, these metrics feed directly into biodiversity net gain calculations, demonstrating how local projects contribute to national GBF commitments.
Linking Project-Level Data to National and Global Targets
Creating explicit linkages between your survey findings and GBF targets strengthens project justification and regulatory approval:
Direct Target Contributions ✅
Identify which targets your project directly supports:
- Restoration projects: Contribute to Target 2 (30% of degraded ecosystems under restoration)
- Protected area management: Support Target 3 (30% effective conservation)
- Sustainable agriculture: Advance Target 10 (sustainable food production)
- Urban biodiversity: Contribute to Target 12 (urban green space)
Indicator Alignment 📊
Map your survey metrics to official GBF indicators:
- Red List Index: Submit rare species records to inform national assessments
- Species Habitat Index: Habitat quality data contributes to national aggregations
- Ecosystem extent: Habitat mapping feeds into national ecosystem accounts
Spatial Data Contribution 🗺️
Georeferenced survey data supports national spatial planning:
- Submit species occurrence data to national biodiversity networks
- Share habitat maps with local planning authorities
- Contribute to ecological network mapping
- Inform protected area gap analyses
Reporting Frameworks and Standards
Multiple reporting frameworks now require GBF alignment:
Corporate Biodiversity Reporting 🏢
The Taskforce on Nature-related Financial Disclosures (TNFD) requires companies to:
- Assess dependencies and impacts on nature
- Set science-based targets aligned with GBF
- Report progress using standardized metrics
- Disclose nature-related risks and opportunities
Survey data provides the evidence base for TNFD reporting, particularly for companies with direct land management responsibilities.
National Reporting Obligations 🌍
Countries submit National Reports to the CBD Secretariat using standardized templates. Project-level survey data aggregates to inform:
- 7th National Reports (submitted February 2026)
- National Biodiversity Strategies and Action Plans (updated regularly)
- Global Stocktake (comprehensive review in 2026)
Development Planning Integration 🏗️
For practitioners working with developers, biodiversity plans should explicitly reference GBF contributions:
- Demonstrate how proposed enhancements support specific targets
- Quantify contributions to national biodiversity goals
- Show alignment with local biodiversity action plans
- Link to broader landscape-scale conservation strategies
Communicating Biodiversity Value to Non-Specialists
Survey results must be accessible to planners, developers, and decision-makers who lack ecological expertise:
Visual Communication 🎨
- Create habitat maps with clear legends and condition ratings
- Use infographics showing species diversity comparisons
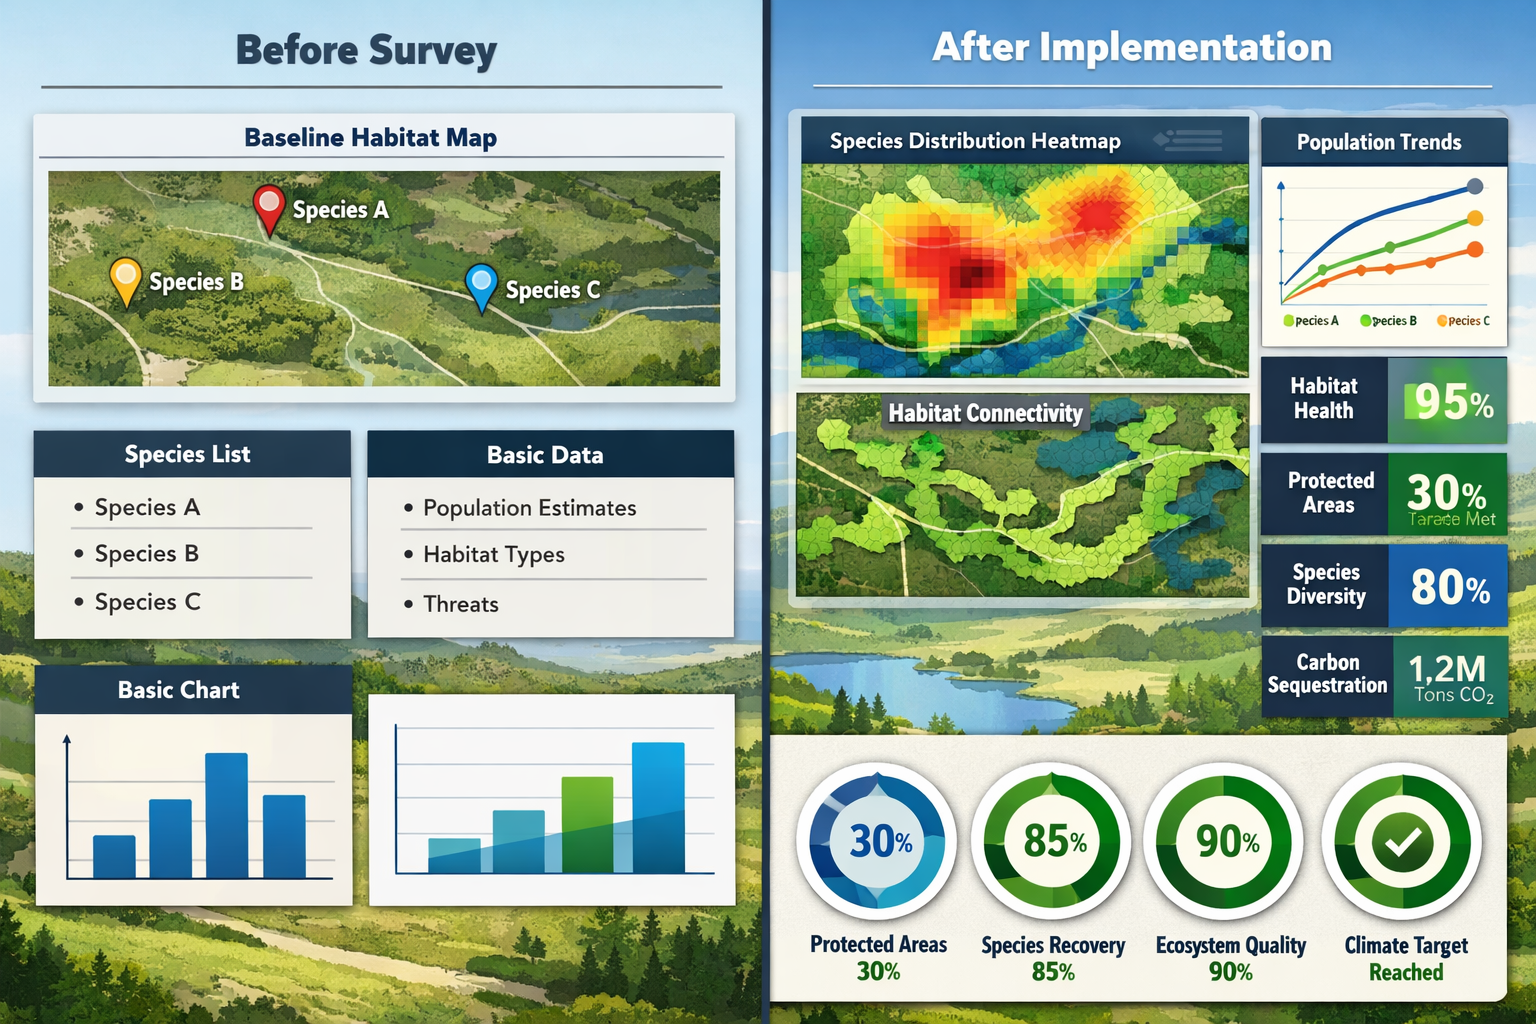
- Develop before/after visualizations for restoration projects
- Include photographs of key species and habitats
Plain Language Summaries 📝
- Avoid technical jargon in executive summaries
- Explain ecological significance in terms of ecosystem services
- Relate findings to local and national biodiversity priorities
- Highlight rare or protected species in accessible language
Quantified Contributions 🔢
- Express results in standardized units (biodiversity units, habitat hectares)
- Calculate percentage contributions to regional/national targets
- Show cost-effectiveness of different conservation interventions
- Demonstrate return on investment for biodiversity spending
Understanding what planners need to know about biodiversity net gain helps ecologists communicate effectively with decision-makers.
Adaptive Management Based on Survey Results
GBF alignment requires ongoing monitoring and adaptive management:
Threshold-Based Management 🎯
- Define biodiversity thresholds that trigger management responses
- Establish early-warning indicators of ecosystem degradation
- Create decision trees linking monitoring results to actions
Iterative Survey Design 🔄
- Refine survey protocols based on initial results
- Focus effort on indicators showing greatest change
- Adjust sampling intensity based on precision requirements
- Incorporate new technologies as they become available
Long-Term Monitoring Programs ⏳
- Establish permanent monitoring plots for repeat surveys
- Create photographic monitoring points for visual change detection
- Maintain consistent methodology to enable trend analysis
- Archive data and protocols for future practitioners
Overcoming Common Challenges in GBF-Aligned Survey Design
Field practitioners implementing GBF-aligned surveys face practical challenges that theoretical frameworks often overlook. Addressing these obstacles ensures survey programs deliver useful data despite real-world constraints.
Challenge 1: Limited Taxonomic Expertise
The Problem: Comprehensive biodiversity assessment requires expertise across multiple taxonomic groups, but most ecologists specialize in one or two taxa. Identifying invertebrates, fungi, or bryophytes to species level is particularly challenging.
Solutions:
- Morphospecies approach: Group organisms into recognizable units without species-level identification
- eDNA metabarcoding: Send samples to specialized laboratories for molecular identification
- Specialist partnerships: Collaborate with taxonomic experts for specimen identification
- Indicator groups: Focus on well-studied taxa that correlate with overall biodiversity
- Training investment: Upskill team members through workshops and online courses
Challenge 2: Balancing Comprehensiveness with Budget
The Problem: Comprehensive multi-taxa surveys across large areas with frequent repeat visits exceed most project budgets.
Solutions:
- Risk-based approach: Intensive surveys at high-value or high-risk areas, rapid assessments elsewhere
- Phased implementation: Establish baseline in Year 1, targeted monitoring in subsequent years
- Technology substitution: Replace labor-intensive methods with automated recording devices
- Shared resources: Coordinate with neighboring projects to share equipment and expertise
- Volunteer engagement: Citizen science for common species, professionals for rarities
For developers managing costs, understanding biodiversity unit pricing helps budget appropriately for survey requirements.
Challenge 3: Temporal Variability and Survey Timing
The Problem: Biodiversity varies seasonally and annually. Single-season surveys miss species and fail to capture population dynamics.
Solutions:
- Multi-season protocols: Survey during spring, summer, and autumn to capture phenological variation
- Weather contingencies: Build flexibility into survey schedules for unsuitable conditions
- Historical data integration: Combine current surveys with existing records to understand trends
- Predictive modeling: Use species distribution models to estimate presence during unsurveyable periods
Challenge 4: Demonstrating Causation vs. Correlation
The Problem: Biodiversity changes may result from factors unrelated to your project, making it difficult to demonstrate project contributions to GBF targets.
Solutions:
- Control sites: Establish reference sites with similar characteristics but no intervention
- Before-After-Control-Impact design: Survey both impact and control sites before and after intervention
- Statistical analysis: Use appropriate models that account for confounding variables
- Long-term datasets: Extended monitoring periods strengthen causal inference
Challenge 5: Data Accessibility and Interoperability
The Problem: Survey data stored in proprietary formats or inaccessible databases cannot contribute to national or global biodiversity monitoring.
Solutions:
- Open data standards: Use Darwin Core or similar standardized formats
- Public repositories: Submit data to GBIF, NBN Atlas, or national biodiversity networks
- Metadata documentation: Include comprehensive information about survey methods and limitations
- Creative Commons licensing: Use appropriate licenses that enable data sharing while protecting intellectual property
Challenge 6: Aligning with Multiple Frameworks
The Problem: Projects must simultaneously address GBF targets, national legislation (e.g., biodiversity net gain), corporate sustainability goals, and local planning requirements.
Solutions:
- Integrated survey design: Identify metrics that satisfy multiple frameworks simultaneously
- Hierarchical target mapping: Show how local objectives nest within national and global goals
- Flexible reporting templates: Design data collection to enable multiple output formats
- Stakeholder alignment: Engage all parties early to identify shared priorities
Practitioners navigating biodiversity net gain requirements alongside GBF alignment benefit from integrated planning approaches.
Future Directions: Emerging Approaches for GBF Monitoring
As we progress toward the 2030 deadline, survey methodologies continue to evolve. Field practitioners should watch these emerging trends:
Artificial Intelligence and Machine Learning 🤖
- Automated species identification from images and sounds
- Predictive modeling of biodiversity responses to interventions
- Real-time analysis of camera trap and acoustic data
- Pattern recognition in complex ecological datasets
Satellite-Based Ecosystem Monitoring 🛰️
- High-resolution habitat mapping from commercial satellite constellations
- Vegetation health indices for ecosystem condition assessment
- Change detection algorithms for rapid threat identification
- Integration with ground-based survey data for validation
Genomic Approaches 🧬
- Environmental DNA for comprehensive biodiversity inventories
- Population genomics for genetic diversity assessment
- Functional gene analysis for ecosystem function monitoring
- Microbiome analysis for soil and water health indicators
Citizen Science Expansion 👥
- Mobile apps for real-time biodiversity data collection
- Quality assurance through AI-assisted identification verification
- Gamification to increase participation and data volume
- Integration with professional survey programs
Integrated Monitoring Platforms 💻
- Cloud-based data management systems linking multiple survey types
- Real-time dashboards showing progress toward biodiversity targets
- Automated reporting aligned with multiple frameworks
- Predictive analytics for adaptive management
Conclusion
Designing ecology surveys for the Kunming–Montreal Global Biodiversity Framework: what field practitioners actually need to measure requires a fundamental shift from traditional biodiversity assessment. The KMGBF demands integrated measurements across species populations, ecosystem structure, ecosystem function, and genetic diversity—all tracked over time to demonstrate contributions to ambitious 2030 targets.
Field practitioners in 2026 stand at a critical juncture. With the 7th National Reports submitted and countries updating their NBSAPs, the next four years will determine whether the world achieves the "living in harmony with nature" vision by 2030. Every ecology survey conducted today contributes to—or detracts from—this global goal.
Key Actions for Field Practitioners
Immediate Steps ⚡
- Review your current survey protocols against GBF targets to identify gaps
- Establish robust baselines now to enable meaningful trend detection by 2030
- Invest in technology (eDNA, acoustic recorders, camera traps) that improves detection efficiency
- Standardize data collection using Darwin Core or similar interoperable formats
- Submit existing data to national biodiversity networks to contribute to baseline assessments
Medium-Term Planning 📅
- Design repeat survey programs with consistent methodology for trend analysis
- Build taxonomic capacity through training, partnerships, or molecular approaches
- Integrate remote sensing with ground-truthing for landscape-scale assessment
- Engage stakeholders to align survey objectives with multiple reporting frameworks
- Document methods thoroughly to enable future practitioners to continue monitoring
Long-Term Commitment 🌍
- Contribute to national monitoring by sharing data through official channels
- Adapt survey designs based on emerging technologies and refined target indicators
- Demonstrate impact by explicitly linking project outcomes to GBF targets
- Advocate for resources to maintain long-term monitoring programs
- Mentor next generation of ecologists in GBF-aligned survey approaches
The Path Forward
The Kunming–Montreal Global Biodiversity Framework represents humanity's best chance to halt and reverse biodiversity loss. But global targets only succeed through countless local actions—each development project that achieves biodiversity net gain, each restoration initiative that enhances ecosystem function, each protected area that maintains genetic diversity.
Field practitioners hold the key. The surveys designed and implemented in 2026 will generate the evidence base for the 2026 Global Stocktake and inform adaptive management through 2030. By measuring what truly matters—not just what's easy to count—ecologists transform global ambition into local reality.
The question is no longer whether to align with the GBF, but how to do so efficiently, cost-effectively, and rigorously. This article provides the roadmap. The implementation is up to you.
Start today. Design surveys that matter. Measure what counts. Contribute to the global effort to live in harmony with nature.
