
Across Europe, average spring temperatures have advanced by more than two weeks compared to mid-twentieth-century baselines — and the species that once defined familiar landscapes are quietly moving with them. For biodiversity surveyors working on Biodiversity Net Gain (BNG) projects in 2026, understanding species distribution shifts due to climate change and the tracking protocols required to monitor them is no longer optional. It is a professional and regulatory necessity.
This article sets out the current state of knowledge on climate-driven range shifts, explains why static survey grids are no longer fit for purpose, and provides a practical framework of GIS-enabled transect methods and dynamic monitoring protocols that ecologists can apply to baseline and track shifting ranges within BNG and wider conservation projects.
Key Takeaways
- At least 59% of documented species range shifts align with climate change predictions, yet many species move in unexpected directions, demanding multi-factor survey designs [2]
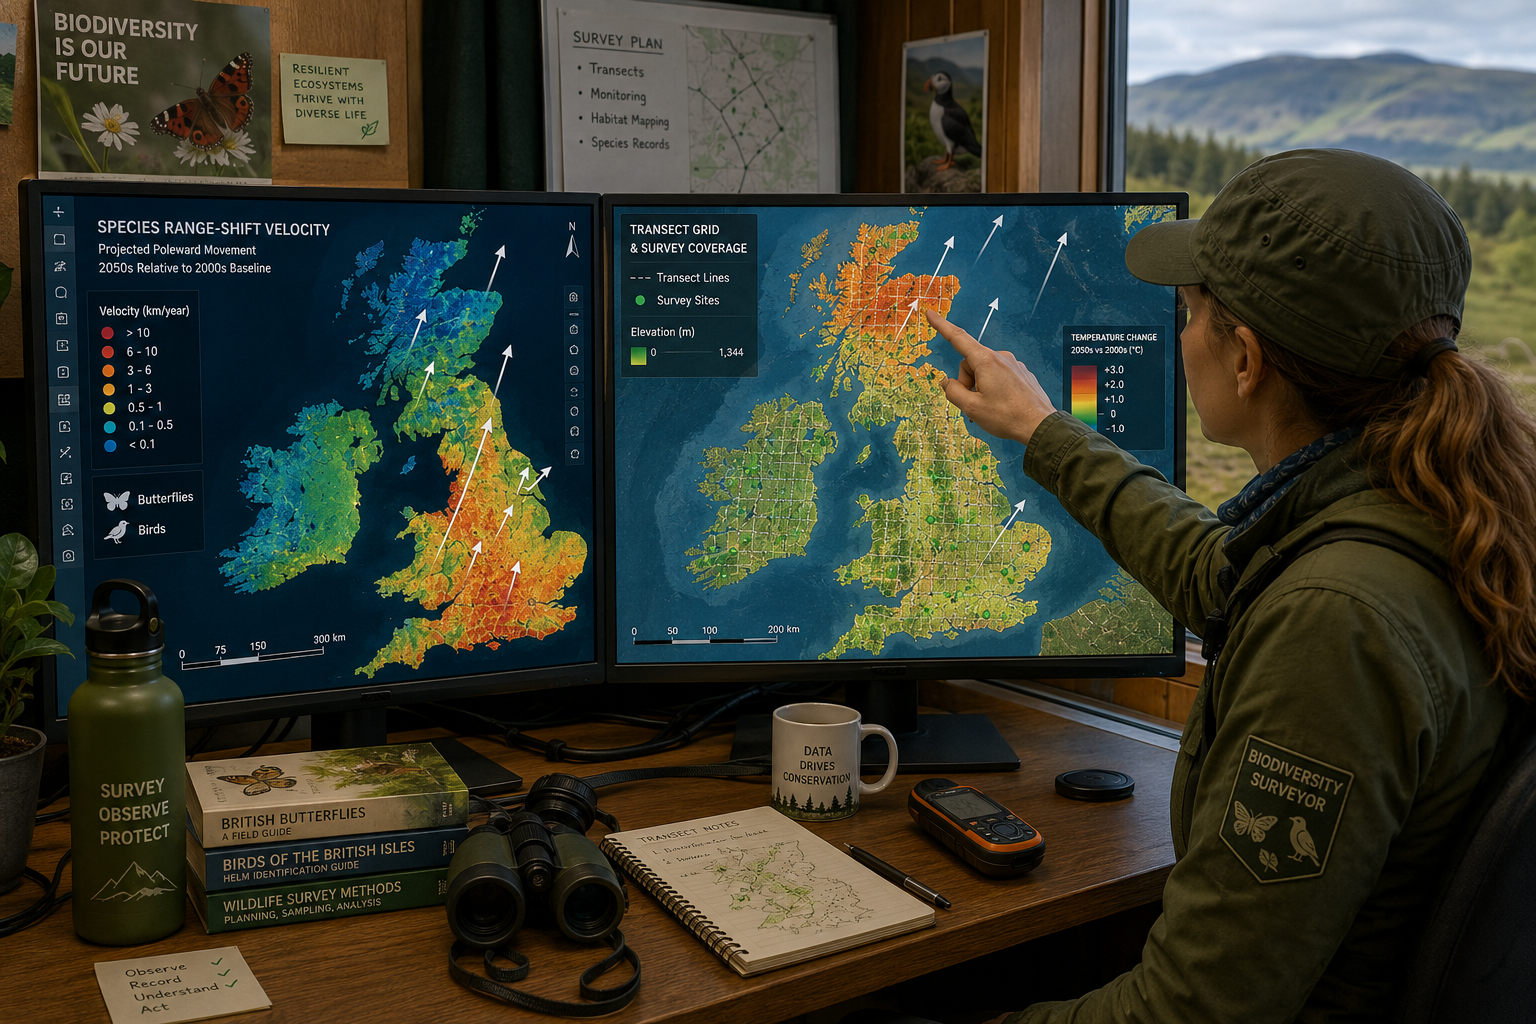
- Climate velocity mapping — combining spatial temperature data with species occurrence records — is now a core tool for anticipating and tracking range shifts in BNG sites [1]
- Dynamic, GIS-referenced transect grids replace fixed-point surveys as the gold standard for detecting poleward and elevational range movements
- Phenological monitoring must be integrated alongside distribution surveys to capture the full picture of climate-driven ecological change [8]
- Surveyors who embed adaptive capacity assessments into BNG planning can future-proof habitat designs against ongoing climate trajectories [6]
Why Static Survey Grids Fail in a Changing Climate
Traditional biodiversity survey methods were designed for a relatively stable ecological baseline. Fixed transects, permanent quadrats, and historical reference points assume that the species assemblages present at a site today will broadly resemble those present in five or ten years. Climate change has invalidated that assumption.
Climate velocity — the rate at which a species must move to track its preferred climate envelope — varies dramatically by landscape and taxon. In flat lowland areas, species may need to shift hundreds of kilometres poleward per decade. In mountain terrain, a vertical ascent of just a few hundred metres can achieve the same thermal shift. A 2024 review compiled in the Contractions and Range Expansions (CoRE) Database, drawing on 315 studies, confirms that species are actively redistributing in response to these pressures, though the direction and speed of movement often diverge from simple temperature-based predictions [3].
The core problem with static grids is threefold:
- They record presence or absence at fixed coordinates, missing leading-edge colonisation events at range margins
- They undercount range contractions at trailing edges where species are quietly disappearing
- They cannot detect the velocity or direction of movement without repeat surveys at spatially offset locations
For surveyors delivering biodiversity net gain assessments, this matters enormously. A habitat scored highly today may lose its target species within the 30-year BNG commitment window if climate trajectories are not factored into the baseline.
Understanding the Mechanisms Behind Species Range Shifts
Before designing a tracking protocol, surveyors need a firm grasp of why species move — and why some do not move as expected.
Temperature Is Not the Only Driver
The 2024 USGS review of species redistribution mechanisms found that while the majority of documented shifts align with warming temperatures, a substantial minority move in directions inconsistent with temperature-only models [2]. Contributing factors include:
- Precipitation and moisture regimes: Many invertebrates and amphibians track humidity gradients as closely as temperature
- Phenological mismatches: A species may arrive in a new area but fail to establish if its food source has shifted its own timing independently [8]
- Habitat barriers: Even thermally suitable land may be inaccessible if fragmented by urban development or intensive agriculture
- Species interactions: Predator-prey dynamics, pollinator dependencies, and competitive exclusion all modulate whether a species can colonise newly suitable habitat
Population Trends Affect Tracking Ability
Research from the US Forest Service highlights a critical asymmetry: species with growing populations are far more likely to successfully track climate change by expanding into newly suitable areas, while declining species show greater "niche unfilling" — they fail to colonise available habitat even when it becomes thermally appropriate [7]. This means that a surveyor monitoring a declining species cannot assume range shift will occur even if climate models predict it should.
Adaptive Capacity Varies by Species
A USGS framework for evaluating adaptive capacity distinguishes between species that can persist in place through physiological or behavioural plasticity and those that must shift in space to survive [6]. Surveyors should apply this framework during baseline assessments to categorise target species and design monitoring intensity accordingly. Species with low adaptive capacity and declining populations warrant the most intensive tracking effort.
Species Distribution Shifts Due to Climate Change: Tracking Protocols for Biodiversity Surveyors in 2026
The following protocol framework reflects current best practice for surveyors working on BNG sites and wider ecological monitoring programmes in 2026. It integrates GIS-enabled transect design, climate velocity mapping, and standardised phenological recording.
Step 1: Establish a Climate-Informed Baseline
A robust baseline goes beyond a species list. It must capture spatial, temporal, and climatic context.
Required data layers:
| Data Type | Collection Method | Minimum Resolution |
|---|---|---|
| Species occurrence | GPS-referenced point records | 10m grid |
| Temperature | In-situ loggers + gridded climate data | Monthly averages |
| Soil moisture | Capacitance sensors at representative plots | Weekly readings |
| Habitat structure | UAV-derived canopy height models | 0.5m |
| Genetic diversity | eDNA sampling at key populations | Per population |
Temperature loggers and soil moisture sensors should be installed at the start of any BNG project and left in place for the full monitoring period. GPS-referenced species occurrence mapping must record not just presence but abundance class, reproductive status, and microhabitat association [1].
Step 2: Build GIS-Enabled Dynamic Transect Grids
The core innovation in 2026 tracking protocols is the shift from fixed transects to dynamic, climate-velocity-aligned transect grids. Rather than running transects along convenient landscape features, surveyors orient transects along predicted velocity vectors — the directions in which species are expected to move.
Protocol for dynamic transect design:
- Download regional climate velocity maps from national datasets (e.g., UK Met Office UKCP18 projections)
- Overlay species distribution models for target taxa to identify range margins
- Orient primary transects perpendicular to range margin contours, with secondary transects parallel to predicted movement vectors
- Extend transect endpoints 500m beyond current known range limits to detect leading-edge colonisation
- Assign each transect a unique GIS identifier linked to the species occurrence database
- Set revisit intervals based on species mobility: annual for birds and mobile invertebrates, biennial for plants and slow-dispersing invertebrates
This approach directly supports the corridor identification work required for biodiversity net gain delivery, ensuring that habitat connectivity is designed around actual movement pathways rather than assumed ones.
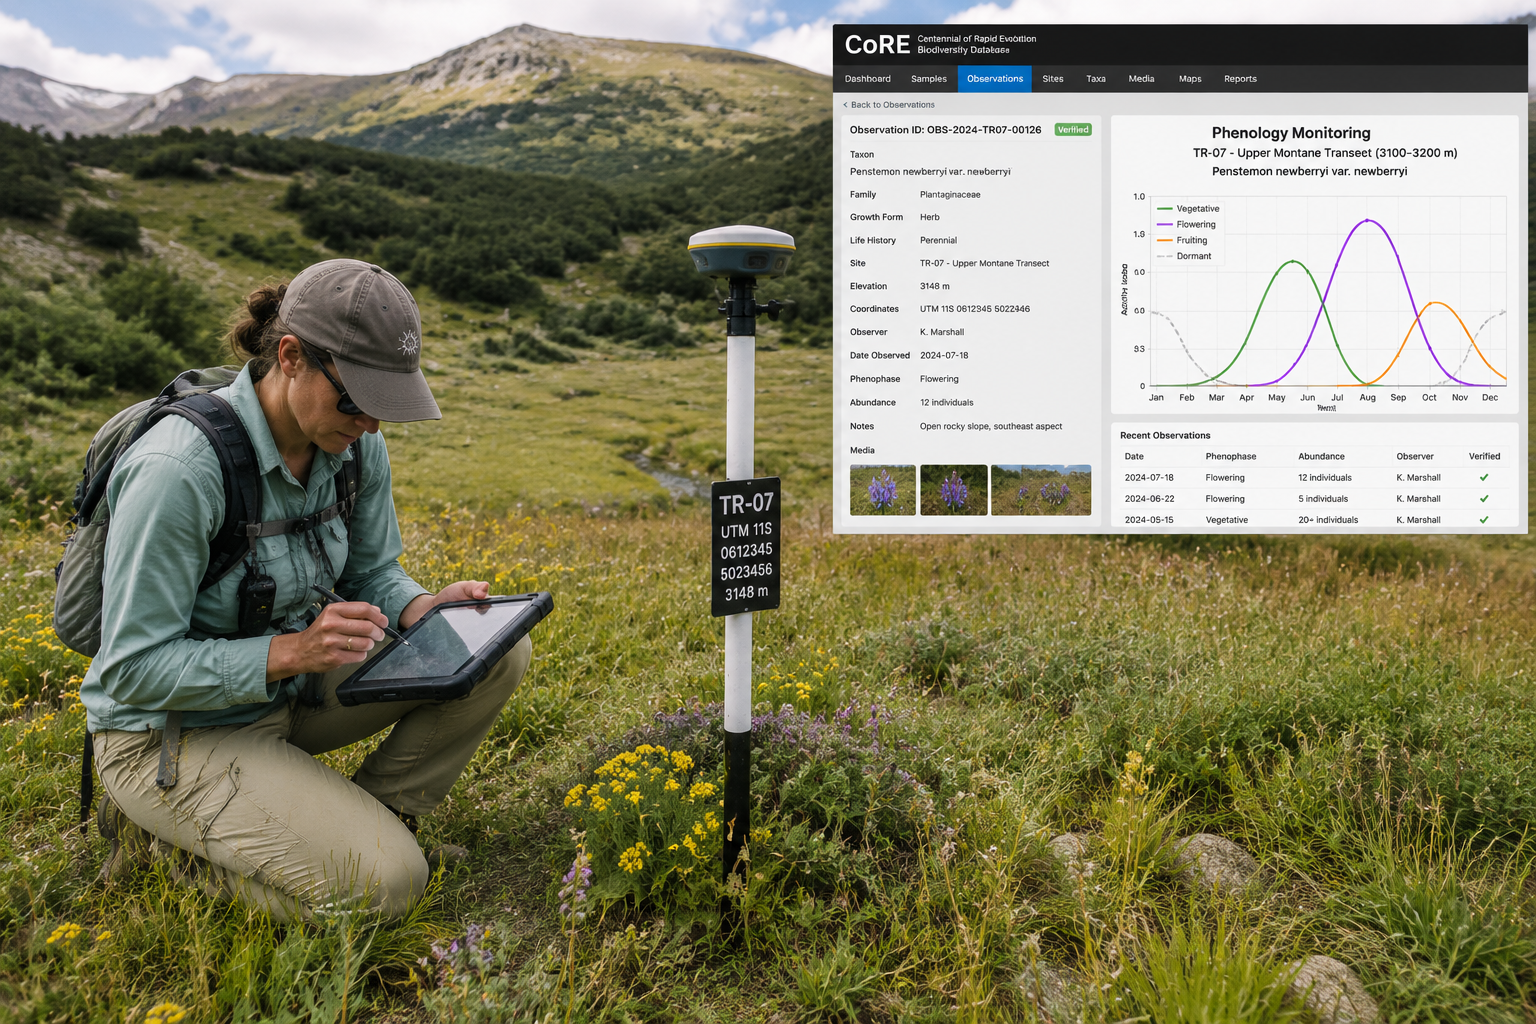
Step 3: Apply Standardised Phenological Monitoring
Distribution shifts and phenological shifts are two sides of the same climate-change coin. A species may appear stable in its range while experiencing severe phenological disruption that undermines its long-term viability.
The USA National Phenology Network's standardised protocols provide a replicable framework for recording:
- First flowering and leaf-out dates for key plant species
- First adult emergence for target invertebrates
- Breeding season onset for birds and amphibians [8]
Surveyors should record phenological events at each transect visit and link records to the same GIS database as occurrence data. Over time, this creates a multi-dimensional dataset that distinguishes genuine range shifts from phenological anomalies.
Step 4: Use Elevation Gradients as Natural Experiments
Mountain and upland sites offer a powerful monitoring opportunity. The Mountain Invasion Research Network (MIREN) has demonstrated that standardised surveys along elevation gradients can detect community turnover and range shifts with high sensitivity, because the compressed thermal gradient amplifies climate signals over short distances [4].
For surveyors working on upland BNG sites or hillside development projects, MIREN-style elevation transects — running from valley floor to summit ridge at fixed altitudinal intervals — provide early warning of range shifts that will later manifest across broader lowland landscapes.
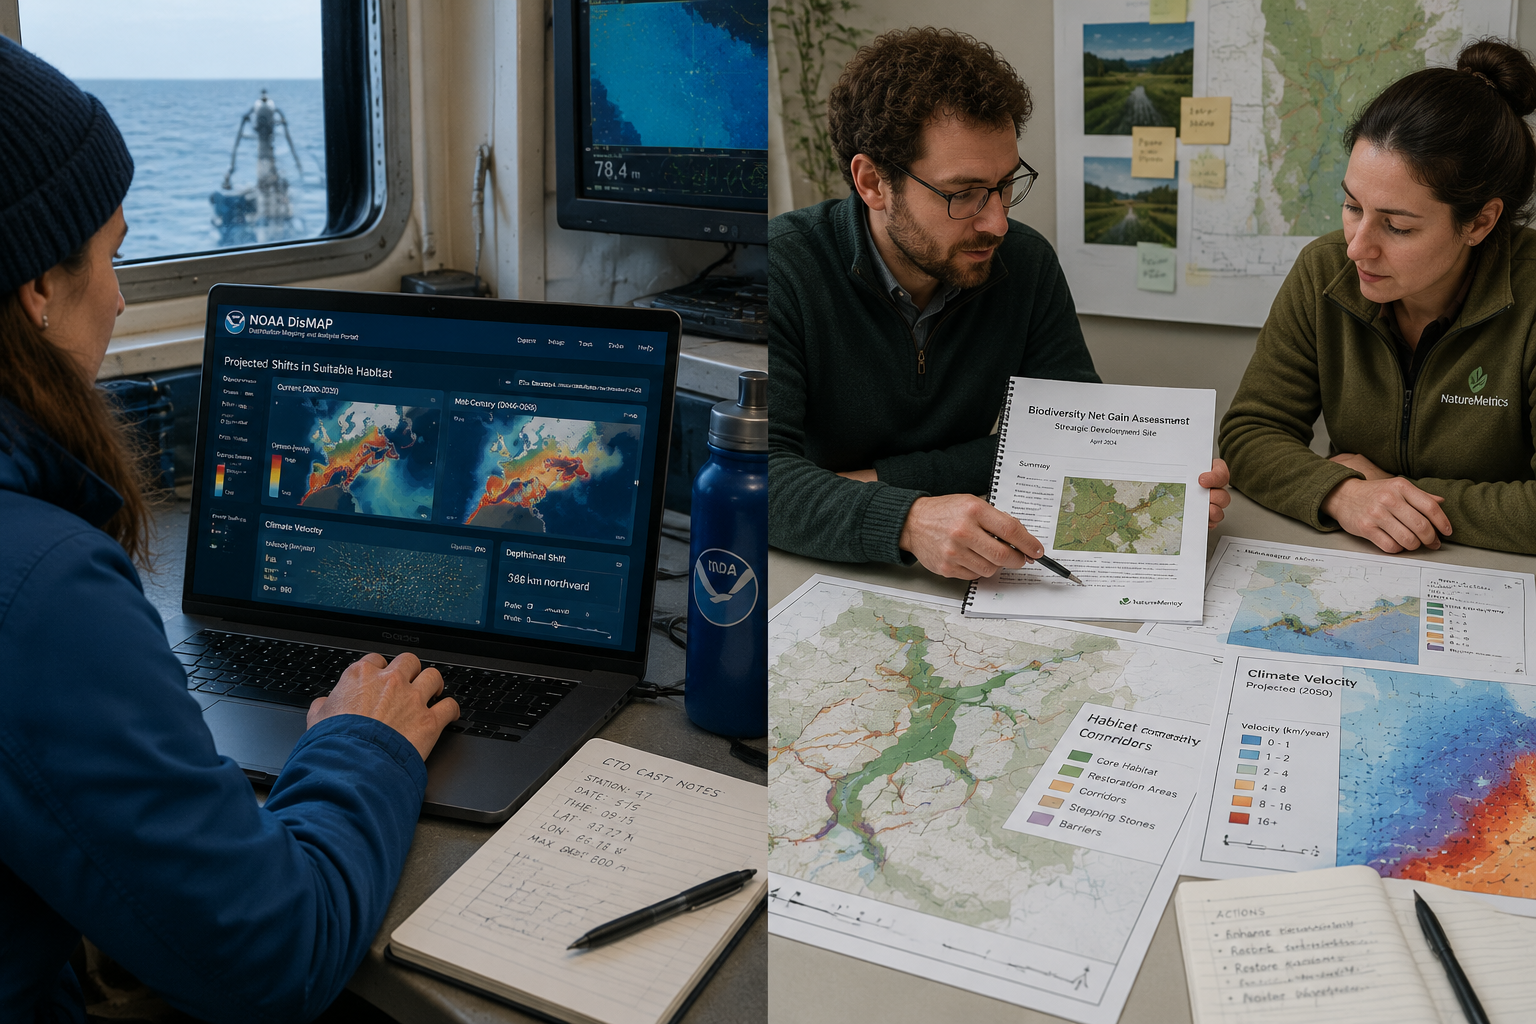
Step 5: Integrate the CoRE Database and DisMAP Portal
Two publicly available tools should be embedded in every surveyor's workflow in 2026:
- CoRE Database: The Contractions and Range Expansions database compiles 315 studies on climate-induced range shifts [3]. Surveyors can query it to find comparable species and regions, setting realistic expectations for shift rates and directions before fieldwork begins
- NOAA DisMAP Portal: For coastal and marine BNG projects, NOAA's Distribution Mapping and Analysis Portal provides species persistence metrics, single-species shift summaries, and regional trend data for marine taxa [5]. This is particularly valuable for intertidal and estuarine habitat assessments
Embedding Tracking Protocols into BNG Project Planning
Species distribution shifts due to climate change: tracking protocols for biodiversity surveyors in 2026 must be embedded at the project planning stage, not retrofitted after baseline surveys are complete.
When creating a biodiversity plan for a development project, the following climate-adaptive elements should be included from the outset:
Habitat connectivity corridors should be mapped using velocity vector data to ensure they align with predicted movement pathways, not just current species distributions. A corridor that connects two woodland blocks today may be misaligned with the direction of species movement within 15 years.
Enhanced monitoring schedules are critical in the first decade of a BNG project, when rapid range shifts are most likely to occur and when early intervention can still redirect habitat management [1]. Surveyors should specify at least annual visits for mobile species during years one to ten, reducing to biennial thereafter if trends are stable.
Genetic diversity considerations should inform species selection for habitat creation. Sourcing plant material from populations at the warmer edge of a species' current range increases the likelihood that the resulting habitat remains suitable as temperatures rise [1].
For developers and planners working through the biodiversity net gain process, understanding these requirements early helps avoid costly redesigns. Surveyors who can present climate velocity data alongside standard habitat condition assessments provide significantly more robust evidence for planning applications.
It is also worth noting the intersection with biodiversity credits and offset markets. Habitats designed with climate trajectory in mind — incorporating connectivity corridors and thermally appropriate species assemblages — are likely to retain their biodiversity unit value over the 30-year BNG commitment period, while static designs risk unit devaluation as climate-sensitive species disappear.
Data Management and Reporting Standards
The volume of data generated by dynamic transect grids, phenological monitoring, and climate sensor networks requires a structured data management approach.
Recommended data architecture:
- A central GIS geodatabase with standardised field schemas for species records, phenological events, and environmental sensor outputs
- Version-controlled species distribution models updated annually using new occurrence data
- Automated alerts when species are recorded beyond their established range limits, triggering rapid-response surveys
- Annual summary reports comparing observed distribution against climate velocity predictions, with confidence intervals
Surveyors delivering biodiversity impact assessments should include a climate trajectory section that documents the expected direction and rate of range shift for all priority species, supported by CoRE Database comparisons and local climate projections.
Transparency in reporting is increasingly expected by local planning authorities. Surveyors who can demonstrate that their monitoring design accounts for climate-driven change will be better positioned as regulatory scrutiny of BNG outcomes intensifies.
Conclusion
The evidence is unambiguous: species are moving, and the pace of redistribution is accelerating. For biodiversity surveyors in 2026, the professional response to species distribution shifts due to climate change demands a fundamental upgrade in tracking protocols — from static, fixed-point surveys to dynamic, GIS-enabled systems that anticipate and follow range movements in real time.
Actionable next steps for surveyors:
- Audit existing survey designs on all active BNG sites and identify transects that are not aligned with climate velocity vectors for target species
- Install environmental sensors (temperature loggers, soil moisture probes) at all new BNG baseline surveys and integrate data into GIS databases
- Query the CoRE Database for comparable range shift studies before finalising monitoring schedules for any new project
- Adopt MIREN-style elevation transects on all upland sites to gain early warning of shifts that will propagate to lowland landscapes
- Include a climate trajectory section in all biodiversity impact assessments and BNG reports, specifying expected shift rates and directions for priority species
- Design habitat connectivity corridors using velocity vector data to ensure they remain functional as species ranges move over the 30-year BNG commitment period
The surveyors who build climate intelligence into every stage of their work — from baseline design to long-term monitoring — will deliver the most durable ecological outcomes and the most defensible evidence base for planning and conservation decisions.
References
[1] Species Distribution Shifts In Bng Sites Climate Velocity Mapping Protocols For Biodiversity Surveyors – https://biodiversitysurveyors.com/blog/species-distribution-shifts-in-bng-sites-climate-velocity-mapping-protocols-for-biodiversity-surveyors?utm_source=openai
[2] Mechanisms Detections And Impacts Species Redistributions Under Climate Change – https://www.usgs.gov/publications/mechanisms-detections-and-impacts-species-redistributions-under-climate-change?utm_source=openai
[3] Data Spotlight Explore Climate Induced Range – https://www.usgs.gov/programs/climate-adaptation-science-centers/news/data-spotlight-explore-climate-induced-range?utm_source=openai
[4] pubmed.ncbi.nlm.nih.gov – https://pubmed.ncbi.nlm.nih.gov/35222963/?utm_source=openai
[5] Dismap – https://apps-st.fisheries.noaa.gov/dismap/DisMAP.html?utm_source=openai
[6] Persist Place Or Shift Space Evaluating Adaptive Capacity Species Climate Change – https://www.usgs.gov/publications/persist-place-or-shift-space-evaluating-adaptive-capacity-species-climate-change?utm_source=openai
[7] research.fs.usda.gov – https://research.fs.usda.gov/treesearch/52838?utm_source=openai
[8] Standardized Phenology Monitoring Methods Track Plant And Animal Activity Science And – https://www.usgs.gov/publications/standardized-phenology-monitoring-methods-track-plant-and-animal-activity-science-and?utm_source=openai
