
Globally, habitat fragmentation has reduced average within-sample species richness by 13.6% and total abundance by 10.7% — but in the worst-affected habitats, those figures spike to a staggering 76.5% richness loss [1]. For biodiversity surveyors working on development sites, these numbers are not abstract statistics. They are the baseline reality that makes rigorous habitat fragmentation assessment techniques for biodiversity surveyors: field methods and analysis not just useful, but legally and ecologically essential.
As Biodiversity Net Gain (BNG) requirements embed themselves into UK planning law, surveyors need a toolkit that goes beyond species lists. They need structured, repeatable methods for measuring patch size, edge effects, connectivity, and landscape permeability — and they need to translate that data into corridor designs that actually work.
Key Takeaways 📋
- Habitat fragmentation causes measurable, quantifiable biodiversity loss — field methods must capture patch metrics, edge effects, and connectivity simultaneously.
- Drone technology, GIS mapping, and satellite imagery have transformed real-time fragmentation monitoring, enabling faster and more accurate surveys [2].
- Connectivity assessment is the bridge between fragmentation data and practical BNG corridor design — it must be embedded in every survey workflow.
- High-resolution habitat suitability models (900m resolution) now allow surveyors to weight impacts by species conservation status and global rarity [1].
- Actionable survey outputs — not just raw data — are what planning authorities and developers need to meet 10% BNG targets.
Understanding Habitat Fragmentation: What Surveyors Are Actually Measuring
Before selecting field methods, surveyors must be clear on what fragmentation actually involves. It is not simply "habitat loss." Fragmentation is a spatial process that simultaneously reduces total habitat area, increases the number of isolated patches, decreases individual patch size, and increases the ratio of edge habitat to interior habitat.
Each of these dimensions has different ecological consequences and requires different measurement approaches.
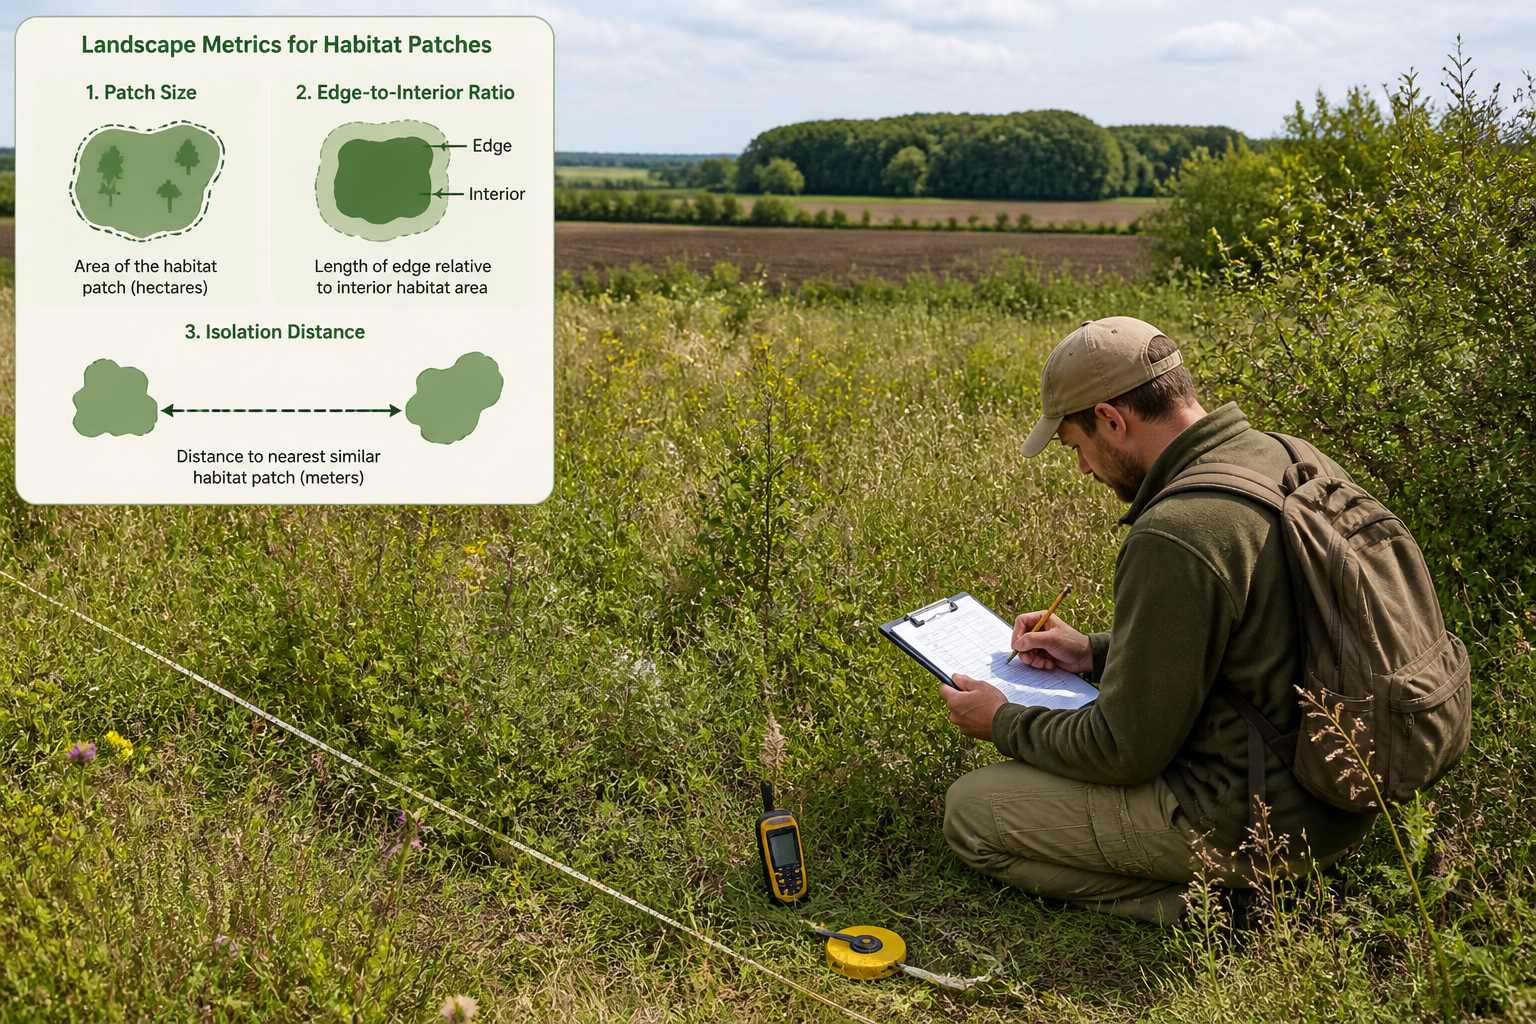
The Four Core Fragmentation Metrics
| Metric | What It Measures | Why It Matters |
|---|---|---|
| Patch Size | Total area of each habitat unit | Smaller patches support fewer species |
| Patch Isolation | Distance between habitat patches | Affects species dispersal and gene flow |
| Edge-to-Interior Ratio | Proportion of edge vs. core habitat | Edge habitats have altered microclimates |
| Connectivity Index | Functional links between patches | Determines species movement potential |
💡 Pull Quote: "Fragmentation assessment is not a single measurement — it is a multi-layered spatial analysis that must capture area, isolation, edge effects, and connectivity in a single coherent workflow."
Understanding these four pillars shapes every decision about which field protocols to deploy. A biodiversity impact assessment that overlooks connectivity, for example, will systematically underestimate the ecological cost of a development proposal.
Core Field Methods for Habitat Fragmentation Assessment Techniques for Biodiversity Surveyors: Field Methods and Analysis
The practical application of habitat fragmentation assessment techniques for biodiversity surveyors requires a layered approach: ground-truthing, remote sensing, and spatial modelling all working together.
1. 🗺️ Desk-Based Landscape Analysis (Pre-Field)
Every fragmentation survey begins at the desk. Using Ordnance Survey mapping, aerial photography, and existing habitat datasets, surveyors establish:
- Baseline habitat extent — current patch boundaries and land cover classifications
- Historical change — comparing current mapping against historical OS maps or satellite time-series to identify fragmentation trajectories
- Landscape context — identifying the matrix (the land between patches), which strongly influences species movement
Tools to use at this stage:
- QGIS or ArcGIS for spatial analysis
- FRAGSTATS software for landscape metrics (patch density, mean patch size, edge density)
- UK Habitat Classification (UKHab) system for consistent habitat typing
2. 🚁 Drone-Based Habitat Mapping
Drone technology has fundamentally changed what is achievable during a single survey visit. Multi-sensor drone platforms — equipped with ortho cameras, LiDAR, multispectral, and hyperspectral sensors — provide comprehensive data on vegetation structure, land cover, and habitat boundaries at a level of detail impossible from the ground [2].
Key applications for fragmentation surveys:
- Vegetation cover mapping — identifying habitat patch boundaries, invasive species encroachment, and degradation zones
- Edge habitat characterisation — drone imagery allows precise measurement of edge depth and the transition zone between habitat types [2]
- Connectivity barrier identification — roads, fences, drainage channels, and built structures can be systematically mapped and assessed as movement barriers [2]
- Time-series monitoring — repeat drone surveys track fragmentation change over time, including urban expansion and agricultural intensification [2]
⚠️ Important: Drone surveys must be planned around species sensitivities. Nesting bird seasons, bat roost locations, and protected species activity periods all influence when and where drone flights are appropriate.
3. 📍 Ground-Truthing and Transect Surveys
Remote sensing data must always be validated on the ground. Field surveyors use systematic transect walks through each habitat patch to:
- Verify habitat classification from aerial imagery
- Record species composition and abundance as proxies for habitat quality
- Assess structural complexity — canopy cover, shrub layer, ground flora diversity
- Identify micro-habitat features such as dead wood, bare ground, and water bodies that support specialist species
Standard transect protocols:
- Fixed-width transects (typically 2m either side of the surveyor)
- Minimum three replicate transects per habitat patch
- Consistent recording of all vascular plant species, with optional invertebrate, bird, or herpetofauna recording depending on survey scope
- GPS-logged waypoints for all notable features
4. 🔬 Edge Effect Assessment
Edge habitats are ecologically distinct from patch interiors — they experience greater wind exposure, temperature fluctuation, light penetration, and invasive species pressure. Fragmentation creates more edge relative to interior, which is why edge assessment is a non-negotiable component of any robust fragmentation survey.
Field protocol for edge assessment:
- Establish perpendicular transects running from the patch edge into the interior
- Record vegetation structure and species composition at 5m intervals from the edge
- Identify the edge penetration depth — the distance at which interior conditions become stable
- Map edge-sensitive species (e.g., woodland interior specialists) against edge penetration data
Research covering five species groups — plants, amphibians, birds, mammals, and reptiles — across multiple land use types shows that edge effects vary significantly by habitat type and land use intensity [1]. Surveyors should weight their edge assessments accordingly, giving greater scrutiny to high-intensity land use boundaries (e.g., arable field margins adjacent to ancient woodland).
Connectivity Assessment: The Bridge Between Field Data and BNG Corridor Design
Of all the habitat fragmentation assessment techniques for biodiversity surveyors: field methods and analysis, connectivity assessment carries the most direct relevance to BNG planning outcomes. A fragmentation survey that stops at patch-level metrics without modelling how species move through the landscape is incomplete.
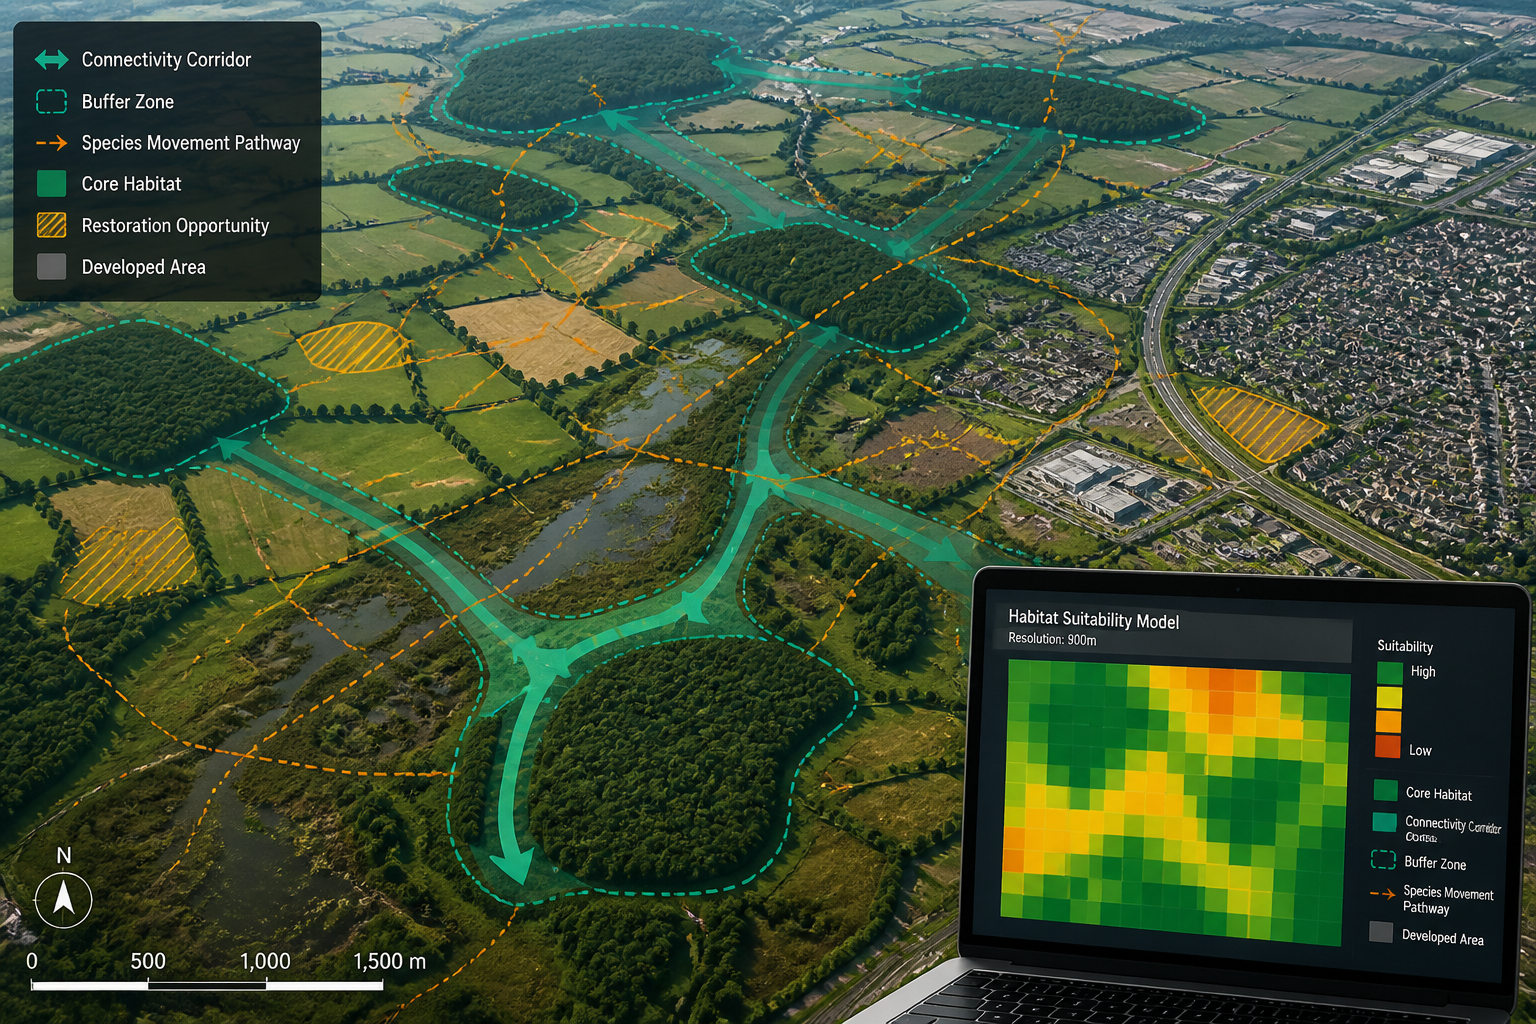
Least-Cost Path Modelling
Least-cost path (LCP) analysis is the standard GIS-based method for modelling species movement through fragmented landscapes. It works by:
- Assigning resistance values to each land cover type (e.g., urban = high resistance, hedgerow = low resistance)
- Calculating the least-cost route between habitat patches for a target species or species guild
- Identifying pinch points — narrow corridors where movement is constrained and restoration would have the highest impact
LCP outputs directly inform where BNG habitat creation should be targeted to maximise connectivity gains. For developers and planners looking to achieve 10% biodiversity net gain, connectivity data is the evidence base that justifies corridor placement decisions.
Stepping Stone Habitat Assessment
Not all species move through continuous corridors. Many use stepping stone habitats — small, isolated patches that provide temporary refuge during dispersal. Field surveyors should:
- Map all habitat patches within the study area, including those below the minimum viable size threshold
- Assess inter-patch distances against known dispersal distances for target species
- Identify gaps where additional stepping stone creation would reconnect the landscape
Habitat Suitability Modelling
High-resolution habitat suitability models at 900-metre resolution are now available globally, allowing surveyors to assess land use impacts on biodiversity weighted by species conservation status and global rarity [1]. These models cover five species groups (plants, amphibians, birds, mammals, and reptiles) across five land use types at three intensity levels [1].
In practice, surveyors can use these models to:
- Prioritise survey effort — focusing intensive ground-truthing on areas flagged as high-suitability by the model
- Predict fragmentation impacts — modelling how proposed development will alter suitability scores across the landscape
- Design restoration scenarios — testing different corridor configurations against predicted suitability outcomes
Understanding the outputs of a biodiversity net gain assessment depends heavily on having robust habitat suitability data underpinning the baseline.
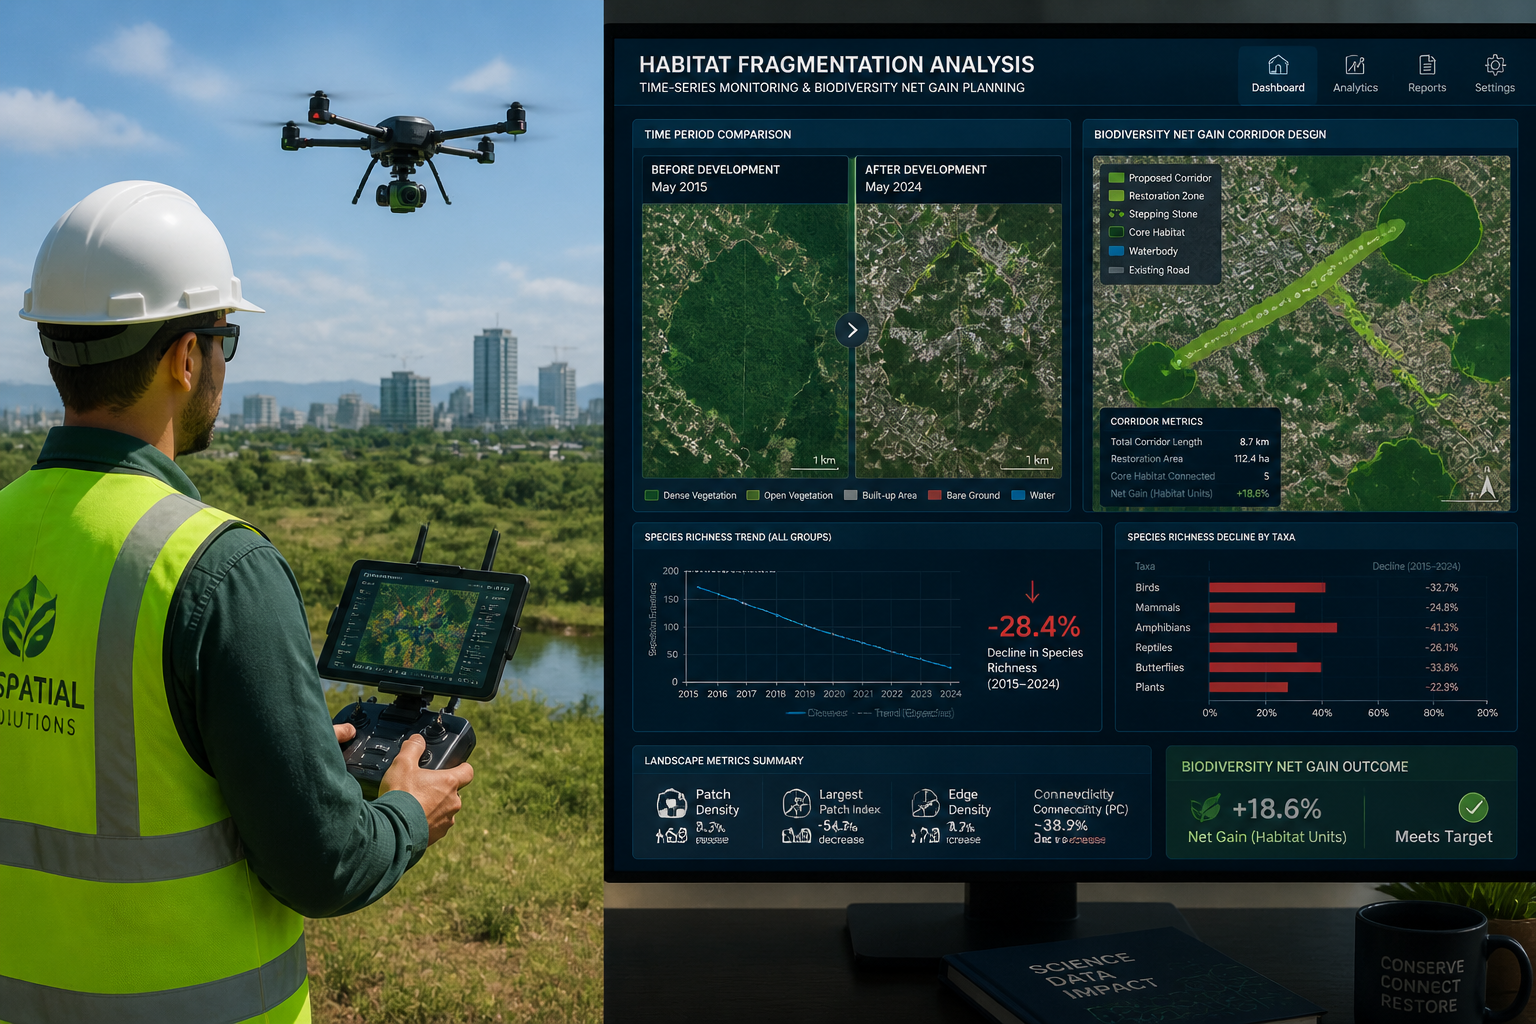
Real-Time Monitoring Integration
Satellite imagery and drone-based time-series data now enable real-time tracking of fragmentation change [2]. For long-term BNG monitoring plans — which are required over 30-year periods under UK legislation — integrating remote sensing into the monitoring protocol from the outset is strongly recommended.
Monitoring checklist for surveyors:
- Establish baseline drone orthomosaic at survey start
- Schedule annual repeat drone flights over habitat creation areas
- Set up satellite change-detection alerts for the wider landscape context
- Record GPS-tracked species movement data where feasible (e.g., radio-tagged mammals or GPS-tagged birds)
- Compare time-series data against LCP model predictions
Translating Fragmentation Data into BNG Deliverables
Raw fragmentation data has limited value unless it is translated into planning-ready outputs. Surveyors working within the BNG framework need to produce:
🗂️ The Fragmentation Assessment Report
A structured report should include:
- Landscape context map — showing all habitat patches, matrix land cover, and connectivity barriers within a defined study area (typically 2km buffer around the site)
- Patch metric summary table — area, perimeter, edge-to-interior ratio, and isolation distance for each patch
- Connectivity analysis outputs — LCP maps, stepping stone network diagrams, and resistance surface maps
- Habitat suitability scores — by species group, weighted by conservation status
- BNG corridor recommendations — specific habitat creation or enhancement measures ranked by connectivity gain
Surveyors should align their reporting with the biodiversity net gain framework to ensure outputs are directly usable in planning submissions.
Linking Fragmentation Data to Off-Site BNG
Where on-site habitat creation cannot fully address connectivity deficits, fragmentation data justifies the need for off-site BNG delivery. Understanding the distinction between land banking and habitat banking for off-site BNG is important context for surveyors advising clients on where off-site units should be purchased or created.
Landowners considering habitat creation for BNG credit can also benefit from fragmentation assessments — identifying which parcels of land sit within strategic connectivity corridors significantly increases their value as biodiversity unit providers.
Common Pitfalls in Fragmentation Surveys — and How to Avoid Them
Even experienced surveyors make systematic errors in fragmentation assessment. The most common include:
- Ignoring the matrix — treating habitat patches as isolated units without assessing the permeability of the surrounding landscape
- Single-visit surveys — fragmentation impacts vary seasonally; multi-visit surveys capture a more complete picture
- Overlooking small patches — patches below minimum viable size are often dismissed, but they may be critical stepping stones
- Conflating habitat loss with fragmentation — these are related but distinct processes requiring separate analytical frameworks
- Failing to specify target species — connectivity models are only meaningful when calibrated to the movement ecology of specific species or guilds
🔑 Key Point: A connectivity model built for a badger (which can move kilometres through agricultural land) will look very different from one built for a great crested newt (which rarely disperses more than 500m from a breeding pond). Always specify the target taxon.
For developers and their ecological consultants, understanding how to create a biodiversity plan that incorporates fragmentation data from the outset avoids costly redesigns later in the planning process.
Conclusion: Actionable Next Steps for Biodiversity Surveyors in 2026
Habitat fragmentation is one of the most measurable and actionable drivers of biodiversity loss. The field methods and analysis techniques outlined above — from desk-based landscape analysis and drone mapping to least-cost path modelling and habitat suitability scoring — give surveyors a complete, evidence-based workflow for quantifying fragmentation impacts and designing effective responses.
Practical next steps for surveyors:
- Adopt a standardised fragmentation metric suite (patch size, isolation, edge-to-interior ratio, connectivity index) as a core component of every biodiversity survey.
- Integrate drone surveys into field protocols where budget allows — the data quality improvement justifies the investment.
- Build connectivity modelling into BNG reports from the outset, not as an afterthought.
- Use high-resolution habitat suitability models to weight species impacts by conservation status and prioritise survey effort.
- Establish long-term monitoring baselines using satellite and drone time-series data to support 30-year BNG monitoring obligations.
- Engage early with developers to embed fragmentation assessment into site design — not just post-planning mitigation.
For surveyors, developers, and landowners navigating the BNG landscape in 2026, fragmentation assessment is no longer optional. It is the analytical foundation on which credible, deliverable biodiversity net gain is built.
References
[1] ACS Environmental Science & Technology – https://pubs.acs.org/doi/10.1021/acs.est.3c04191
[2] Habitat Fragmentation – https://www.jouav.com/blog/habitat-fragmentation.html
[3] Journal of Applied Ecology – https://besjournals.onlinelibrary.wiley.com/doi/full/10.1111/1365-2664.70248
[4] Fletcher Jr RJ – Resurrecting – https://pure-oai.bham.ac.uk/ws/portalfiles/portal/301582679/FletcherJrRJ2026Resurrecting.pdf
