
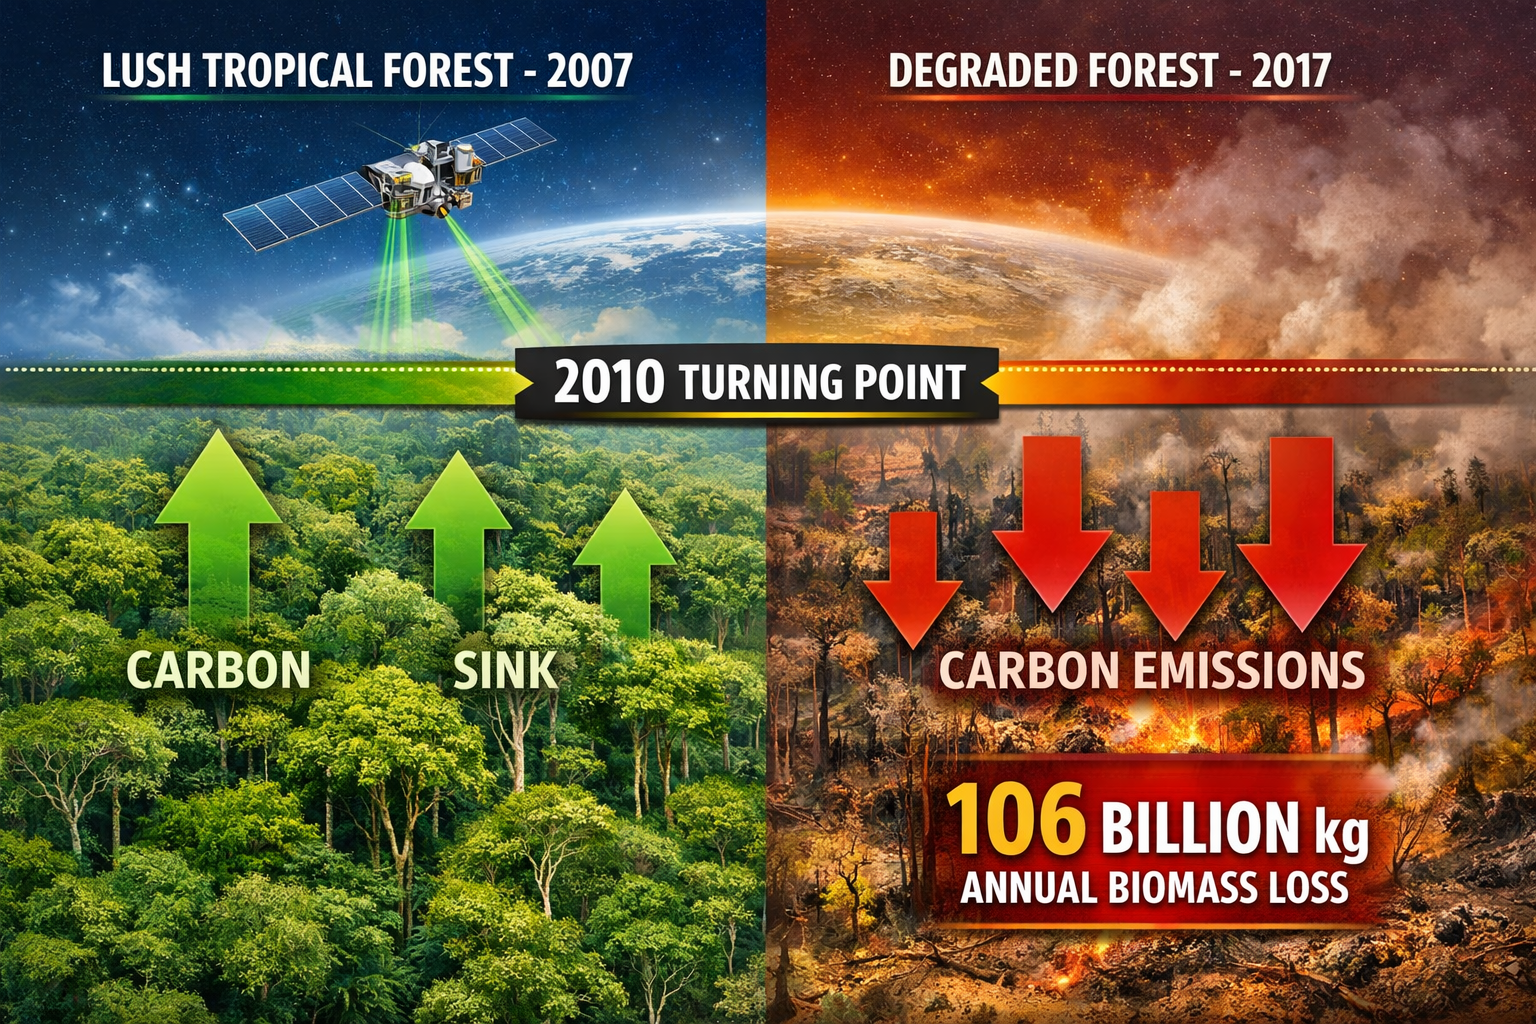
Africa's forests lost approximately 106 billion kilograms of forest biomass every single year between 2010 and 2017 — a figure equivalent to the combined weight of 106 million cars disappearing from the landscape annually [1]. This staggering statistic signals more than an ecological crisis. It marks a fundamental shift in how ecologists, conservation planners, and biodiversity professionals must approach African Forest Carbon Reversal: Survey Protocols for Ecologists Assessing BNG Impacts Post-2010 Emissions Shift when designing field methodologies and compliance frameworks for 2026 and beyond.
For professionals working within Biodiversity Net Gain (BNG) frameworks — whether in the UK or internationally — this post-2010 emissions shift demands updated survey protocols, recalibrated baselines, and a sharper understanding of how carbon reversal data integrates into net gain calculations. The old assumption that African forests passively absorb carbon no longer holds. The science has moved on, and survey practice must follow.
Key Takeaways 📌
- Africa's forests became net carbon emitters between 2010 and 2017, reversing a period of carbon accumulation observed from 2007–2010 [1].
- Forest degradation within intact forests — not just deforestation — is the primary driver of carbon loss, demanding survey protocols that assess internal forest condition [2].
- High-resolution satellite data (NASA GEDI + ALOS radar) now enables 100-metre resolution biomass mapping, which ecologists must integrate with ground-truthing methods [1].
- BNG assessments referencing African forest habitats must account for post-2010 baseline shifts when calculating biodiversity units and carbon co-benefits.
- The AFR100 initiative targets restoration of 100 million hectares by 2030, offering a policy anchor for ecologists designing long-term monitoring protocols [1].
Why the Post-2010 Carbon Reversal Changes Everything for Ecologists
Between 2007 and 2010, Africa's forests were functioning as a genuine carbon sink — absorbing more CO₂ than they released. That trajectory reversed dramatically after 2010. Peer-reviewed research published in Scientific Reports, led by the National Centre for Earth Observation at the Universities of Leicester, Sheffield, and Edinburgh, confirmed that Africa's forests shifted from carbon sink to net carbon source within the decade [1].
The annual biomass loss translated to 0.19 gigatonnes of CO₂ equivalent per year entering the atmosphere [2]. To put this in context: that is roughly equivalent to the annual emissions of several mid-sized industrialised nations, now coming from ecosystems that policymakers had long treated as a natural offset.
💬 "All three major rainforest regions — Africa, the Amazon, and Southeast Asia — are now failing to offset human emissions at the rates policymakers once relied upon." [2]
This finding fundamentally challenges passive nature-based climate strategies. It also has direct implications for ecologists conducting BNG assessments that reference African forest habitats, carbon co-benefit claims, or international biodiversity offset schemes.
Geographic Hotspots Ecologists Must Prioritise
The losses were not evenly distributed. The most severe biomass declines occurred in:
| Region | Primary Forest Type | Key Driver |
|---|---|---|
| Democratic Republic of Congo | Tropical moist broadleaf | Degradation + agricultural expansion |
| Madagascar | Lowland tropical forest | Deforestation + fragmentation |
| West Africa | Coastal tropical forest | Logging + land conversion |
| Central African savannas | Woodland-savanna mosaic | Fire + charcoal production |
Savanna gains in some regions were insufficient to offset the losses in tropical moist forests [1]. This geographic asymmetry matters enormously for survey design: a broad continental average will mask critical local signals.
African Forest Carbon Reversal: Survey Protocols for Ecologists Assessing BNG Impacts Post-2010 Emissions Shift — Field Methodology Framework
Designing robust survey protocols for post-2010 African forest carbon reversal requires integrating three layers of evidence: satellite-derived data, ground-based field measurements, and BNG compliance metrics. Each layer informs the others, and none is sufficient alone.
Layer 1: Satellite Data Integration and Ground-Truthing
The research underpinning the post-2010 reversal used a sophisticated combination of:
- 🛰️ NASA's GEDI (Global Ecosystem Dynamics Investigation) lidar instrument for canopy height and biomass estimation
- 📡 Japan's ALOS PALSAR radar satellite for forest cover and structure
- 🤖 Machine learning algorithms to integrate multi-source data at 100-metre resolution
- 📍 Ground-based forest inventory plots for calibration and validation [1]
For ecologists conducting field surveys, this satellite layer provides the starting baseline. However, satellite data has known limitations: cloud cover over tropical forests, signal saturation in dense biomass, and temporal gaps between acquisition dates. Ground-truthing is therefore not optional — it is the quality-control mechanism that makes satellite outputs usable for BNG compliance.
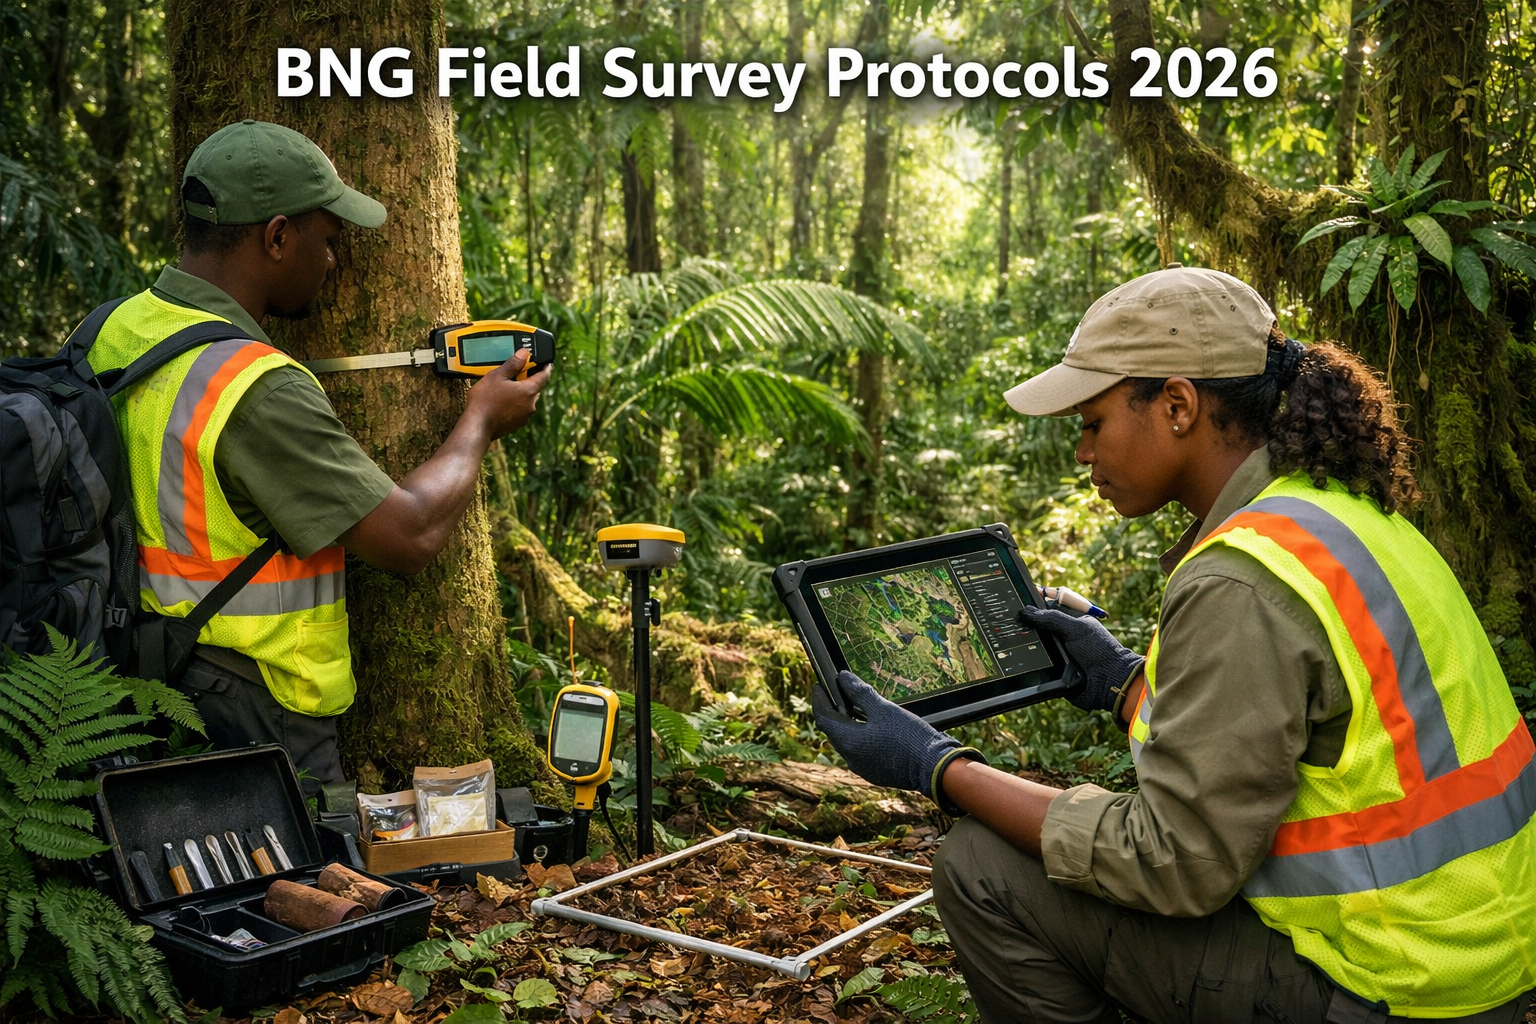
Recommended ground-truthing protocol steps:
- Establish permanent plot networks aligned with satellite grid cells (minimum 0.25 ha plots)
- Measure above-ground biomass (AGB) using allometric equations validated for the specific forest type
- Record canopy cover, basal area, and stem density at each plot
- Document degradation indicators: selective logging scars, fire damage, edge effects, invasive species encroachment
- GPS-tag all plots to enable repeat surveys and change detection over time
- Cross-reference with GEDI waveform data to identify discrepancies requiring field investigation
Layer 2: Degradation Assessment — The Hidden Carbon Loss
One of the most significant findings from the post-2010 research is that forest degradation within standing forests — not outright deforestation — was the primary driver of carbon loss [2]. This is a critical insight for survey design.
Traditional survey methods often focus on forest cover change (trees present vs. trees absent). But degradation happens inside forests that still appear intact from above. Selective logging, fuelwood extraction, understorey burning, and edge effects all reduce biomass without triggering a land-cover change flag in standard satellite classification.
Degradation indicators to include in survey protocols:
- 🌿 Reduced canopy closure (below 70% in moist forest = degradation signal)
- 🪵 Evidence of selective logging (stumps, skid trails, logging roads)
- 🔥 Char marks, ash deposits, or fire-adapted understorey species in non-fire-adapted forest types
- 🐾 Reduced wildlife presence (camera trap data as a proxy for ecological integrity)
- 🌱 Invasive species dominance in understorey layers
- 📉 Below-expected biomass density relative to forest type reference values
For BNG assessments, degradation data feeds directly into habitat condition scoring. A forest that retains its cover but has lost 40% of its biomass through degradation is not the same ecological asset as an intact forest — and BNG calculations must reflect that distinction. Understanding what is in a biodiversity net gain assessment helps ecologists structure their field data collection to meet compliance requirements from the outset.
Layer 3: BNG Metric Alignment for African Forest Habitats
For ecologists working on projects with international biodiversity offset components, or advising on schemes where African forest habitats are referenced as offset sites, aligning survey outputs with BNG metric requirements is essential.
The UK's mandatory BNG framework — now fully embedded in planning law — uses a biodiversity unit calculation based on habitat area, condition, and strategic significance. When African forest habitats are referenced in offset or credit schemes, the post-2010 carbon reversal data means that:
- Pre-2010 baseline values are no longer valid for calculating additionality
- Condition scores must reflect current degradation status, not historical intact-forest benchmarks
- Carbon co-benefit claims attached to BNG units require independent verification against post-2010 biomass data
Ecologists should consult the secondary BNG legislation summary to ensure survey outputs align with current statutory requirements before integrating international forest data into UK BNG calculations.
Integrating Carbon Reversal Data into BNG Compliance: Practical Steps for 2026
The practical challenge for ecologists in 2026 is translating continental-scale carbon reversal findings into site-level survey protocols that satisfy both ecological rigour and BNG compliance requirements.
Step-by-Step Protocol for BNG-Aligned African Forest Surveys
Phase 1: Pre-Survey Desk Study
- Download and analyse available GEDI and ALOS biomass layers for the survey area
- Identify the relevant forest type from the pantropical biomass map [1]
- Review historical land-cover change data from 2007 to present
- Establish the pre-2010 baseline and post-2010 trajectory for the specific location
Phase 2: Field Survey Design
- Select plot locations using stratified random sampling across forest condition classes
- Include both intact forest interior plots and edge/degraded plots
- Minimum survey intensity: 1 plot per 10 hectares in heterogeneous forest; 1 per 25 hectares in uniform forest
- Deploy camera traps at 20% of plots for fauna-based condition indicators
Phase 3: Biomass and Condition Measurement
- Measure DBH (diameter at breast height) for all stems ≥10 cm
- Apply region-specific allometric equations (not pantropical generics where local equations exist)
- Score habitat condition using a standardised degradation index (0–100 scale)
- Record all degradation indicators listed in Layer 2 above
Phase 4: Data Integration and BNG Metric Calculation
- Cross-reference field biomass estimates with satellite-derived values
- Quantify discrepancies and document explanations
- Calculate habitat condition scores for BNG unit calculations
- Apply the post-2010 baseline correction to ensure additionality claims are valid
For developers and landowners navigating the BNG compliance landscape, the guidance for landowners provides a useful framework for understanding how habitat condition data feeds into unit calculations and legal obligations.
The Leakage Problem: Why Spatial Monitoring Matters
One of the most technically demanding aspects of African forest carbon assessment is leakage detection — the displacement of forest loss from one area to another in response to protection measures [2]. High-resolution monitoring at 100-metre scale enables this detection, but only if survey protocols are designed with spatial coverage in mind.
Ecologists must:
- Establish control plots outside protected areas to detect displacement effects
- Monitor forest edges adjacent to agricultural expansion zones quarterly
- Use repeat satellite analysis annually to flag new degradation fronts
This spatial rigour is increasingly expected in international carbon markets and is becoming a baseline expectation for credible biodiversity net gain assessments that reference forest carbon co-benefits.
African Forest Carbon Reversal: Survey Protocols for Ecologists Assessing BNG Impacts Post-2010 Emissions Shift — Restoration Monitoring and the AFR100 Framework
Restoration monitoring is the forward-looking component of any credible survey protocol. The AFR100 initiative — targeting restoration of 100 million hectares of African forest landscape by 2030 — provides the policy framework within which ecologists can anchor long-term monitoring designs [1].
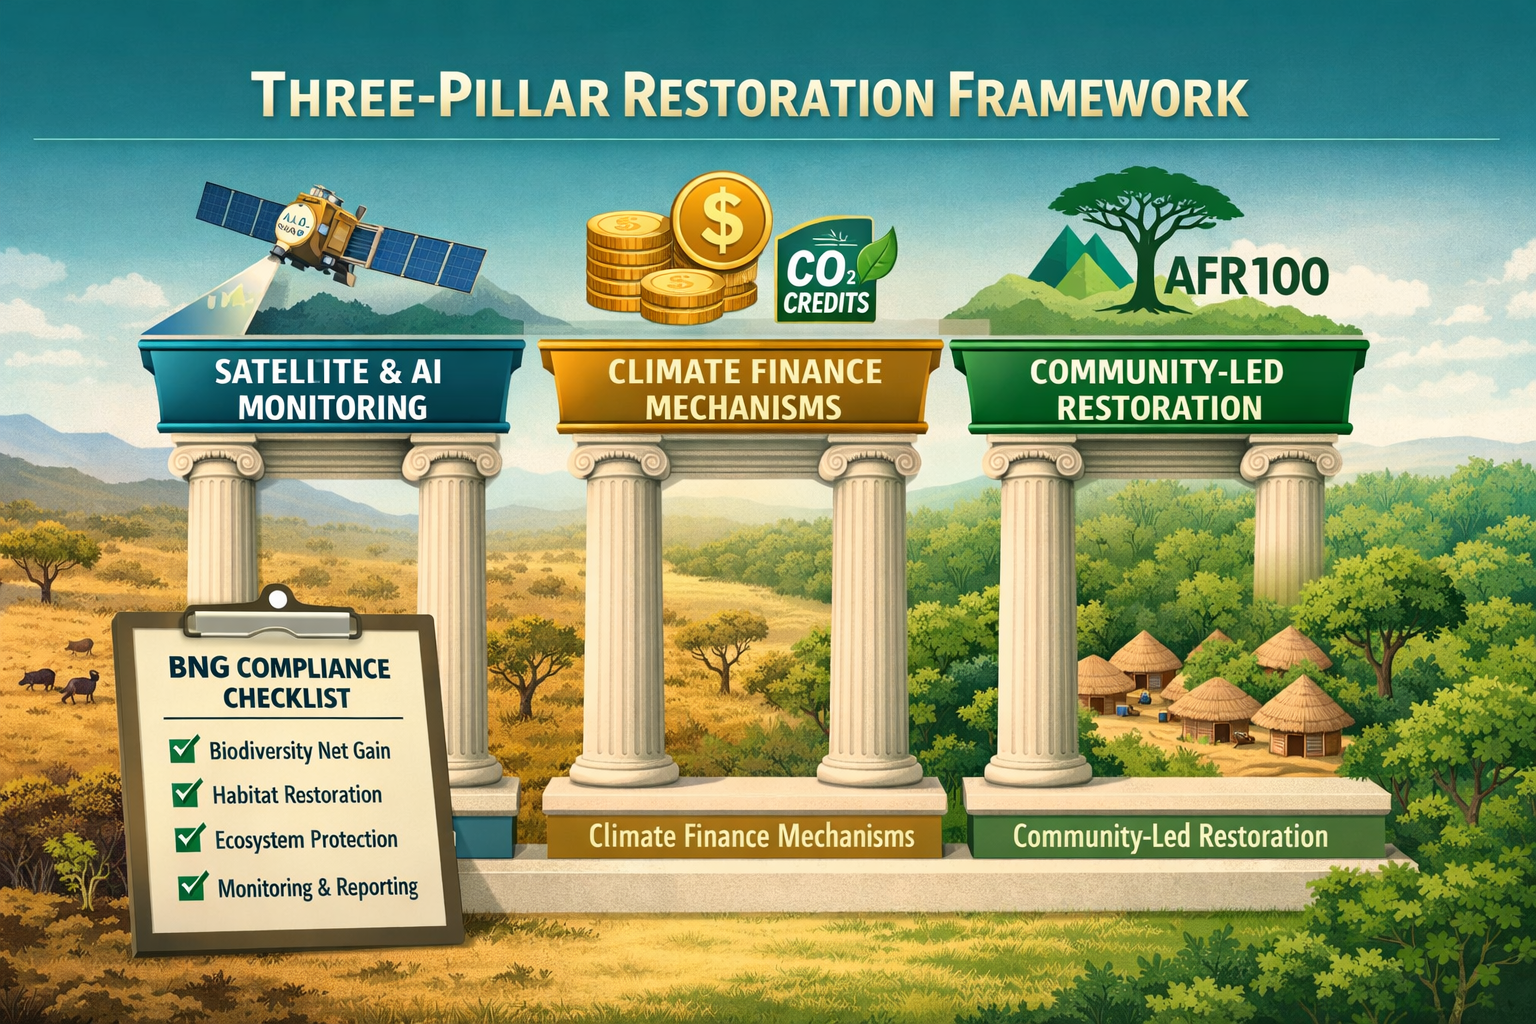
The Three-Pillar Solution Framework
Emerging consensus among researchers and policymakers points to three interconnected solutions [2]:
Pillar 1: Enhanced Measurement 🛰️
- Expand satellite + AI monitoring networks
- Increase density of ground-based inventory plots
- Publish open-access biomass datasets for independent verification
Pillar 2: Smarter Climate Finance 💰
- Design payment-for-ecosystem-services schemes using verified, post-2010 baselines
- Require independent auditing of carbon credits against satellite biomass data
- Penalise leakage through financial clawback mechanisms
Pillar 3: Community-Led Restoration 🌱
- Prioritise restoration on degraded lands (not intact forest conversion)
- Integrate local livelihood objectives into restoration design
- Build local capacity for ongoing monitoring and data collection
For ecologists, Pillar 1 has the most direct methodological implications. The shift toward AI-assisted biomass mapping means that field ecologists increasingly function as calibration specialists — their ground-based measurements are the quality-control layer that makes satellite products scientifically defensible.
Monitoring Intervals and Long-Term Protocol Design
| Survey Component | Recommended Frequency | Method |
|---|---|---|
| Biomass plot remeasurement | Every 2 years | DBH census + allometric calculation |
| Canopy cover assessment | Annual | Hemispherical photography or LiDAR |
| Degradation indicator scoring | Annual | Standardised field checklist |
| Satellite data cross-check | Every 6 months | GEDI/ALOS layer comparison |
| Fauna condition indicators | Annual | Camera trap deployment |
| Leakage monitoring (control plots) | Annual | Paired plot comparison |
These intervals align with the monitoring requirements increasingly expected under biodiversity net gain off-site delivery schemes, where long-term habitat management and reporting obligations extend for 30 years under UK statutory requirements.
Carbon Reversal Data and BNG Unit Validity
A critical question for 2026 compliance work is: can a degraded African forest generate valid BNG units? The answer depends entirely on survey rigour and baseline accuracy.
A forest that was a carbon sink before 2010 but has since become a net emitter does not automatically disqualify as a BNG habitat asset. What matters is:
- Current condition score — accurately measured using post-2010 protocols
- Trajectory — is the habitat improving, stable, or declining?
- Additionality — would protection or restoration deliver measurable gain above the current baseline?
Ecologists who can demonstrate a credible, satellite-validated, ground-truthed answer to all three questions are in a strong position to support valid BNG unit claims. Those who rely on pre-2010 condition assumptions are not. Understanding the cost of biodiversity units and statutory credits helps contextualise the financial stakes of getting these assessments right.
Conclusion: Actionable Next Steps for Ecologists in 2026
The post-2010 African forest carbon reversal is not a distant scientific abstraction — it is a live challenge for every ecologist whose work touches forest habitats, carbon co-benefits, or international biodiversity offset schemes. The findings are peer-reviewed, satellite-validated, and unambiguous: Africa's forests are now net emitters, and survey protocols must reflect this reality [1][2].
Actionable next steps for ecologists and BNG practitioners:
✅ Audit existing survey protocols — check whether your biomass baselines and condition scores use pre-2010 or post-2010 reference values, and update accordingly.
✅ Integrate satellite data layers — access GEDI and ALOS biomass products as standard desk-study inputs before any field campaign targeting African forest habitats.
✅ Expand degradation indicators — add internal forest degradation metrics to survey checklists, not just land-cover change flags.
✅ Design for leakage detection — include control plots and spatial monitoring coverage in survey designs for any scheme claiming carbon or biodiversity additionality.
✅ Align with AFR100 monitoring standards — use the restoration initiative's monitoring framework as a quality benchmark for long-term protocol design.
✅ Verify BNG unit calculations — ensure any biodiversity units referencing African forest habitats are calculated against post-2010 condition baselines with documented satellite cross-validation.
The science is clear. The policy frameworks are in place. What the field needs now is survey rigour that matches the scale and complexity of the challenge. Ecologists who invest in updated protocols today will be better positioned to deliver credible, defensible, and genuinely impactful biodiversity assessments as international scrutiny of nature-based climate claims intensifies through the rest of this decade.
References
[1] Africa's Forests Shift from Carbon Sink to Source – https://www.sciencedaily.com/releases/2026/04/260413043135.htm
[2] Africa Forest Carbon Flip Restoration – https://www.intelligentliving.co/africa-forest-carbon-flip-restoration/
[3] Africa's Forests Are No Longer Absorbing Carbon, Scientists Warn – https://scitechdaily.com/africas-forests-are-no-longer-absorbing-carbon-scientists-warn/
[4] Shocking Reversal: African Forests Have Changed From Carbon Sink To Carbon Source Since 2010 – https://www.co2news.sk/en/2025/11/30/shocking-reversal-african-forests-have-changed-from-carbon-sink-to-carbon-source-since-2010/
[5] PMC12400271 – https://pmc.ncbi.nlm.nih.gov/articles/PMC12400271/
[6] Global Change Biology – https://onlinelibrary.wiley.com/doi/10.1111/gcb.15498
