
Recent data reveals that 85% of UK ecosystems suffer from disrupted food webs due to historical apex predator losses—a statistic that underscores why Trophic Cascade Restoration Metrics: Surveyor Guides to Quantifying Predator Reintroductions in 2026 BNG Sites has become essential reading for biodiversity professionals. As Biodiversity Net Gain (BNG) legislation drives unprecedented habitat restoration across England, surveyors face a critical challenge: how to accurately measure the ecosystem-wide effects when apex predators return to landscapes they've been absent from for decades or centuries.
The reintroduction of apex predators represents one of the most powerful—yet complex—restoration interventions available within BNG implementation frameworks. When wolves, lynx, or even smaller predators like pine martens return to restored habitats, they trigger cascading effects throughout entire food webs. These trophic cascades can fundamentally reshape ecosystem structure, but only if surveyors can quantify them with scientific rigor.
Key Takeaways
- Trophic cascade metrics include stable isotope analysis (δ¹³C and δ¹⁵N ranges), population density monitoring, and spatial distribution patterns that reveal food web restructuring
- Camera trap protocols provide non-invasive, cost-effective data on predator presence, behavior patterns, and prey population responses essential for BNG monitoring
- Scat analysis techniques deliver dietary composition data, prey species identification, and health indicators without disturbing reintroduced predator populations
- Quantifiable indicators such as mesopredator release, herbivore behavior changes, and vegetation recovery metrics demonstrate cascade effects for BNG compliance
- Standardized monitoring frameworks enable surveyors to track restoration success across multiple trophic levels over 30-year BNG management periods
Understanding Trophic Cascades in BNG Restoration Contexts
What Are Trophic Cascades?
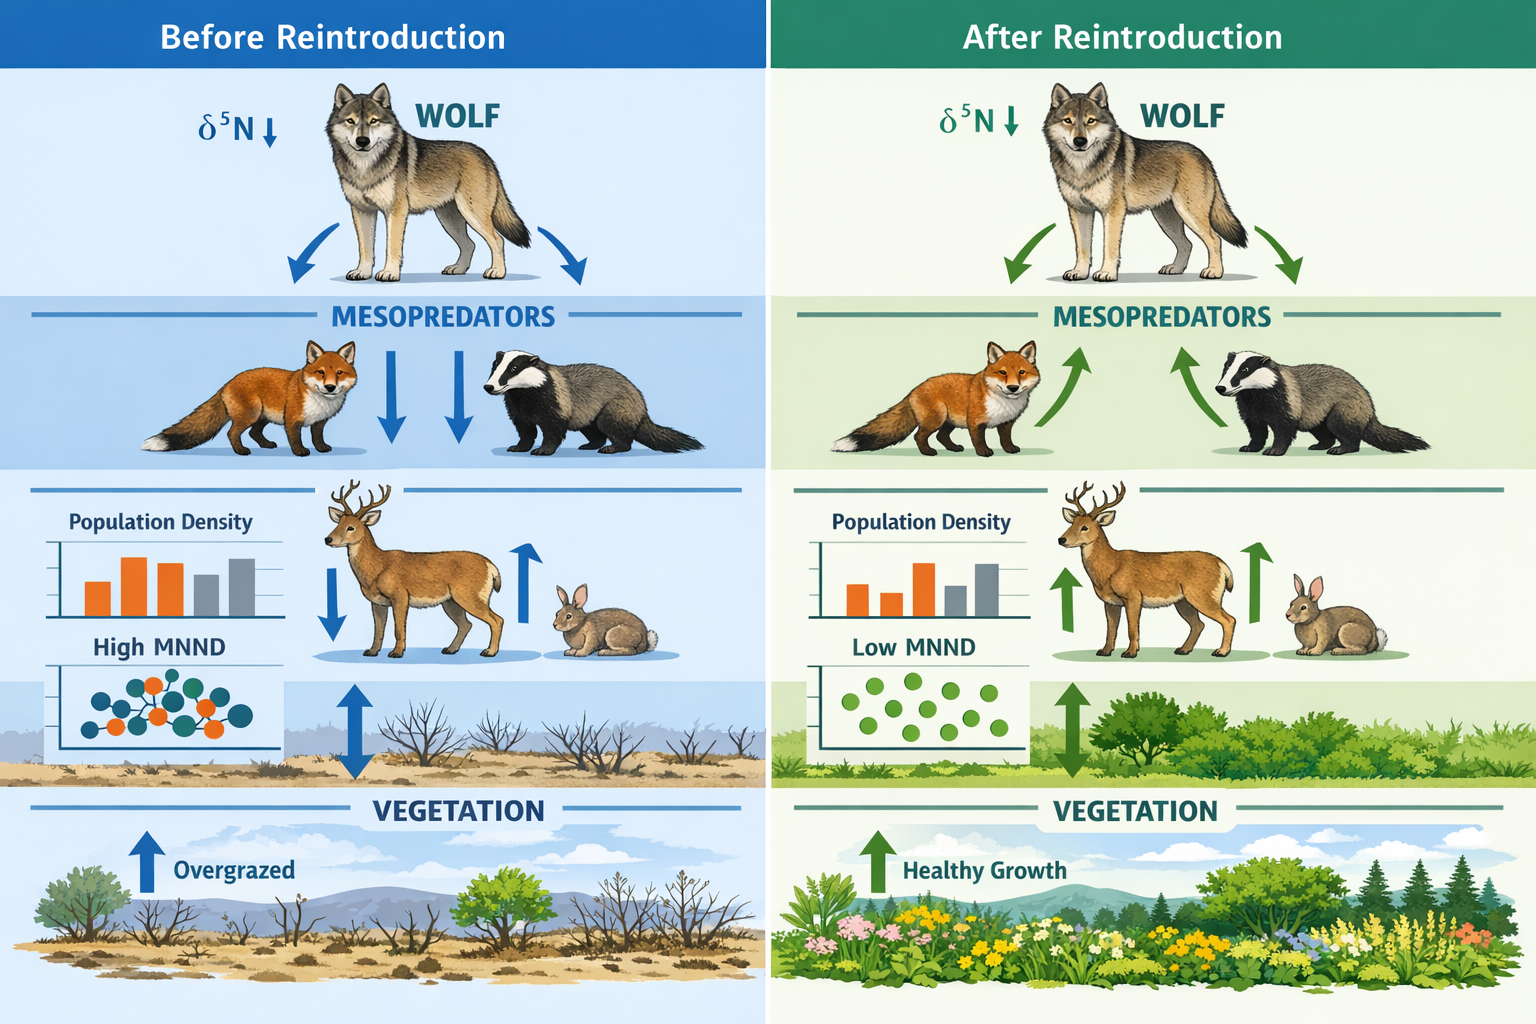
Trophic cascades occur when apex predators exert top-down control on ecosystem structure by regulating prey populations, which in turn affects vegetation and lower trophic levels. When predators are removed, ecosystems often experience mesopredator release—the proliferation of mid-sized predators—and herbivore population explosions that degrade vegetation communities.
The scientific foundation for monitoring these dynamics has strengthened considerably. Research demonstrates that loss of diversity across trophic levels fundamentally impacts ecosystem functioning through altered food webs and trophic cascades.[4] This understanding is particularly relevant for Biodiversity Net Gain sites where predator reintroductions aim to restore historical ecosystem processes.
Why Trophic Cascade Metrics Matter for BNG Compliance
Standard BNG assessments typically focus on habitat condition and species richness, but these metrics alone cannot capture the functional restoration that predator reintroductions deliver. Trophic cascade metrics provide evidence of:
- ✅ Ecosystem process restoration beyond simple habitat creation
- ✅ Long-term sustainability of restored food webs
- ✅ Functional connectivity between trophic levels
- ✅ Biodiversity unit value justification for high-quality restoration
- ✅ Compliance documentation for 30-year management requirements
Recent frameworks for evaluating biodiversity benefits in restoration contexts emphasize the importance of considering species' historical habitats and ecosystem functionality—principles directly applicable to predator reintroduction monitoring.[3]
Core Metrics for Quantifying Trophic Cascade Restoration

Stable Isotope Analysis: δ¹³C and δ¹⁵N Ranges
Stable isotope analysis provides powerful insights into food web structure that visual surveys alone cannot reveal. Two key isotopes serve as the foundation for trophic cascade metrics:
δ¹⁵N (Nitrogen-15) Range measures trophic length—the number of feeding steps from primary producers to apex predators. Higher δ¹⁵N values indicate organisms feeding at higher trophic levels. Research has identified δ¹⁵N range as a critical parameter for assessing food web dynamics in restoration contexts.[1]
δ¹³C (Carbon-13) Range quantifies carbon source diversification within the ecosystem. Wider δ¹³C ranges indicate greater diversity of energy pathways supporting the food web, suggesting more complex and resilient ecosystem structure.[1]
Practical Application for Surveyors
Surveyors can collect tissue samples (hair, feathers, whisker clippings) from predators and prey species during routine monitoring. Laboratory analysis typically costs £25-45 per sample in 2026, making this approach feasible for biodiversity impact assessments on medium to large BNG sites.
| Metric | What It Measures | Baseline Value | Restoration Target |
|---|---|---|---|
| δ¹⁵N Range | Trophic length | <6‰ (degraded) | >8‰ (functional cascade) |
| δ¹³C Range | Carbon source diversity | <2‰ (simplified) | >4‰ (complex food web) |
| MNND | Trophic redundancy | >0.8 (low redundancy) | <0.5 (high redundancy) |
Mean Nearest Neighbor Distance (MNND) in Trophic Space
MNND quantifies trophic redundancy—the degree to which multiple species occupy similar functional roles within the food web. Lower MNND values indicate higher functional redundancy, which correlates with ecosystem resilience.[1]
For BNG surveyors, MNND calculations require:
- Isotope data from multiple species across trophic levels
- Plotting species in two-dimensional isotope space (δ¹³C vs. δ¹⁵⁵N)
- Calculating distances between nearest functional neighbors
- Comparing pre- and post-reintroduction values
Population Density and Distribution Metrics
Traditional population monitoring remains essential for documenting trophic cascade effects:
- Predator density (individuals per km²)
- Prey population trends (annual percentage change)
- Mesopredator abundance (detecting suppression)
- Herbivore distribution patterns (landscape of fear effects)
- Vegetation recovery indices (browsing pressure reduction)
Camera Trap Protocols for Predator Reintroduction Monitoring
Camera traps have become the gold standard for non-invasive predator monitoring in BNG sites. These automated systems provide continuous data collection without human presence, reducing disturbance to sensitive reintroduced populations.
Strategic Camera Trap Placement
Effective monitoring requires systematic placement strategies:
Grid-Based Deployment: Establish camera stations at 1-2 km intervals across the BNG site, ensuring coverage of diverse habitat types. This approach enables density estimation using spatial capture-recapture models.
Feature-Based Targeting: Position cameras at:
- 🎯 Game trails and wildlife corridors
- 🎯 Water sources and crossing points
- 🎯 Territorial marking locations (scent posts, scrapes)
- 🎯 Den sites and breeding areas (maintain appropriate buffer distances)
- 🎯 Prey congregation areas (meadows, woodland edges)
Camera Trap Configuration Standards
To ensure data quality and comparability across BNG monitoring periods:
- Trigger sensitivity: Medium-high to capture all size classes
- Photo burst: 3-5 images per trigger event
- Delay between triggers: 1-5 minutes (species-dependent)
- Operating schedule: 24-hour continuous operation
- Check interval: Monthly during establishment phase, quarterly thereafter
- Data organization: GPS-tagged, time-stamped, site-coded images
Data Analysis and Interpretation
Modern camera trap analysis software enables surveyors to extract multiple metrics:
Occupancy Rates: Proportion of camera stations detecting target species, indicating range expansion following reintroduction.
Activity Patterns: Temporal analysis reveals behavioral changes in prey species (nocturnal shifts indicating predator avoidance) and predator hunting patterns.
Relative Abundance Indices: Capture rates (detections per 100 trap-nights) provide population trend indicators without requiring individual identification.
Behavioral Observations: Direct evidence of predation events, territorial behavior, reproduction, and interspecific interactions that demonstrate functional ecosystem integration.
Cost-Benefit Analysis for BNG Sites
| Site Size | Camera Units | Annual Cost | Data Quality |
|---|---|---|---|
| Small (<10 ha) | 5-10 cameras | £2,000-3,500 | Presence/absence |
| Medium (10-50 ha) | 15-25 cameras | £5,000-8,000 | Population trends |
| Large (>50 ha) | 30+ cameras | £10,000-15,000 | Density estimates |
Scat Analysis Techniques for Dietary and Health Assessment
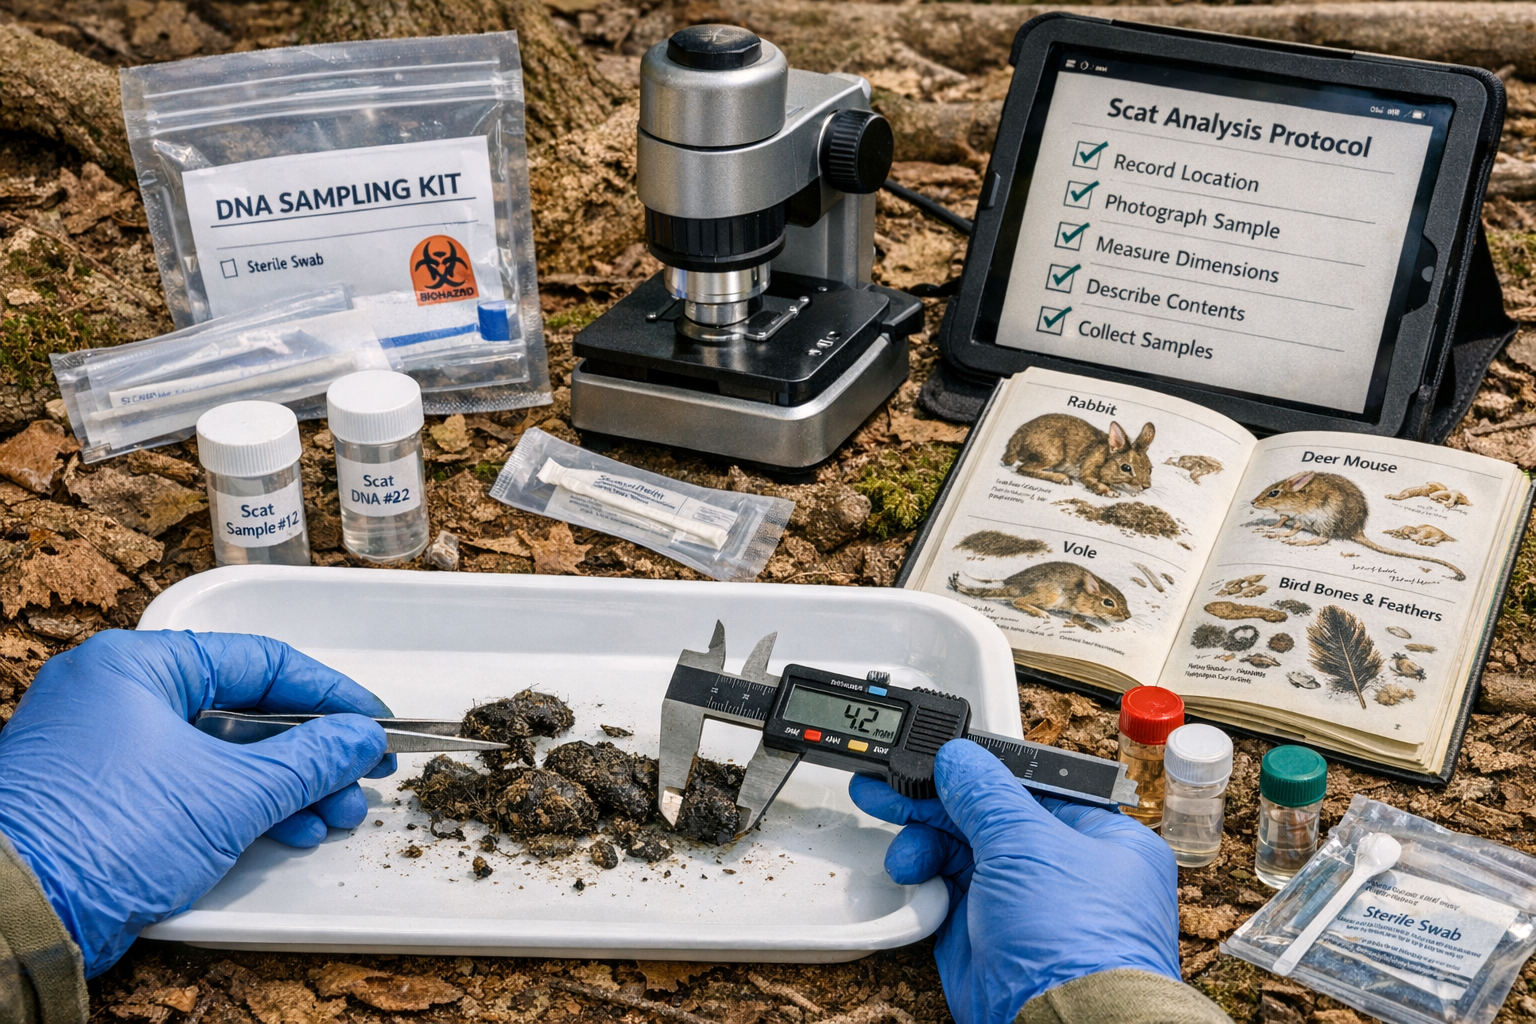
Scat (fecal) analysis provides invaluable data on predator diet composition, prey selection, and health status—all critical indicators of successful ecosystem integration following reintroduction.
Field Collection Protocols
Systematic Transect Surveys: Establish permanent transects (2-5 km length) throughout the BNG site. Survey monthly during the first two years post-reintroduction, then quarterly thereafter.
Sample Documentation: Record GPS coordinates, collection date, approximate age (fresh/old), associated sign (tracks, prey remains), and habitat type for each sample.
Preservation Methods: Fresh samples for DNA analysis require freezing within 4 hours. Samples for dietary analysis can be air-dried or preserved in 70% ethanol.
Laboratory Analysis Techniques
Morphological Analysis: Visual examination and microscopic identification of hair, bone fragments, teeth, feathers, and plant material reveal prey species composition. This traditional method remains cost-effective (£15-30 per sample) and provides immediate results.
DNA Metabarcoding: Modern molecular techniques identify prey species with high precision, even from degraded samples. While more expensive (£80-150 per sample), DNA analysis detects soft-bodied prey missed by morphological methods and enables individual predator identification.
Parasite Analysis: Intestinal parasite loads indicate predator health status and integration into local ecosystems. Established populations typically show parasite communities similar to native predators.
Interpreting Dietary Data for Trophic Cascade Evidence
Successful predator reintroductions demonstrate specific dietary patterns:
- Prey diversity increase over time (ecosystem learning)
- Native prey predominance (>80% of diet)
- Mesopredator consumption (evidence of competitive suppression)
- Seasonal variation (functional integration with ecosystem cycles)
- Age/sex-specific patterns (population establishment indicators)
"Dietary analysis from scat samples provides the most cost-effective method for documenting functional integration of reintroduced predators into restored food webs. When combined with camera trap data, surveyors can build comprehensive evidence of trophic cascade restoration."
Non-Invasive Genetic Monitoring
Beyond dietary analysis, scat samples enable population genetics monitoring without capturing animals:
- Individual identification (population size estimation)
- Sex determination (breeding population structure)
- Relatedness analysis (genetic diversity assessment)
- Dispersal tracking (connectivity between BNG sites)
- Hybridization detection (conservation genetics concerns)
Integrating Cascade Metrics into BNG Monitoring Frameworks
Baseline Assessment Requirements
Before predator reintroduction, surveyors must establish comprehensive baselines:
- Pre-reintroduction food web structure (species inventories across trophic levels)
- Herbivore population densities and distribution patterns
- Vegetation condition assessments (browsing pressure indicators)
- Mesopredator abundance (establishing pre-suppression levels)
- Prey species behavior (activity patterns, habitat use)
These baselines enable biodiversity credit calculations that accurately reflect the ecosystem transformation value of predator reintroductions.
Temporal Monitoring Schedules
Trophic cascade effects manifest over different timescales:
Year 1-2 (Establishment Phase):
- Monthly camera trap data downloads
- Quarterly scat collection surveys
- Seasonal prey population assessments
- Continuous predator location monitoring (GPS collars where appropriate)
Year 3-5 (Integration Phase):
- Quarterly camera trap reviews
- Biannual scat analysis
- Annual vegetation surveys (detecting browsing pressure changes)
- Annual stable isotope sampling
Year 6-30 (Maintenance Monitoring):
- Biannual camera trap assessments
- Annual scat collection
- Five-year comprehensive food web assessments
- Adaptive management protocol adjustments
Reporting Standards for BNG Compliance
Trophic cascade restoration reports should include:
- 📊 Executive summary with key metric trends
- 📊 Methodology section detailing protocols and standards
- 📊 Results presentation with statistical analysis
- 📊 Comparative analysis against baseline and target conditions
- 📊 Photographic evidence from camera traps
- 📊 Recommendations for adaptive management
- 📊 Biodiversity unit calculations incorporating cascade effects
Advanced Surveying Technologies for 2026
Environmental DNA (eDNA) Applications
Water and soil samples can detect predator presence through shed DNA, complementing traditional monitoring:
- Detection sensitivity: Identifies species at extremely low densities
- Multi-species surveys: Single sample reveals entire vertebrate community
- Cost efficiency: £200-400 per sample site for comprehensive analysis
- Temporal resolution: Recent presence detection (days to weeks)
Acoustic Monitoring Integration
Automated recording units capture vocalizations, providing:
- Predator presence confirmation (howls, calls)
- Prey alarm behavior documentation
- Breeding activity evidence
- Minimal site disturbance
Remote Sensing and Habitat Response
Satellite and drone imagery document landscape-scale cascade effects:
- Vegetation recovery mapping (reduced browsing pressure)
- Habitat structure changes (woodland regeneration)
- Prey distribution shifts (thermal imaging surveys)
- Connectivity assessment (movement corridor identification)
Challenges and Solutions in Cascade Metric Implementation
Challenge 1: Attribution Complexity
Problem: Multiple factors influence ecosystem change beyond predator reintroduction.
Solution: Establish control sites without predator reintroduction for comparative analysis. Use before-after-control-impact (BACI) study designs to isolate predator effects.
Challenge 2: Long Detection Lags
Problem: Trophic cascade effects may take 5-10 years to fully manifest.
Solution: Implement phased monitoring with early indicators (predator behavior, immediate prey responses) alongside long-term metrics (vegetation recovery, food web restructuring).
Challenge 3: Resource Constraints
Problem: Comprehensive monitoring requires significant investment.
Solution: Prioritize cost-effective methods (camera traps, scat analysis) during early phases. Reserve expensive techniques (stable isotope analysis, DNA metabarcoding) for critical assessment periods. Consider habitat banking arrangements that pool monitoring resources across multiple BNG sites.
Challenge 4: Technical Expertise Requirements
Problem: Advanced analytical techniques require specialized training.
Solution: Develop partnerships with academic institutions and specialist consultancies. Invest in professional development for surveying teams. Utilize standardized protocols that enable consistent data collection by generalist surveyors with specialist analysis by experts.
Case Study Applications: Practical Examples
Pine Marten Reintroduction in Woodland BNG Sites
Pine martens, reintroduced to several English woodlands, provide an accessible predator reintroduction model:
Measurable Outcomes:
- 40-60% reduction in grey squirrel populations within 3 years
- Increased songbird nesting success (reduced nest predation)
- Enhanced woodland regeneration (reduced bark stripping)
- Mesopredator suppression (reduced stoat/weasel activity)
Monitoring Approach: Monthly camera trap surveys at 20 stations, quarterly scat analysis, annual vegetation assessments, biennial stable isotope sampling.
Beaver Ecosystem Engineering and Cascade Effects
While not apex predators, beavers trigger dramatic trophic cascades through habitat modification:
Quantifiable Metrics:
- Wetland area expansion (ha created)
- Aquatic invertebrate diversity increases
- Fish population responses
- Riparian vegetation succession
- Predator utilization of created habitats
Survey Integration: Combines traditional BNG habitat assessments with specialized cascade metrics, demonstrating how ecosystem engineers complement predator reintroductions.
Regulatory Considerations and Future Developments
Current BNG Legislation and Trophic Cascades
The 2026 BNG framework recognizes ecosystem function restoration but lacks specific guidance on trophic cascade quantification. Surveyors must ensure that predator reintroduction monitoring aligns with statutory BNG requirements while exceeding minimum standards to capture cascade effects.
Emerging Policy Directions
Recent developments in ecosystem condition assessment tools, such as CreditNature's Ecosystem Condition Index, explicitly incorporate trophic cascades as measurable components.[6] This signals growing regulatory recognition of food web restoration value, potentially influencing future BNG metric revisions.
International Best Practices
Large-scale nature recovery initiatives across Europe provide valuable precedents. Ecological restoration frameworks increasingly emphasize functional ecosystem processes, including trophic interactions, as essential restoration targets.[2] UK surveyors can adapt these international standards to BNG contexts.
Practical Implementation Roadmap for Surveyors
Phase 1: Pre-Reintroduction Assessment (Months 1-6)
- Conduct comprehensive baseline surveys across all trophic levels
- Establish camera trap grid and initiate background monitoring
- Complete initial vegetation and herbivore assessments
- Collect baseline scat samples from existing predator community
- Develop site-specific monitoring protocols and success criteria
Phase 2: Reintroduction and Establishment (Years 1-2)
- Implement intensive monitoring schedule (monthly data collection)
- Document predator movements, survival, and reproduction
- Track immediate prey behavioral responses
- Monitor mesopredator populations for early suppression signals
- Conduct first-year comparative analysis against baseline
Phase 3: Integration Assessment (Years 3-5)
- Transition to quarterly monitoring frequency
- Conduct first stable isotope analysis campaign
- Assess vegetation recovery indicators
- Document prey population restructuring
- Prepare mid-term BNG compliance report with cascade metrics
Phase 4: Long-Term Monitoring (Years 6-30)
- Implement biannual monitoring schedule
- Conduct five-year comprehensive assessments
- Adjust protocols based on adaptive management principles
- Maintain photographic and genetic sample archives
- Contribute data to regional food web restoration databases
Conclusion
Trophic Cascade Restoration Metrics: Surveyor Guides to Quantifying Predator Reintroductions in 2026 BNG Sites represents a critical evolution in biodiversity monitoring. As England's BNG framework matures, the ability to quantify ecosystem-level restoration through predator reintroductions will increasingly differentiate high-quality habitat creation from simple area-based compliance.
The integration of camera trap protocols, scat analysis techniques, and stable isotope metrics provides surveyors with a comprehensive toolkit for documenting trophic cascade effects. These methods deliver scientifically rigorous evidence of food web restoration while remaining practical for implementation across diverse BNG sites.
Key success factors include:
- Establishing robust baselines before predator reintroduction
- Implementing systematic monitoring protocols with appropriate temporal resolution
- Combining multiple data sources for comprehensive cascade assessment
- Maintaining long-term commitment to monitoring throughout 30-year BNG periods
- Adapting protocols based on emerging technologies and regulatory guidance
Actionable Next Steps
For biodiversity surveyors preparing to monitor predator reintroductions in BNG sites:
- Review your current monitoring protocols to identify gaps in trophic cascade metrics
- Invest in camera trap infrastructure as the foundation of cost-effective predator monitoring
- Develop partnerships with laboratories offering stable isotope and DNA analysis services
- Create site-specific monitoring plans that integrate cascade metrics with standard BNG assessments
- Engage with emerging ecosystem condition frameworks that recognize food web restoration value
- Document your methodologies thoroughly to contribute to evolving best practices
The restoration of functional food webs through predator reintroductions offers tremendous potential for achieving genuine biodiversity net gain. By implementing the surveying approaches outlined in this guide, professionals can quantify these transformative ecosystem changes with the rigor that both scientific standards and regulatory compliance demand.
For additional guidance on implementing biodiversity net gain strategies or understanding BNG assessment requirements, consult with specialized biodiversity surveying professionals who can tailor monitoring approaches to your specific site conditions and restoration objectives.
References
[1] Full – https://www.frontiersin.org/journals/marine-science/articles/10.3389/fmars.2022.920745/full
[2] Ecological Restoration Large Scale Nature Recovery – https://cieem.net/wp-content/uploads/2025/04/Ecological-Restoration-Large-Scale-Nature-Recovery.pdf
[3] A New Framework Minimize Costs And Maximize – https://www.usgs.gov/programs/climate-adaptation-science-centers/news/a-new-framework-minimize-costs-and-maximize
[4] Ecog – https://nsojournals.onlinelibrary.wiley.com/doi/10.1111/ecog.07366
[6] Creditnature Metric Bridges Biodiversity Indices – https://creditnature.com/2024/05/13/creditnature-metric-bridges-biodiversity-indices/
