
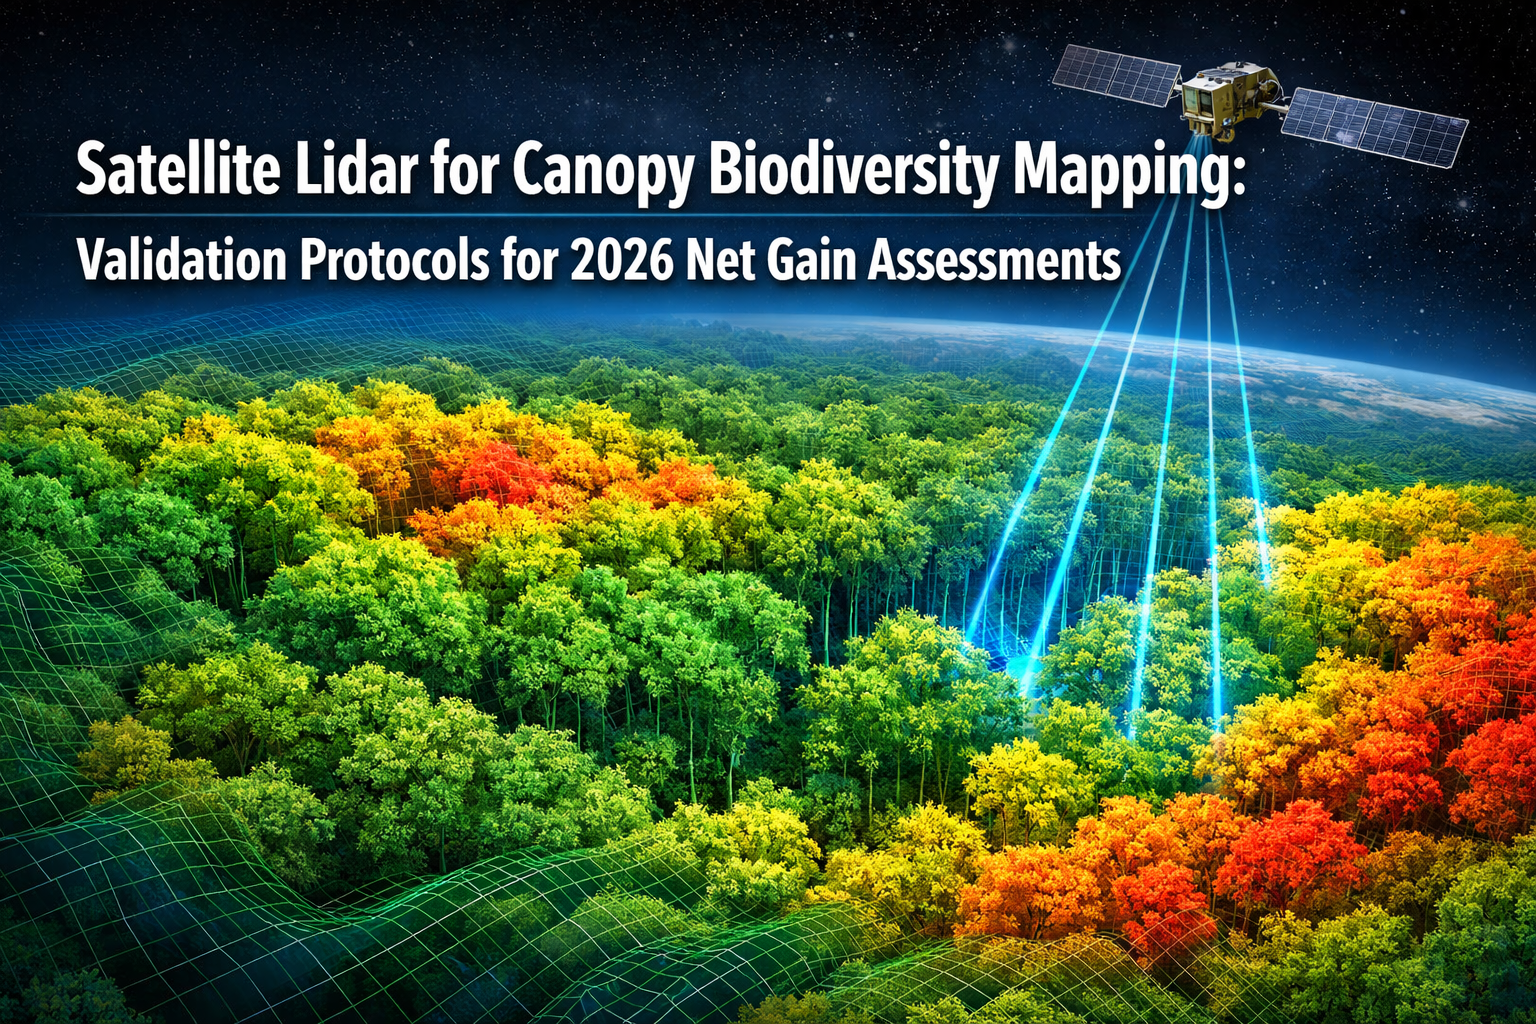
Recent advances in satellite-based lidar technology have achieved canopy height mapping accuracy within 4.54 meters mean absolute error across African dense forests, marking a breakthrough moment for biodiversity assessments at unprecedented scales.[1] This level of precision transforms how environmental professionals approach Biodiversity Net Gain (BNG) requirements in 2026, particularly as deforestation pressures intensify and regulatory scrutiny increases. Satellite Lidar for Canopy Biodiversity Mapping: Validation Protocols for 2026 Net Gain Assessments represents the convergence of space technology, ecological science, and compliance frameworks that developers, landowners, and surveyors must navigate.
The ability to generate three-dimensional forest structure data from orbit eliminates traditional survey limitations while introducing new validation challenges. As Biodiversity Net Gain assessments become mandatory across development projects, understanding how to verify satellite-derived canopy metrics against ground truth becomes essential for defensible baseline documentation.
Key Takeaways
- 🛰️ Satellite lidar systems now achieve 4.54-meter accuracy for canopy height mapping, enabling scalable biodiversity baseline assessments across large development sites
- ✅ Multi-source validation protocols combining airborne LiDAR, GEDI satellite data, and field measurements provide robust verification for BNG compliance
- 📊 10-meter resolution mapping delivers actionable canopy structure data for calculating habitat condition scores and biodiversity unit accounting
- 🌳 Validation checklists help surveyors ensure satellite-derived metrics meet statutory requirements for Biodiversity Net Gain documentation
- 🔄 Annual monitoring capabilities from satellite platforms support long-term habitat management verification and net gain maintenance obligations
Understanding Satellite Lidar Technology for Canopy Assessment
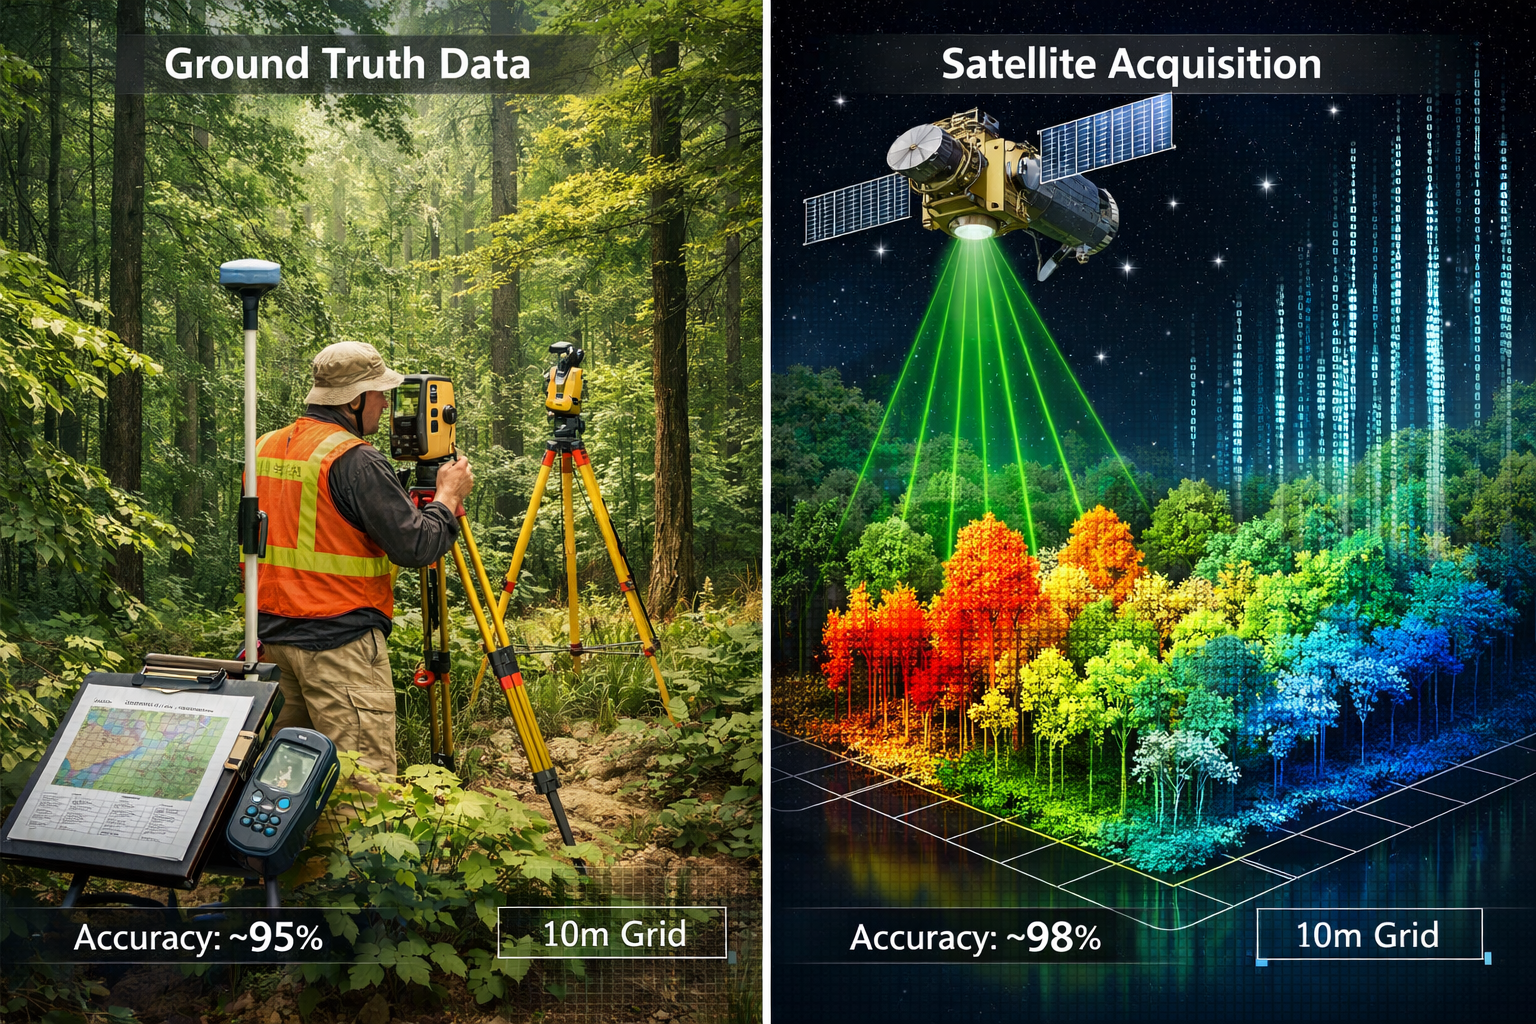
How Satellite Lidar Differs from Traditional Survey Methods
Satellite lidar (Light Detection and Ranging) operates fundamentally differently from conventional ground-based biodiversity surveys. Instead of walking transects and manually recording vegetation characteristics, satellite sensors emit laser pulses that penetrate forest canopies and measure the time taken for reflected signals to return. This generates precise three-dimensional point clouds representing canopy structure, height variation, and vertical complexity.
Key advantages of satellite lidar for canopy biodiversity mapping include:
- Spatial coverage: Single satellite passes cover thousands of hectares versus limited ground survey areas
- Temporal consistency: Standardized acquisition protocols eliminate seasonal surveyor variation
- Vertical resolution: Captures complete canopy profile from ground to crown rather than estimated heights
- Accessibility: Maps remote or inaccessible terrain without physical site access requirements
- Cost efficiency: Reduces field time while increasing data density for large-scale assessments
Recent developments like the SERA-H model achieve 2.5-meter resolution canopy height maps using Sentinel-1 and Sentinel-2 satellite data, validated against high-resolution airborne LiDAR reference datasets.[3] This resolution proves sufficient for distinguishing individual large trees and canopy gaps critical to biodiversity habitat assessments.
The Science Behind Canopy Biodiversity Indicators
Canopy height and structural complexity serve as reliable proxies for biodiversity value because they correlate strongly with habitat condition metrics used in Biodiversity Net Gain calculations. Taller, more structurally diverse canopies typically indicate:
- Greater species richness across taxonomic groups
- Enhanced vertical habitat stratification for birds, bats, and invertebrates
- Higher aboveground biomass and carbon storage capacity
- Mature forest characteristics with ecological continuity
- Microclimate regulation supporting understory biodiversity
A 2025 validation study demonstrated that satellite-derived canopy height models could predict aboveground biomass with mean absolute error of 79.65 Mg/ha—substantially improving on previous datasets like ESA-CCI and GEDI L4B products.[1] This biomass accuracy matters for BNG assessments because habitat condition scoring incorporates structural attributes directly influenced by canopy development stage.
Current Satellite Lidar Platforms and Capabilities
Several operational satellite systems provide canopy mapping data suitable for 2026 net gain assessments:
| Platform | Resolution | Coverage | Key Advantages |
|---|---|---|---|
| GEDI (NASA) | 25m footprints | Tropical/temperate | Direct canopy height measurement |
| Sentinel-1/2 (ESA) | 10-30m | Global | Frequent revisit, free access |
| ICESat-2 (NASA) | 17m footprints | Global | High vertical accuracy |
| Commercial lidar | 0.5-5m | On-demand | Highest resolution, cost premium |
The combination of freely available Sentinel data with targeted commercial acquisitions creates practical workflows for developers conducting biodiversity impact assessments. Sentinel's 10-meter resolution matches the spatial scale of UK habitat parcels used in statutory biodiversity metric calculations.
Validation Protocols for Satellite Lidar Canopy Data
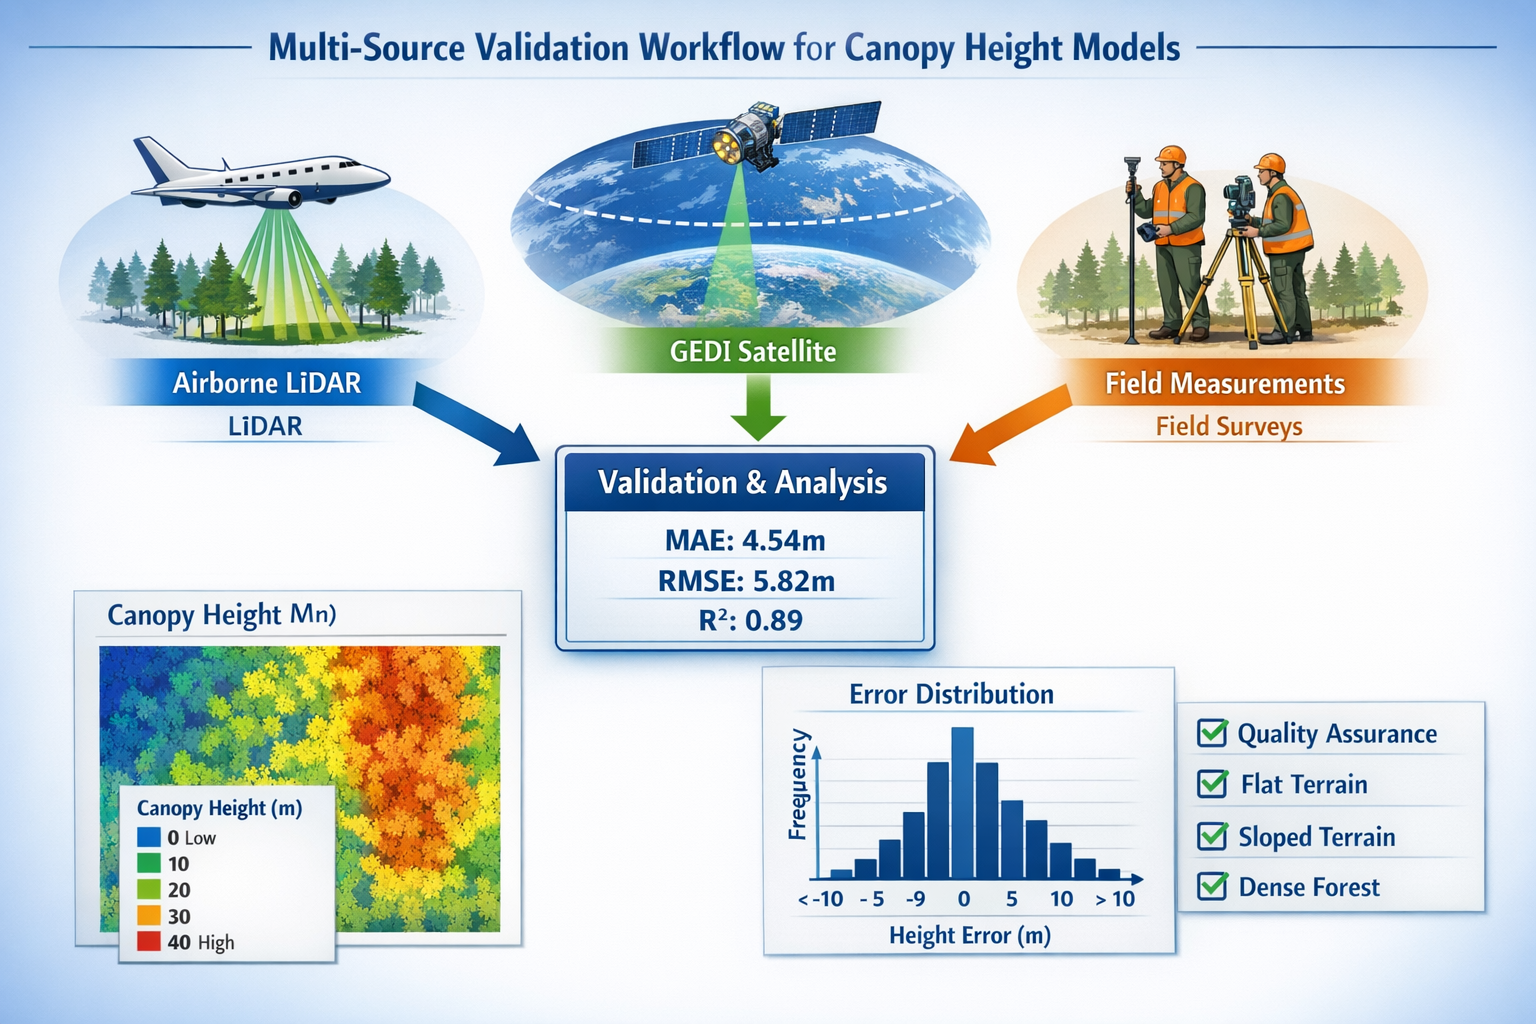
Multi-Source Validation Framework
Robust validation of satellite-derived canopy metrics requires comparison against independent reference datasets. The most defensible approach employs three validation tiers:
Tier 1: Airborne Laser Scanning (ALS) Reference Data
Airborne lidar collected from aircraft or drones provides the highest-quality validation standard. Recent French LiDAR HD campaigns achieved 1.5-meter resolution reference datasets used to validate satellite models.[3] For BNG assessments, commissioning targeted airborne surveys over representative sample areas (typically 5-10% of total site area) establishes ground truth for satellite model accuracy.
Tier 2: GEDI Satellite Cross-Validation
NASA's GEDI instrument provides independent spaceborne lidar measurements suitable for cross-checking canopy height models. While GEDI's 25-meter footprints don't match the resolution of other satellite products, they offer statistically valid sampling across terrain types without additional cost. Studies demonstrate GEDI validation reduces systematic bias in canopy height estimates.[2]
Tier 3: Field Measurement Verification
Traditional ground surveys measuring tree heights with clinometers, laser rangefinders, or measuring poles remain essential for final validation. Field teams should collect measurements at stratified random locations representing the full range of canopy conditions present across the assessment area.
Statistical Accuracy Thresholds for BNG Compliance
For satellite lidar data to support statutory Biodiversity Net Gain requirements, validation must demonstrate acceptable accuracy levels. Based on current research and regulatory guidance, recommended thresholds include:
- Mean Absolute Error (MAE): ≤ 5 meters for canopy height
- Root Mean Square Error (RMSE): ≤ 6 meters for height predictions
- Coefficient of Determination (R²): ≥ 0.75 for height correlations
- Bias: ≤ ±2 meters systematic over/underestimation
The 2025 African forest study achieved MAE of 4.54 meters, meeting these thresholds and demonstrating that contemporary satellite methods deliver compliance-grade accuracy.[1] However, accuracy varies by terrain type, with steeper slopes and denser canopies typically showing larger errors requiring correction factors.
Field Validation Checklist for Surveyors
Biodiversity surveyors validating satellite lidar products for 2026 net gain assessments should follow systematic protocols:
Pre-Field Planning:
- ✅ Obtain satellite-derived canopy height raster covering full assessment area
- ✅ Stratify site by habitat type and canopy height classes
- ✅ Generate random validation points (minimum 30 per habitat type)
- ✅ Prepare field data sheets with coordinates and predicted heights
- ✅ Calibrate measurement equipment (laser rangefinder, clinometer)
Field Data Collection:
- ✅ Navigate to validation points using high-accuracy GPS (≤3m error)
- ✅ Measure canopy height using standardized protocols (tallest tree within 5m radius)
- ✅ Record tree species, DBH (diameter at breast height), and condition
- ✅ Photograph canopy structure from four cardinal directions
- ✅ Document terrain slope and aspect affecting measurement accuracy
- ✅ Note any factors limiting satellite visibility (cloud, shadow, phenology)
Post-Field Analysis:
- ✅ Calculate MAE, RMSE, and bias between field and satellite measurements
- ✅ Generate scatter plots showing correlation strength
- ✅ Identify systematic errors by habitat type or terrain class
- ✅ Apply correction factors if bias exceeds ±2 meters
- ✅ Document validation results in BNG assessment report appendix
This systematic approach ensures satellite-derived baseline data withstands regulatory scrutiny and provides defensible evidence for achieving biodiversity net gain targets.
Integrating Validated Canopy Data into 2026 Net Gain Assessments
Translating Canopy Metrics to Habitat Condition Scores
The UK Biodiversity Metric 4.0 (current standard for 2026 assessments) incorporates canopy structure through several condition assessment criteria. Validated satellite lidar data directly informs:
Criterion: Vegetation Structure
Canopy height variation indicates structural diversity. Sites with coefficient of variation >30% in height measurements typically score higher for vertical complexity. Satellite-derived height standard deviation provides objective quantification replacing subjective surveyor assessment.
Criterion: Tree Age and Maturity
Canopy height correlates with stand age. Research-validated height-age relationships for common UK woodland types enable age class estimation from satellite measurements:
- Heights >20m typically indicate mature woodland (>80 years)
- Heights 12-20m suggest semi-mature stands (40-80 years)
- Heights <12m represent young woodland (<40 years)
Criterion: Canopy Cover Percentage
Lidar penetration rates quantify canopy closure. Areas where <5% of laser pulses reach ground indicate dense canopy (>80% cover), while >20% ground returns suggest open canopy (<50% cover).
Calculating Biodiversity Units from Satellite Data
Once validated canopy metrics are translated to condition scores, biodiversity unit calculations follow standard metric methodology:
Baseline Biodiversity Units = Habitat Area (ha) × Habitat Distinctiveness × Habitat Condition × Strategic Significance
Satellite lidar enhances accuracy in three components:
- Habitat Area: Precise delineation of woodland parcels from canopy boundaries
- Habitat Condition: Objective structural metrics replacing subjective assessment
- Temporal Consistency: Repeat satellite acquisitions document condition trends
For example, a 5-hectare broadleaved woodland site with:
- Distinctiveness: 6 (medium)
- Condition: 2.5 (moderate, from validated canopy metrics)
- Strategic Significance: 1.15 (location multiplier)
Generates baseline units: 5 × 6 × 2.5 × 1.15 = 86.25 biodiversity units
The 10% net gain requirement mandates post-development units reach 94.88, with satellite monitoring verifying achievement over the 30-year obligation period.
Documentation Requirements for Planning Authorities
Planning authorities reviewing Biodiversity Net Gain reports require transparent documentation of satellite data validation. Essential report components include:
Methodology Section:
- Satellite platform specifications (sensor, acquisition date, resolution)
- Processing workflow (algorithms, corrections applied)
- Validation approach (reference datasets, sample size, statistical methods)
- Accuracy assessment results (MAE, RMSE, R², confidence intervals)
Appendices:
- Validation point locations and measurements (tabular format)
- Scatter plots comparing satellite vs. reference heights
- Canopy height maps with accuracy overlays
- Field survey photographs and measurement protocols
- Metadata for all geospatial datasets
Quality Assurance Statement:
Professional ecologists should certify that satellite-derived baseline data meets British Standard BS 42020:2013 requirements for biodiversity information supporting planning decisions. This certification confirms validation protocols followed best practice and achieved acceptable accuracy thresholds.
Addressing Validation Challenges in Complex Terrain
Steep Slopes and Aspect Effects
Satellite lidar accuracy degrades on steep terrain where laser beam geometry creates positioning uncertainty. Slopes exceeding 20° typically show 20-30% increased height errors. Validation protocols must account for this by:
- Increasing field sample density in sloped areas (1.5× standard sampling rate)
- Applying slope-correction algorithms to satellite height estimates
- Documenting terrain-specific accuracy separately in validation reports
- Considering airborne lidar supplementation for sites with >30% steep terrain
Seasonal Phenology and Leaf-Off Conditions
Deciduous woodland canopy height varies by 2-4 meters between leaf-on and leaf-off seasons due to crown structure differences. For BNG assessments requiring winter surveys (e.g., bat roost potential), satellite acquisitions should match field survey timing:
- Leaf-on validation (May-September): Full canopy development, maximum biodiversity activity
- Leaf-off validation (November-March): Structural assessment, understory visibility
Multi-temporal satellite acquisitions capturing both conditions provide comprehensive habitat characterization supporting off-site or on-site delivery decisions.
Edge Effects and Boundary Accuracy
Woodland edges show reduced lidar accuracy due to mixed pixels and geometric distortion. Validation should exclude 5-10 meter buffer zones from edge boundaries when calculating accuracy statistics, while separately documenting edge habitat characteristics critical to connectivity assessments.
Future Developments in Satellite Biodiversity Monitoring
Emerging Technologies for 2026 and Beyond
Several technological advances will enhance satellite lidar validation protocols:
Hyperspectral Integration: Combining canopy height data with spectral signatures enables species-level identification. NASA's upcoming SBG (Surface Biology and Geology) mission will provide 30-meter hyperspectral imagery supporting detailed habitat classification.
AI-Enhanced Processing: Deep learning models like SERA-H demonstrate how artificial intelligence improves resolution and accuracy.[3] Expect continued refinement reducing validation requirements as model confidence increases.
Continuous Monitoring Networks: Constellations of small satellites will enable monthly or even weekly canopy monitoring, transforming one-time baseline assessments into dynamic habitat tracking systems.
Implications for Long-Term Net Gain Obligations
The 30-year monitoring requirement for biodiversity net gain creates unprecedented demand for cost-effective verification. Satellite lidar offers compelling advantages:
- Reduced site visit frequency: Annual satellite updates replace quarterly field surveys
- Objective change detection: Automated algorithms identify canopy loss or degradation
- Compliance documentation: Timestamped satellite archives provide audit trail
- Early intervention: Rapid detection of habitat decline triggers management responses
Planners and developers should incorporate satellite monitoring into habitat management plans, specifying validation protocols, accuracy thresholds, and response triggers for detected changes.
Practical Implementation for Different Stakeholders
For Developers and Project Managers
Integrating Satellite Lidar for Canopy Biodiversity Mapping: Validation Protocols for 2026 Net Gain Assessments into project workflows requires strategic planning:
Early-Stage Feasibility:
- Commission preliminary satellite canopy assessment during site selection
- Identify high-value woodland requiring detailed validation
- Budget for validation surveys (typically £2,000-5,000 per site)
Planning Application Stage:
- Procure validated satellite baseline data meeting accuracy thresholds
- Engage accredited ecologists for validation certification
- Include satellite monitoring in 30-year management plan
Post-Development Monitoring:
- Schedule annual satellite acquisitions with validation every 5 years
- Establish automated change detection alerts
- Maintain documentation for local planning authority audits
For Ecological Consultants and Surveyors
Professional surveyors should develop satellite validation competencies:
Technical Skills:
- GIS software proficiency (QGIS, ArcGIS) for canopy data analysis
- Statistical validation methods (regression analysis, error metrics)
- Remote sensing fundamentals (sensor characteristics, atmospheric corrections)
Quality Standards:
- Follow CIEEM (Chartered Institute of Ecology and Environmental Management) guidance
- Document validation protocols in technical appendices
- Maintain professional indemnity insurance covering remote sensing advice
Service Offerings:
- Package satellite baseline mapping with traditional Phase 1 habitat surveys
- Offer annual monitoring subscriptions for long-term BNG obligations
- Provide expert witness services for planning appeals involving satellite data
For Landowners and Habitat Bankers
Those selling biodiversity units benefit from satellite validation through:
Enhanced Credibility:
- Independently verified baseline data increases buyer confidence
- Transparent validation documentation reduces negotiation friction
- Objective monitoring demonstrates habitat management effectiveness
Cost Efficiency:
- Satellite monitoring reduces ongoing survey costs across large land holdings
- Economies of scale for multi-site portfolios
- Reduced access requirements minimize operational disruption
Market Differentiation:
- Certified satellite-validated units command premium pricing
- Technology-enabled monitoring attracts institutional buyers
- Future-proof approach aligns with emerging regulatory standards
Conclusion
Satellite Lidar for Canopy Biodiversity Mapping: Validation Protocols for 2026 Net Gain Assessments represents a paradigm shift in how environmental professionals establish biodiversity baselines and verify habitat outcomes. The convergence of 4.54-meter accuracy, 10-meter resolution mapping, and multi-source validation frameworks creates unprecedented opportunities for scalable, defensible BNG compliance.[1]
As deforestation pressures intensify and regulatory scrutiny increases, the ability to objectively quantify canopy structure across entire development sites—rather than extrapolating from limited ground samples—fundamentally strengthens biodiversity impact assessments. The validation protocols outlined here ensure satellite-derived metrics withstand planning authority review while reducing field survey costs and timelines.
Actionable Next Steps
For immediate implementation:
- Request satellite canopy baseline data for upcoming development sites using freely available Sentinel products
- Budget validation surveys following the field checklist provided, targeting 30+ measurement points per habitat type
- Engage accredited ecologists experienced in remote sensing validation to certify accuracy meets BNG requirements
- Incorporate satellite monitoring into 30-year habitat management plans with defined validation intervals
- Document validation protocols transparently in planning application materials to expedite approval
For strategic positioning:
- Develop in-house GIS capabilities for processing satellite canopy data
- Establish relationships with commercial satellite data providers for high-resolution acquisitions
- Participate in industry working groups developing standardized validation protocols
- Monitor emerging technologies (hyperspectral, AI-enhanced processing) for competitive advantage
The regulatory landscape for Biodiversity Net Gain continues evolving, but satellite lidar validation protocols provide a technology foundation that will remain relevant as standards mature. Organizations investing in these capabilities today position themselves as leaders in evidence-based biodiversity management—delivering measurable conservation outcomes while meeting statutory obligations efficiently.
The forest canopy holds critical biodiversity value that traditional surveys struggled to quantify comprehensively. Satellite technology finally makes complete, accurate, repeatable canopy assessment practical at landscape scales. With proper validation, this capability transforms BNG from compliance burden to conservation opportunity.
References
[1] Improved canopy height mapping accuracy over African forests – https://www.frontiersin.org/journals/remote-sensing/articles/10.3389/frsen.2025.1724950/full
[2] Multi-source validation methodology – https://meetingorganizer.copernicus.org/EGU26/EGU26-16942.html
[3] High-resolution canopy height model development – https://arxiv.org/html/2512.18128v3
