
Recent research from The Jena Experiment reveals that soil biodiversity effects on ecosystems depend far more on functional processes than species counts—with nutrient cycling, organic-matter decomposition, and climate regulation providing the actual ecosystem services that biodiversity assessments aim to protect.[3] Yet most ecological surveys in 2026 still rely primarily on species presence/absence checklists, missing the functional dynamics that determine ecosystem health and resilience.
Designing surveys for ecosystem functioning: moving beyond species lists to measure nutrient cycling and energy flow in 2026 represents a fundamental shift in how we validate conservation outcomes, particularly for Biodiversity Net Gain (BNG) assessments and habitat restoration projects. This approach recognizes that two sites with identical species lists can have vastly different ecological value depending on their carbon sequestration rates, nutrient retention capacity, and trophic transfer efficiency.
This comprehensive guide explores practical methodologies for incorporating functional measurements into ecological surveys, providing developers, ecologists, and planners with actionable frameworks for more meaningful biodiversity assessments.
Key Takeaways
- Functional metrics like nutrient cycling rates and energy flow provide more accurate ecosystem health indicators than species lists alone
- Biomolecular approaches measuring specific amino acids, lipids, and carbohydrates explain nutrient dynamics better than traditional elemental analysis
- Soil biodiversity assessment must integrate decomposition rates, carbon storage, and pathogen control measurements
- Energy flux per unit standing crop determines ecosystem resilience more reliably than static biomass estimates
- Isotope tracing and spectroscopy enable real-time functional monitoring at scales impossible with traditional survey methods
Why Traditional Species Lists Fall Short for Ecosystem Functioning Assessment
Traditional biodiversity surveys focus on taxonomic diversity—counting species, recording presence/absence, and calculating diversity indices like Shannon-Wiener or Simpson's. While these metrics provide valuable baseline data, they fail to capture the functional processes that actually deliver ecosystem services.
The Functional Gap in Current Survey Methodologies
Species lists cannot answer critical questions about ecosystem performance:
- How much carbon is this woodland actually sequestering annually?
- What nutrient retention capacity does this wetland provide?
- How efficiently does energy transfer through trophic levels in this restored grassland?
- What decomposition rates support soil formation and fertility?
A 2026 publication on aquatic nutrient cycling emphasizes that moving beyond elemental composition (C, N, P) to measure specific biomolecular packages—termed "Rings of Power" including particular amino acids, lipid classes, and carbohydrate subfractions—better explains nutrient cycling patterns and ecosystem functioning.[1]
Real-World Implications for BNG Validation
For developers working with BNG requirements, this functional gap creates significant challenges:
🔴 Problem: Two restored habitats with identical species compositions may have dramatically different ecosystem service delivery
🔴 Problem: Traditional surveys cannot verify whether created habitats actually function as intended
🔴 Problem: Species establishment timelines don't align with functional process development
✅ Solution: Integrate functional measurements that directly assess ecosystem service provision
Designing Surveys for Ecosystem Functioning: Core Measurement Categories in 2026
Effective functional surveys in 2026 incorporate four primary measurement domains: nutrient cycling, energy flow, decomposition processes, and trophic dynamics. Each requires specific methodologies and equipment beyond traditional survey tools.
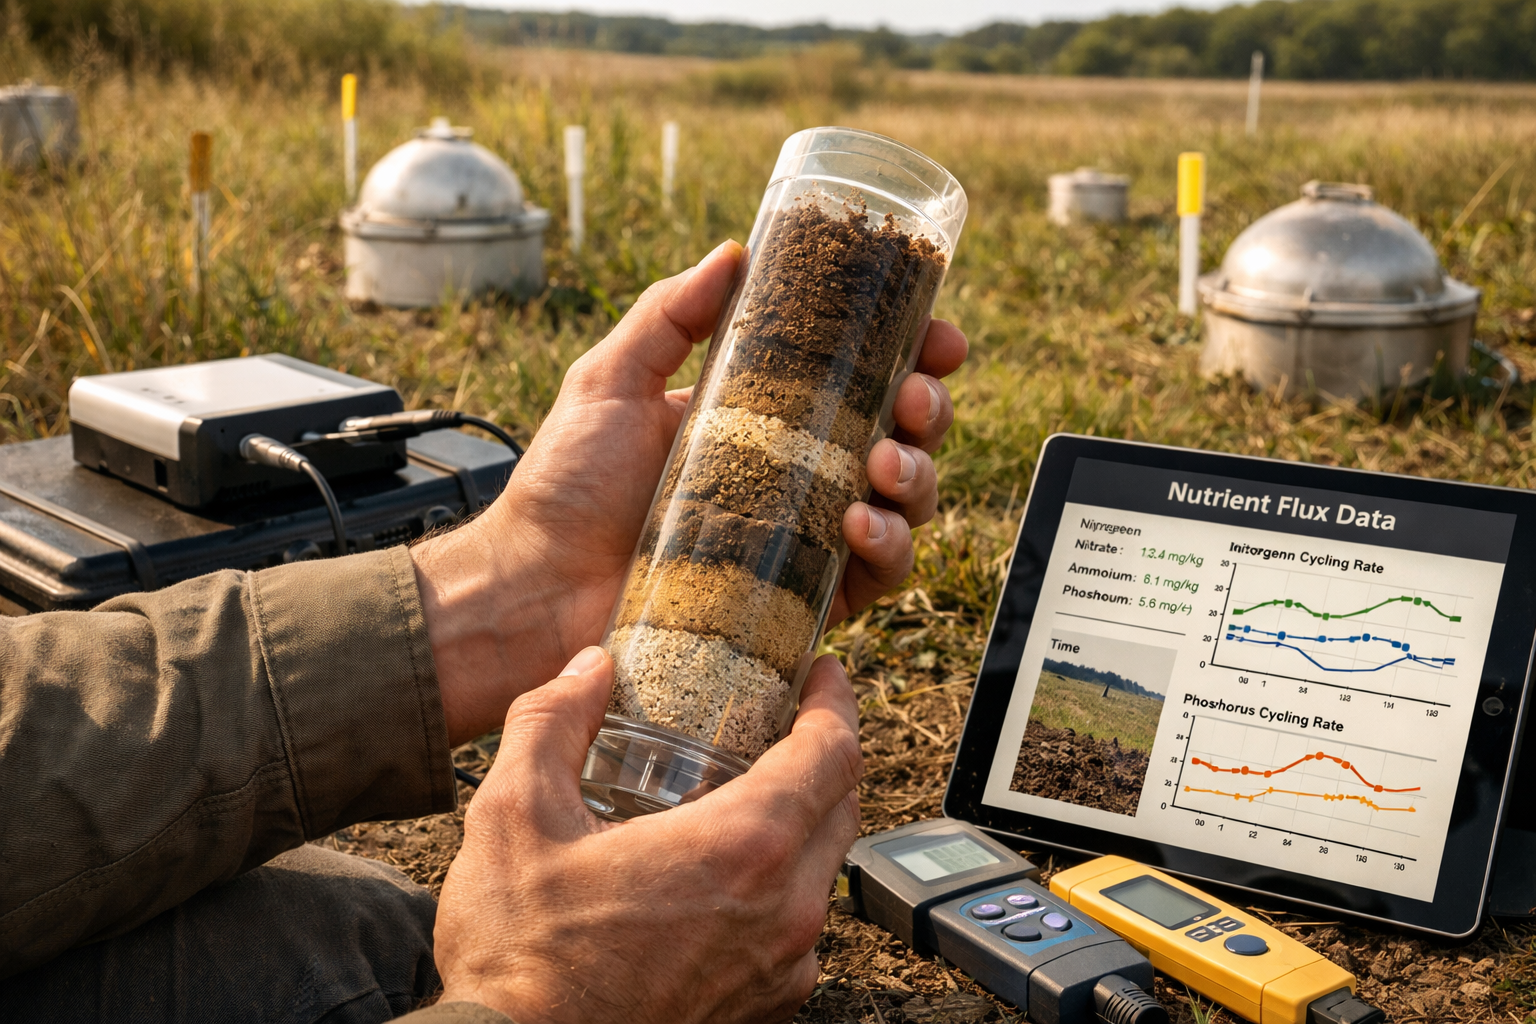
Nutrient Cycling Measurements
Nutrient cycling assessment focuses on the rates and pathways of essential elements moving through ecosystems rather than static concentrations.
Key Metrics for Nutrient Cycling Surveys
| Measurement | Method | Application |
|---|---|---|
| Nitrogen mineralization rate | Buried bag incubation | Soil fertility, productivity potential |
| Phosphorus availability | Resin capsule extraction | Plant growth limitation assessment |
| Carbon flux | Eddy covariance towers | Climate regulation services |
| Denitrification rate | Acetylene inhibition technique | Water quality protection |
| Nutrient retention efficiency | Input-output budgets | Pollution control capacity |
The International Conference on Ecosystem Functioning and Nutrient Cycling held in Dubai in February 2026 highlighted carbon cycling, nitrogen cycling, and phosphorus cycling as focal areas for current ecosystem assessment methodologies, emphasizing process rates over static measurements.[5]
Practical Implementation for Development Projects
For small development projects requiring BNG compliance, simplified nutrient cycling assessments might include:
- Soil respiration measurements using portable CO₂ analyzers (quarterly monitoring)
- Plant tissue analysis for nitrogen and phosphorus uptake rates
- Litter decomposition bags standardized across baseline and created habitats
- Ion exchange resin capsules for plant-available nutrient assessment
These methods provide quantifiable functional data that complement traditional species surveys without requiring specialized laboratory facilities.
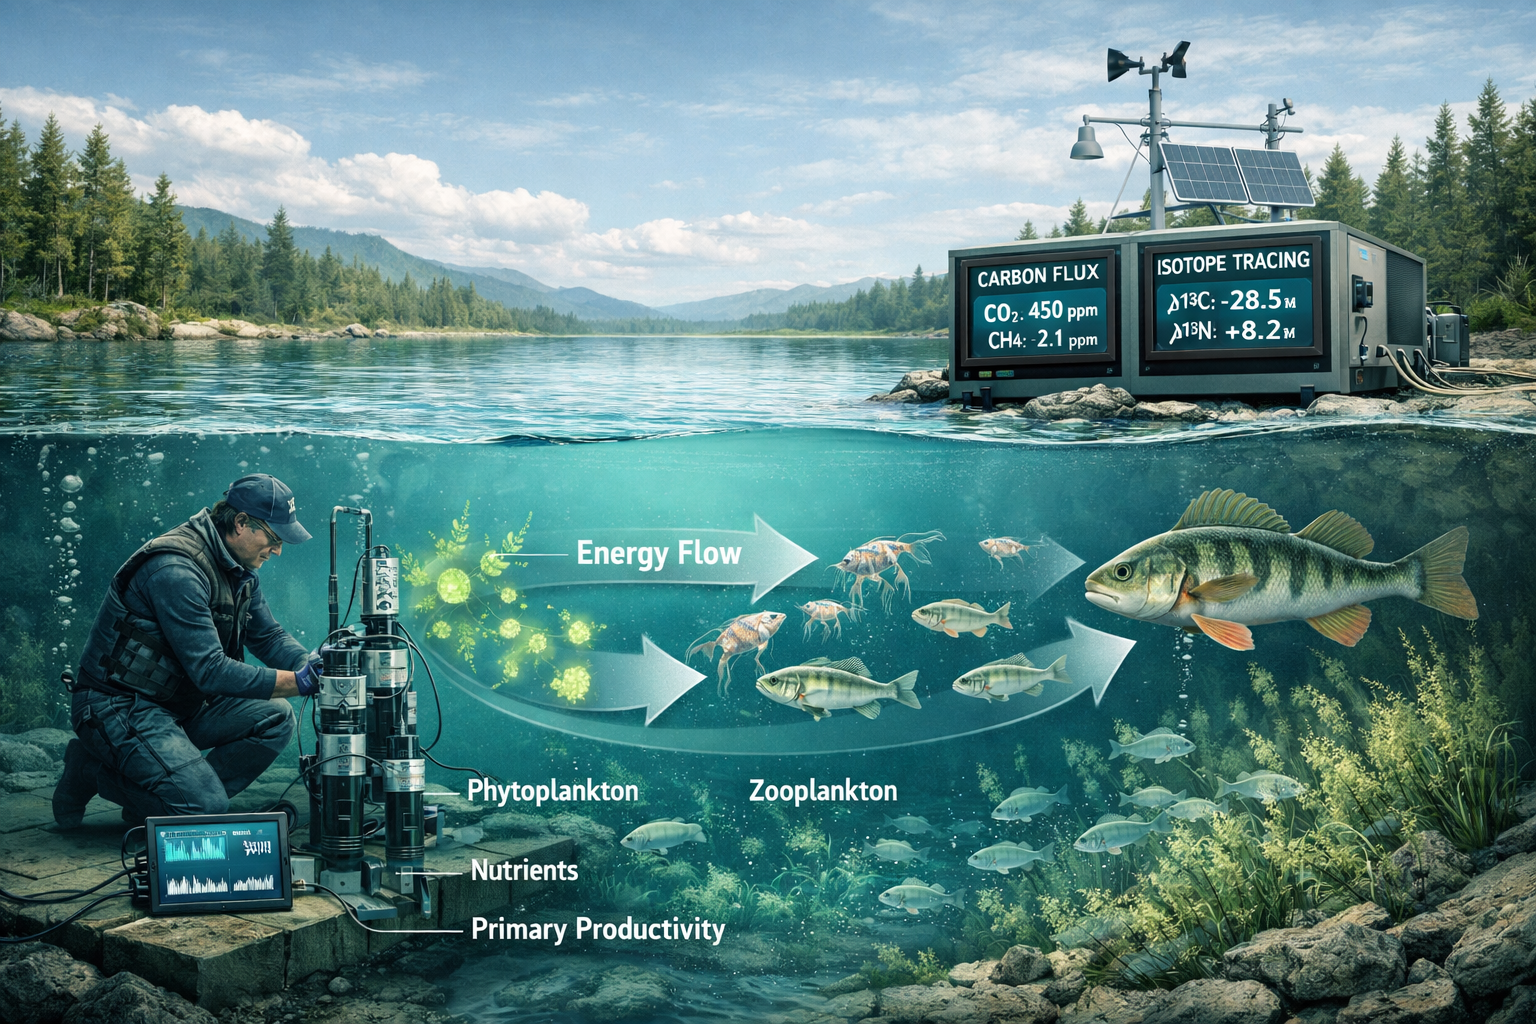
Energy Flow and Trophic Dynamics: Measuring What Matters
Energy flow through ecosystems determines their productivity, resilience, and capacity to support biodiversity. Research demonstrates that ecosystem resilience depends on energy flux per unit standing crop rather than total biomass.[4]
Quantifying Energy Transfer Efficiency
Designing surveys for ecosystem functioning: moving beyond species lists to measure nutrient cycling and energy flow in 2026 requires understanding trophic transfer efficiency—the percentage of energy passed from one trophic level to the next.
Essential Energy Flow Metrics
Primary Production Measurements:
- Gross Primary Productivity (GPP): Total photosynthetic carbon fixation
- Net Primary Productivity (NPP): GPP minus plant respiration
- Biomass accumulation rates: Growth measurements over defined periods
Trophic Transfer Assessment:
- Secondary production: Consumer biomass increase rates
- Consumption efficiency: Proportion of production consumed by next level
- Assimilation efficiency: Proportion of consumed energy assimilated
- Production efficiency: Proportion of assimilated energy converted to biomass
Advanced Tracing Methods for Energy Flow
The 2026 International Coral Reef Society Annual Meeting featured sessions on "Tracing pelagic pathways" that emphasize quantifying energy pools to nutrient cycling using isotopes and other advanced tracing methods.[6]
Isotope Applications in Functional Surveys
Stable Isotope Analysis:
- δ¹³C and δ¹⁵N ratios reveal trophic positions and energy sources
- Isotope mixing models quantify dietary contributions
- Temporal sampling tracks energy flow changes through seasons
Radioactive Tracers (specialized applications):
- ³²P labeling tracks phosphorus movement through food webs
- ¹⁴C pulse-chase experiments measure carbon transfer rates
For most BNG assessment applications, stable isotope analysis provides sufficient resolution without requiring radioactive materials handling.
Practical Energy Flow Surveys for Habitat Creation
Implementing energy flow measurements in created or restored habitats involves:
- Establish baseline productivity: Measure reference site NPP using harvest methods or remote sensing
- Monitor biomass accumulation: Quarterly non-destructive measurements in created habitats
- Sample consumer populations: Quantify invertebrate and vertebrate secondary production
- Calculate transfer efficiency: Compare trophic level production ratios to reference ecosystems
- Assess functional equivalence: Determine when created habitats achieve comparable energy flow to targets
These measurements provide objective functional targets for habitat creation success, moving beyond subjective assessments of "similar species composition."
Soil Biodiversity and Decomposition: The Hidden Functional Engine
Soil communities drive critical ecosystem functions including nutrient cycling, organic matter decomposition, plant productivity, climate regulation, and pathogen control—yet remain poorly characterized in most biodiversity surveys.[3]
Measuring Decomposition Rates and Organic Matter Dynamics
Decomposition assessment provides direct insight into nutrient cycling capacity and carbon sequestration potential.
Standardized Decomposition Measurement Protocols
Litter Bag Method:
- Deploy standardized substrates (tea bags, wood dowels, or site-specific litter)
- Retrieve at predetermined intervals (30, 90, 180, 365 days)
- Calculate decomposition constants (k-values) for comparison
- Assess nutrient release rates through chemical analysis
Soil Organic Matter Analysis:
- Measure total organic carbon and nitrogen pools
- Quantify particulate vs. mineral-associated organic matter fractions
- Assess carbon stability through thermal or chemical fractionation
- Monitor temporal changes indicating accumulation or loss
Soil Biological Activity Indicators
Beyond decomposition rates, soil biological activity measurements provide functional assessment:
- Soil respiration: CO₂ efflux indicating microbial activity
- Enzyme activities: Specific enzymes (β-glucosidase, phosphatase) reveal functional capacity
- Microbial biomass: Total living microbial carbon and nitrogen
- Functional gene abundance: qPCR for nitrogen cycling genes (nitrification, denitrification)
For developers creating biodiversity plans, incorporating soil function metrics ensures that created habitats develop the below-ground processes essential for long-term sustainability.
Integrated Survey Design: Combining Taxonomic and Functional Approaches
Optimal survey design in 2026 integrates traditional taxonomic surveys with functional measurements, creating comprehensive assessments that capture both biodiversity composition and ecosystem service delivery.
Multi-Scale Survey Framework
An effective integrated survey incorporates measurements at multiple spatial and temporal scales:
Spatial Scale Integration
Plot-Level (1-10 m²):
- Species identification and abundance
- Soil respiration measurements
- Litter decomposition bags
- Vegetation productivity clips
Site-Level (0.1-10 ha):
- Community composition surveys
- Nutrient cycling rates
- Trophic structure assessment
- Habitat structure measurements
Landscape-Level (>10 ha):
- Remote sensing productivity indices (NDVI, EVI)
- Watershed nutrient budgets
- Connectivity analysis
- Ecosystem service modeling
Temporal Sampling Strategy
Functional processes vary seasonally and annually, requiring strategic temporal replication:
- Baseline establishment: Minimum 12 months pre-development
- Construction monitoring: Quarterly during active works
- Establishment phase: Quarterly for first 2 years post-creation
- Maturation monitoring: Annual assessments years 3-30
- Event-based sampling: After disturbances or management interventions
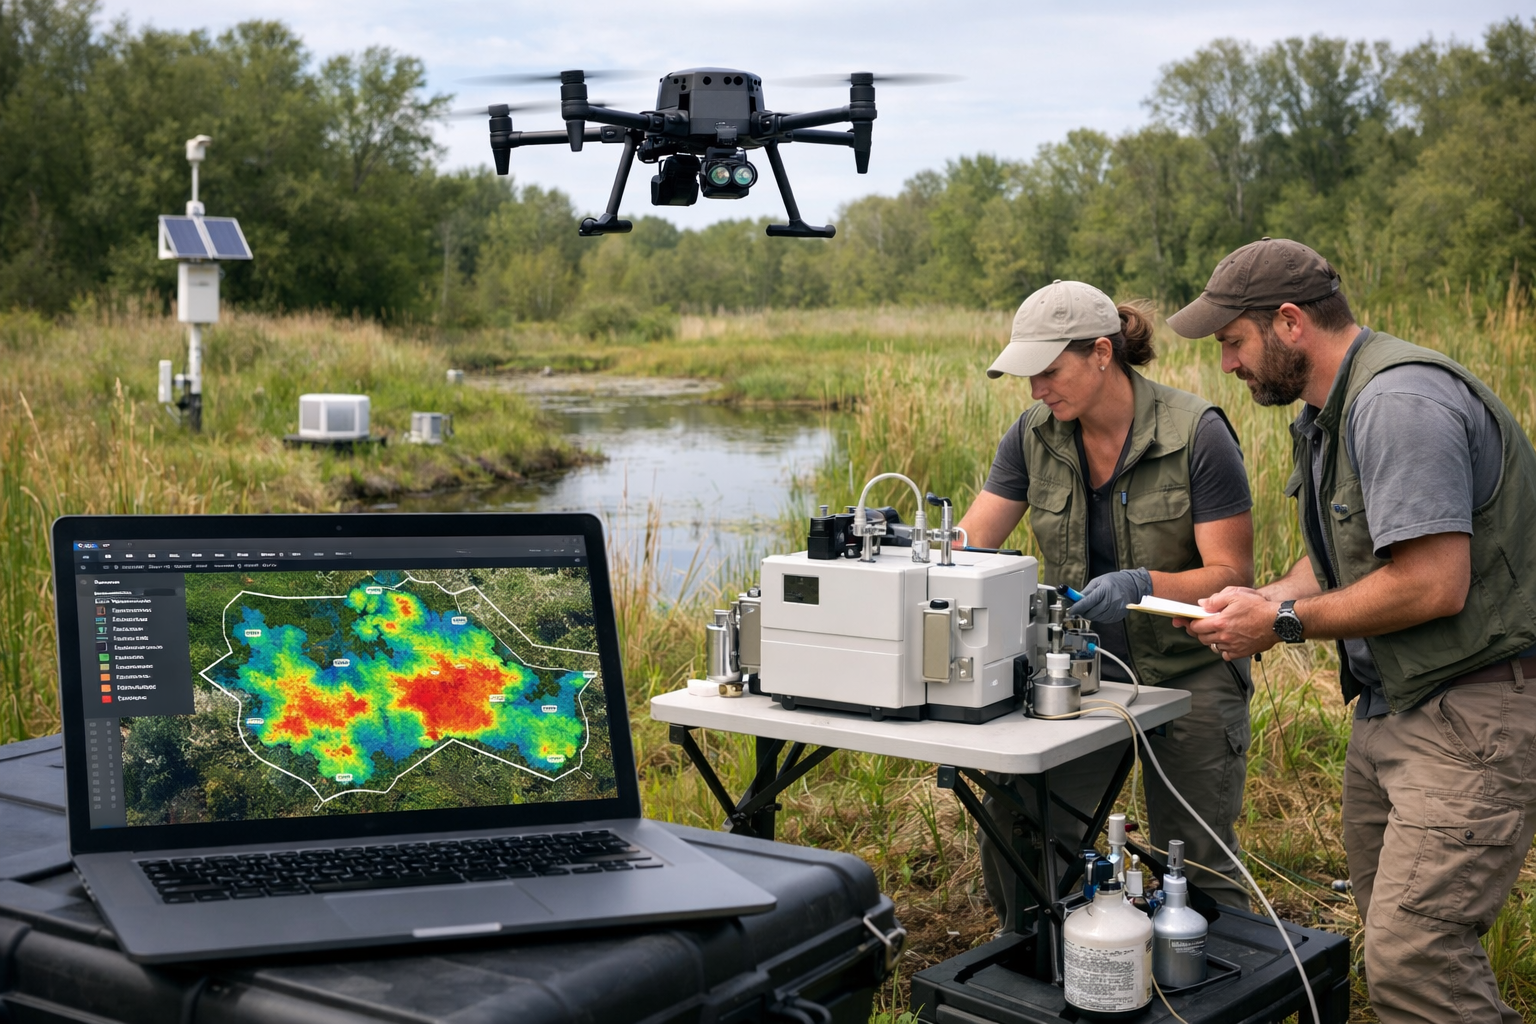
Technology Integration for Functional Surveys
Modern survey design leverages technological advances that enable functional measurements at unprecedented scales:
Remote Sensing Applications:
- Multispectral imagery: Vegetation productivity and health indices
- Thermal imaging: Evapotranspiration and water stress
- LiDAR: Structural complexity and biomass estimation
- Hyperspectral sensors: Biochemical composition and nutrient status
Sensor Networks:
- Continuous soil sensors: Moisture, temperature, nutrients
- Automated gas flux chambers: Real-time carbon and nitrogen flux
- Acoustic monitoring: Animal activity patterns and trophic interactions
- Water quality sondes: Continuous nutrient and dissolved oxygen monitoring
Data Integration Platforms:
- GIS integration: Spatial analysis of functional patterns
- Cloud-based databases: Centralized data management and sharing
- Automated reporting: Real-time dashboards for BNG compliance tracking
- Machine learning: Predictive models for functional trajectory assessment
Practical Implementation: From Theory to Field Application
Translating functional survey design into practical field implementation requires careful planning, appropriate resource allocation, and clear communication with stakeholders.
Resource Requirements and Cost Considerations
Functional surveys require different equipment and expertise than traditional taxonomic surveys:
Equipment Investment:
- Basic functional kit (£5,000-15,000): Portable soil respiration analyzer, pH/nutrient meters, decomposition materials, vegetation productivity tools
- Intermediate setup (£15,000-50,000): Add portable spectroscopy, automated data loggers, isotope sampling equipment
- Advanced systems (£50,000+): Eddy covariance towers, sensor networks, drone-mounted multispectral sensors
Expertise Requirements:
- Soil biogeochemistry: Understanding nutrient cycling processes and analytical methods
- Ecosystem ecology: Interpreting energy flow and trophic dynamics
- Data analysis: Statistical modeling of process rates and functional trajectories
- Technology integration: Operating and maintaining sensor systems
For projects requiring biodiversity impact assessments, functional measurements typically add 15-30% to survey costs but provide substantially greater insight into actual ecosystem service delivery.
Quality Assurance and Standardization
Functional measurements require rigorous quality control to ensure comparability:
Methodological Standardization:
- Use published protocols (e.g., Long-Term Ecological Research Network methods)
- Maintain consistent timing for seasonal measurements
- Calibrate equipment regularly against standards
- Document all methodological details for repeatability
Data Quality Management:
- Implement field data validation procedures
- Use replicate measurements to assess precision
- Apply appropriate statistical analyses accounting for temporal autocorrelation
- Archive raw data with comprehensive metadata
Inter-Site Comparability:
- Reference regional benchmarks for functional metrics
- Compare to appropriate ecosystem types and successional stages
- Account for climate and soil differences in interpretation
- Use standardized reporting units (per area, per time)
Communication with Non-Technical Stakeholders
Functional survey results must be translated effectively for planners, developers, and decision-makers:
Effective Communication Strategies:
📊 Visual representations: Graphs showing functional trajectory toward reference conditions
📈 Progress metrics: Percentage of target function achieved over time
🎯 Service-based framing: Translate functions to ecosystem services (carbon storage, water purification)
✅ Clear benchmarks: Define functional equivalence thresholds for success
For planners working with BNG requirements, functional data provides objective evidence that created habitats deliver intended ecosystem services, not just species assemblages.
Case Study Applications: Functional Surveys in Practice
Wetland Creation for Nutrient Retention
A 2025-2026 wetland creation project in East Anglia incorporated functional surveys to validate nutrient retention capacity:
Baseline Measurements (Reference Wetland):
- Nitrogen retention: 45% of inputs
- Phosphorus retention: 62% of inputs
- Denitrification rate: 125 kg N/ha/year
- Decomposition constant (k): 0.85 year⁻¹
Created Wetland Monitoring (Year 2):
- Nitrogen retention: 28% of inputs (62% of target)
- Phosphorus retention: 51% of inputs (82% of target)
- Denitrification rate: 78 kg N/ha/year (62% of target)
- Decomposition constant (k): 0.68 year⁻¹ (80% of target)
Outcome: Functional measurements demonstrated the created wetland was developing appropriate nutrient cycling capacity but required additional time to achieve full functional equivalence—information impossible to obtain from species lists alone.
Grassland Restoration Energy Flow Assessment
A grassland restoration project in the Midlands used trophic dynamics measurements to assess functional success:
Energy Flow Metrics:
- Primary productivity reached 85% of reference by year 3
- Invertebrate secondary production achieved 72% of reference by year 4
- Trophic transfer efficiency (primary to secondary) matched reference by year 5
- Bird foraging activity (proxy for tertiary production) reached reference levels by year 6
Key Finding: Despite achieving similar plant species composition by year 2, functional equivalence for energy flow required additional time for trophic structure development—highlighting the value of functional monitoring beyond initial establishment.
Future Directions: Emerging Technologies and Methodologies
The field of functional ecosystem assessment continues to evolve rapidly, with several emerging technologies poised to transform survey capabilities in coming years:
Environmental DNA (eDNA) for Functional Gene Assessment
Beyond species detection, eDNA metabarcoding can quantify functional gene abundance:
- Nitrogen cycling genes: Quantify nitrification and denitrification capacity
- Decomposition enzymes: Assess organic matter breakdown potential
- Symbiotic associations: Identify mycorrhizal and nitrogen-fixing partnerships
Artificial Intelligence and Machine Learning
AI applications for functional assessment include:
- Automated image analysis: Quantify vegetation productivity from drone imagery
- Predictive modeling: Forecast functional trajectory based on early indicators
- Pattern recognition: Identify functional equivalence thresholds
- Data integration: Synthesize multiple functional metrics into composite indices
Continuous Autonomous Monitoring
Autonomous sensor systems enable unprecedented temporal resolution:
- Year-round data collection: Capture seasonal and event-driven dynamics
- Real-time alerts: Identify functional degradation immediately
- Reduced field effort: Minimize repeated site visits
- Long-term datasets: Build understanding of functional development trajectories
Regulatory Context and BNG Integration
As BNG requirements mature, regulatory frameworks increasingly recognize the importance of functional ecosystem assessment:
Current Regulatory Landscape
While existing BNG metrics focus primarily on habitat condition scores that incorporate some functional elements (e.g., soil quality, vegetation structure), comprehensive functional assessment remains supplementary rather than mandatory in most jurisdictions.
Advocating for Functional Integration
Practitioners can advance functional assessment adoption by:
- Documenting functional outcomes in BNG reports as supplementary evidence
- Demonstrating value through case studies showing functional insights
- Engaging regulators in discussions about functional metric integration
- Contributing to guidance development for standardized functional protocols
For detailed information on current requirements, consult resources on what's included in BNG assessments and achieving 10% BNG targets.
Conclusion
Designing surveys for ecosystem functioning: moving beyond species lists to measure nutrient cycling and energy flow in 2026 represents a necessary evolution in ecological assessment methodology. While traditional taxonomic surveys provide valuable baseline information about biodiversity composition, functional measurements reveal whether ecosystems actually deliver the services that conservation efforts aim to protect.
The integration of nutrient cycling rates, energy flow quantification, decomposition assessment, and trophic dynamics monitoring creates comprehensive ecosystem evaluations that support more meaningful BNG validation and habitat creation success criteria. As technologies advance and methodologies standardize, functional assessment will transition from specialized research application to routine practice in ecological consulting.
Actionable Next Steps
For practitioners ready to incorporate functional measurements:
- Start simple: Add basic soil respiration and decomposition measurements to existing surveys
- Build capacity: Invest in training and equipment appropriate to project scale
- Establish baselines: Begin collecting functional data at reference sites
- Standardize methods: Adopt published protocols for comparability
- Document outcomes: Contribute to the evidence base demonstrating functional assessment value
- Engage stakeholders: Educate clients and regulators about functional metrics
For expert guidance on incorporating functional assessments into your biodiversity surveys and BNG compliance strategies, contact our team of specialized ecological consultants.
The future of biodiversity assessment lies not in counting species alone, but in measuring the ecological processes that sustain them—ensuring that conservation efforts deliver genuine, lasting ecosystem services for generations to come.
References
[1] Rings of Power: Specific biomolecular packages in aquatic nutrient cycling – https://we.copernicus.org/articles/26/27/2026/
[3] New Publication By Eisenhauer Et Al In Nature Reviews Biodiversity Soil Biodiversity Effects On Ecosystems – https://the-jena-experiment.de/index.php/2026/01/12/new-publication-by-eisenhauer-et-al-in-nature-reviews-biodiversity-soil-biodiversity-effects-on-ecosystems/
[4] Energy flux and ecosystem resilience – https://www3.nd.edu/~lemmon/courses/bios60581/lectures/lect2a/deangelis1980energy.pdf
[5] International Conference on Ecosystem Functioning and Nutrient Cycling – https://academicworldresearch.org/conference/3410956
[6] ICRS 2026 Sessions And Themes – https://www.icrs2026.nz/sessions-and-themes
