
The global biodiversity crisis has reached a critical inflection point. For the first time in modern conservation history, Scenario Modeling to Bend Biodiversity Loss Curves: Tools for 2026 Ecology Surveyors represents not just theoretical exercises, but practical pathways toward reversing decades of ecological decline. As ecology surveyors navigate increasingly complex regulatory landscapes in 2026, the ability to model, predict, and verify biodiversity recovery scenarios has transformed from academic curiosity to professional necessity. 🌍
Recent meta-analysis of 138 modeled global scenarios reveals a sobering truth: despite growing momentum, few scenarios successfully demonstrate the "bending of the curve" needed to meet Global Biodiversity Framework commitments [2]. Yet breakthrough developments in 2026—particularly the release of sophisticated analytical tools and standardized assessment protocols—now equip ecology surveyors with unprecedented capabilities to quantify, model, and achieve measurable biodiversity recovery.
Key Takeaways
- New software tools released in 2026 enable comprehensive quantification of ecosystem stability across eleven established indicators, translating theoretical concepts into practical surveyor applications [1]
- Three distinct scenario classifications guide biodiversity planning: reduce-loss (slowing decline), net-zero-loss (maintaining baselines), and bending-the-curve (reversing declines) [2]
- Standardization of biodiversity indicators remains critically urgent, with 42 different metrics creating comparability challenges across studies [2]
- Data variability significantly affects the probability of detecting successful curve-bending, requiring case-by-case threshold setting rather than universal benchmarks [3]
- Practical surveyor tools including GLOBIO models, Species Area Relationships, and the new "estar" R package provide actionable frameworks for biodiversity impact assessments
Understanding Biodiversity Loss Curves and Recovery Scenarios
What Does "Bending the Curve" Actually Mean?
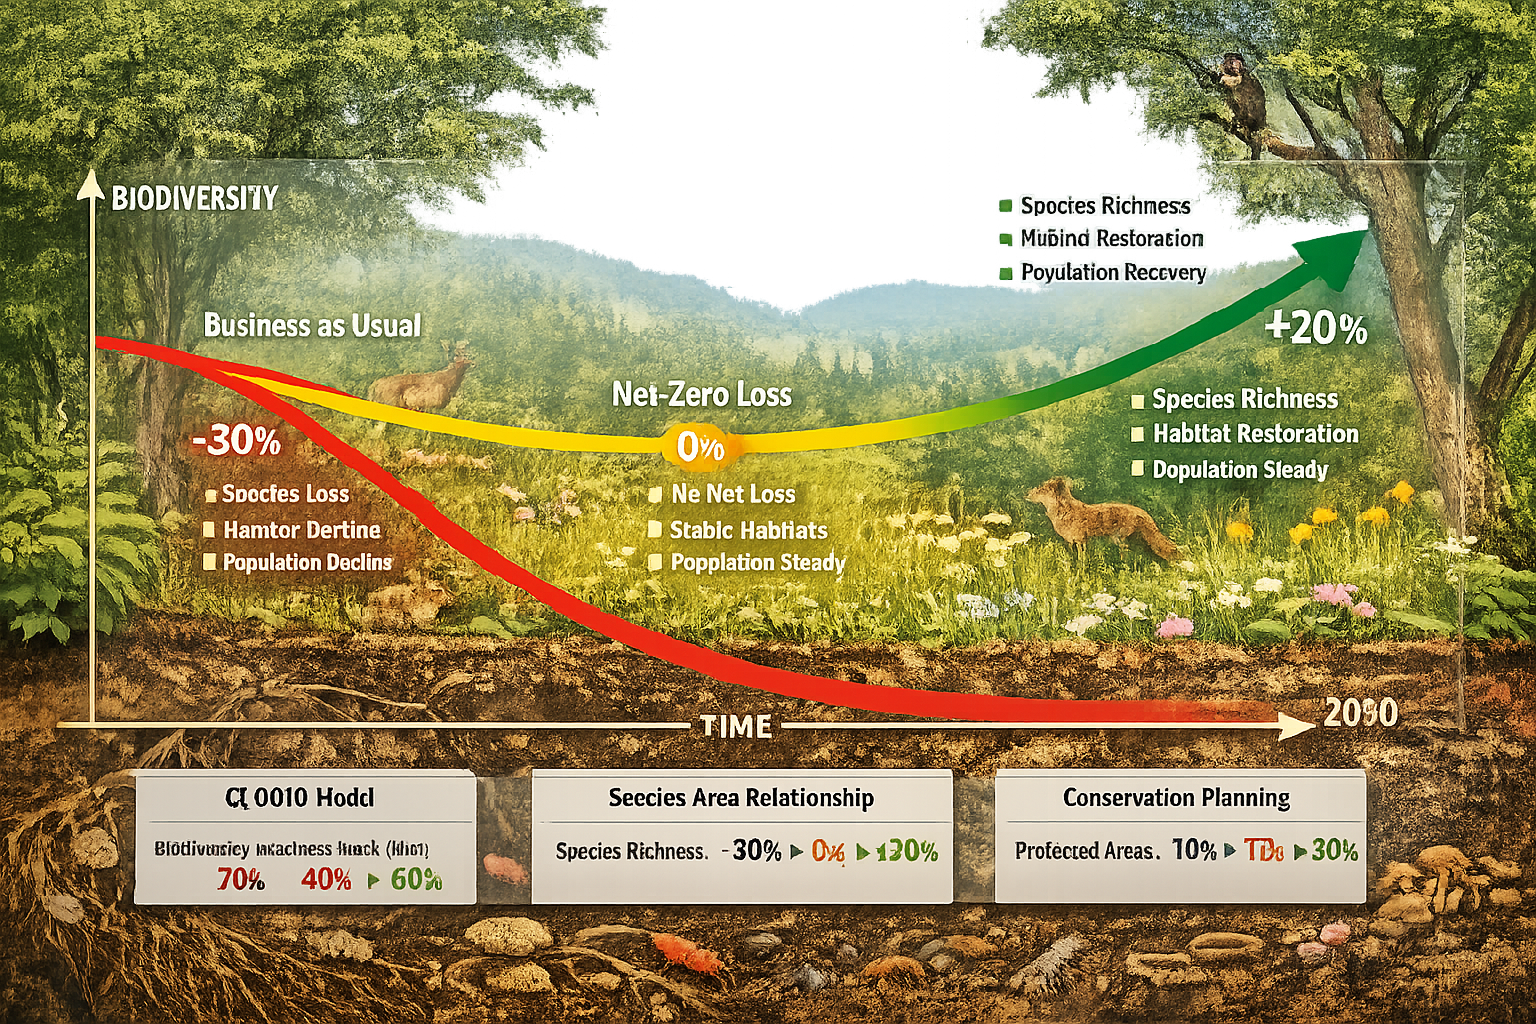
The phrase "bending the curve" describes a fundamental shift in biodiversity trajectories—moving from continuous decline to measurable recovery. Research frameworks now classify policy scenarios into three distinct categories [2]:
- Reduce-Loss Scenarios: Interventions that slow biodiversity loss rates but don't halt decline
- Net-Zero-Loss Scenarios: Strategies maintaining current baseline biodiversity levels
- Bending-the-Curve Scenarios: Ambitious policies that reverse declines and restore biodiversity
For ecology surveyors working on Biodiversity Net Gain (BNG) projects, understanding these distinctions proves essential. A development project claiming to "bend the curve" must demonstrate actual biodiversity increases above baseline conditions—not merely slower rates of habitat degradation.
The Current State of Global Scenarios
Meta-analysis of biodiversity modeling literature reveals significant gaps in our collective ability to project recovery pathways. Across 57 peer-reviewed papers examining global scenarios, researchers identified 42 different biodiversity indicators (BDIs), creating substantial comparability challenges [2]. This fragmentation makes it difficult for surveyors to benchmark their local assessments against global trends or verify whether interventions truly bend loss curves.
The most frequently utilized modeling approaches include:
| Model Type | Usage Frequency | Primary Application |
|---|---|---|
| GLOBIO | 12 papers | Global biodiversity impact assessment |
| Species Area Relationship | 8 papers | Habitat loss projections |
| Systematic Conservation Planning | 6 papers | Protected area optimization |
| Species Distribution Models | 4 papers | Climate change impact assessment |
Critical limitation: Most biodiversity models may overestimate climate change impacts because projections rely on statistical correlations between climate and coarse species distributions while overlooking species-specific local adaptations [2]. This creates uncertainty for surveyors attempting to model long-term habitat recovery under changing climate conditions.
Essential Tools for 2026 Ecology Surveyors Conducting Scenario Modeling
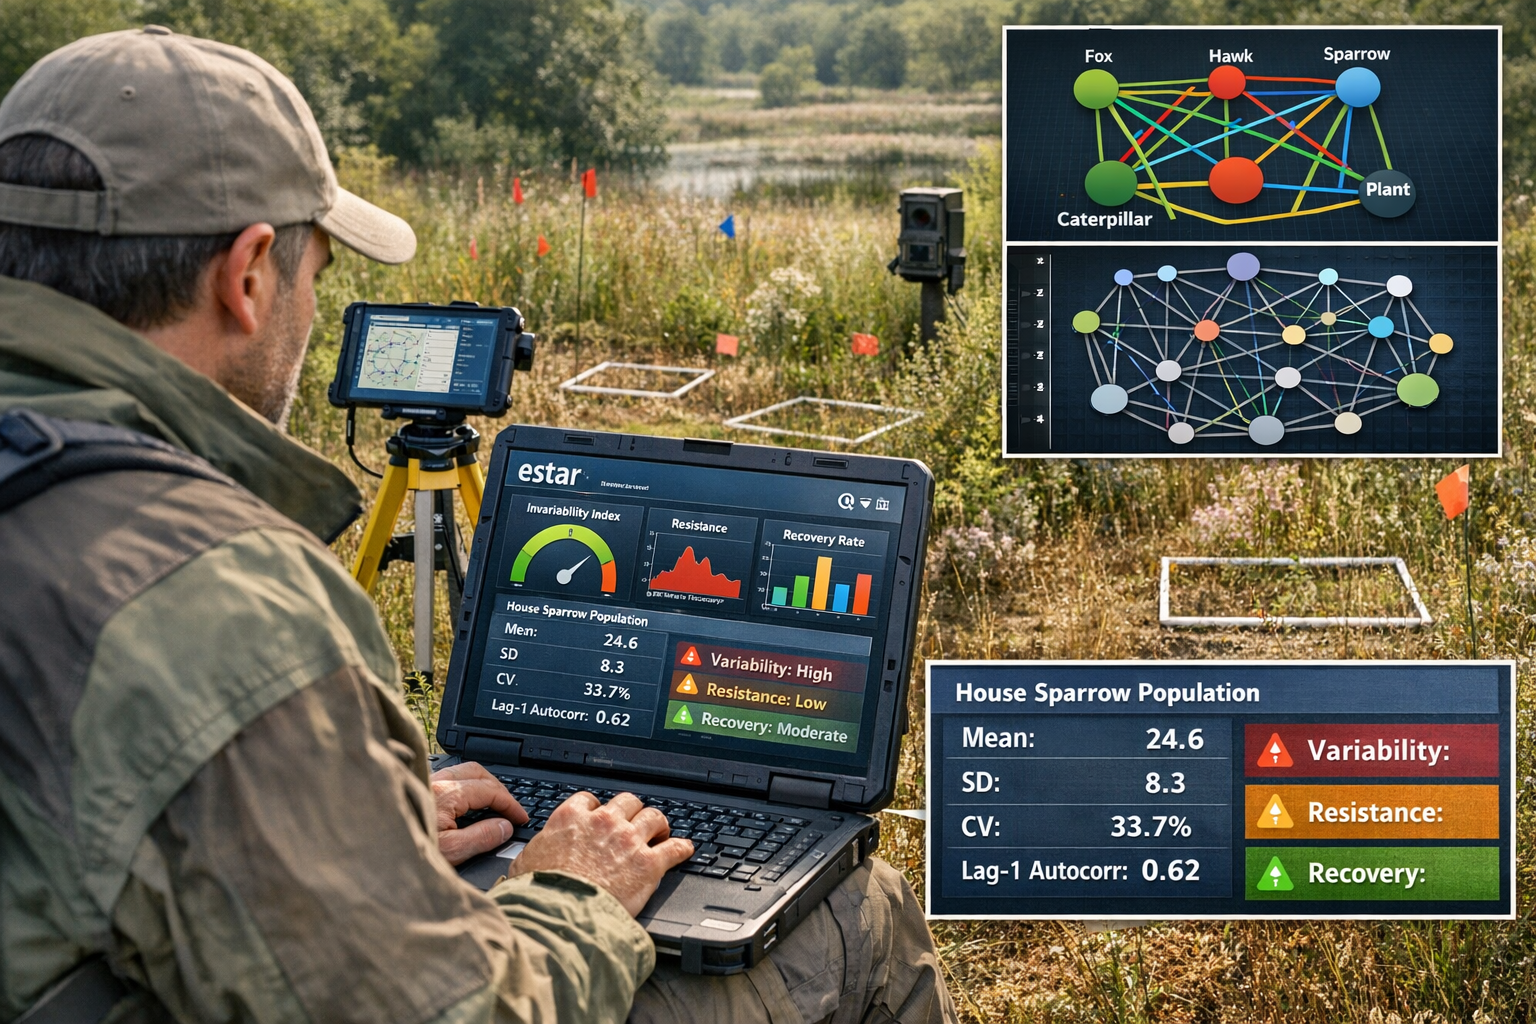
The "estar" R Package: A Breakthrough for Stability Quantification
Released in March 2026, the "estar" R package represents a transformative development for ecology surveyors conducting scenario modeling [1]. This software tool addresses a previously unmet methodological gap by quantifying ecological stability across eleven established ecosystem stability indicators.
Key capabilities of the estar package include:
- ✅ Multi-level stability metrics: Quantification at individual, population, and community organizational levels
- ✅ Comprehensive indicators: Invariability, resistance, recovery extent, recovery rate, persistence, and ecological vulnerability
- ✅ Jacobian matrix operationalization: Practical application of previously theoretical mathematical frameworks for mapping multidimensional species interactions
- ✅ Population variability assessment: Tools to identify species susceptible to local extinction under unfavorable conditions
Practical application example: Researchers demonstrated the tool's capability by analyzing house sparrow (Passer domesticus) populations across European cities [1]. Despite being widespread, house sparrows show high variability in population numbers. The software's invariability metric revealed that species with highly variable populations face greater susceptibility to local extinction—critical information for surveyors assessing biodiversity baseline conditions.
Integrated Pressure Models for Environmental Impact Assessment
Understanding environmental pressures on biodiversity requires sophisticated modeling frameworks. The Integrated Model to Assess the Global Environment (IMAGE) dominates current research, appearing in 18 papers analyzing biodiversity scenarios [2]. For surveyors, these models provide essential context for understanding how development pressures interact with conservation interventions.
Other widely-used pressure models include:
- Asia-Pacific Integrated Model (AIM): 3 papers, regional focus
- CLUMondo: 3 papers, land use change specialization
These tools help surveyors contextualize site-specific assessments within broader landscape-scale pressures, enabling more accurate predictions of whether proposed interventions will genuinely bend biodiversity loss curves or merely offset inevitable declines.
Standardized Biodiversity Indicators for Surveyors
The proliferation of 42 different biodiversity indicators creates substantial challenges for practitioners [2]. However, certain metrics have emerged as particularly valuable for surveyor applications:
Priority indicators for 2026 surveying practice:
- Species Richness: Total number of species in defined area
- Habitat Extent: Total area of qualifying habitat types
- Population Stability: Variability metrics quantified through estar package
- Functional Diversity: Representation of ecological roles and traits
- Connectivity Indices: Habitat network integrity measures
Standardization of these indicators enables meaningful comparison across projects and verification of whether interventions achieve net-zero or curve-bending outcomes. When conducting biodiversity plans for development projects, surveyors should prioritize indicators that align with emerging international standards.
Implementing Scenario Modeling in Biodiversity Net Gain Projects
Baseline vs. Bending-Curve Outcomes: A Practical Framework
For ecology surveyors working within the UK's Biodiversity Net Gain framework, scenario modeling provides essential tools for demonstrating compliance with 10% net gain requirements. However, achieving true curve-bending outcomes requires moving beyond minimum compliance toward ambitious restoration targets.
Baseline scenario characteristics:
- Maintains existing biodiversity levels
- Prevents further habitat degradation
- Meets minimum regulatory thresholds
- Focuses primarily on loss mitigation
Bending-curve scenario characteristics:
- Demonstrates measurable biodiversity increases
- Creates new habitat beyond replacement ratios
- Establishes long-term recovery trajectories
- Integrates landscape-scale connectivity
Data Variability and Target Verification Challenges
Recent research reveals a critical challenge for surveyors: the probability of successfully detecting a "bend in the curve" depends heavily on species variability and dataset size [3]. This means universal benchmarks for target acceptance prove inadequate—each project requires case-by-case threshold setting based on local ecological conditions.
Key implications for surveying practice:
⚠️ Retrospective reassessment necessary: Adding subsequent years of monitoring data can retrospectively change whether a biodiversity target was successfully met in a previous year [3]. Surveyors must regard target assessments as interim until multiple years of post-implementation data accumulation allows final evaluation.
💡 Statistical power considerations: Projects with high natural variability require larger sample sizes and longer monitoring periods to confidently detect curve-bending trends. This affects both surveying protocols and biodiversity unit calculations.
Integrating Scenario Modeling with BNG Planning
Effective scenario modeling for BNG projects requires integration across multiple planning stages:
1. Pre-Development Assessment Phase
- Establish baseline biodiversity metrics using standardized indicators
- Model business-as-usual decline scenarios without intervention
- Quantify existing habitat stability using estar package tools
- Identify species with high population variability requiring special consideration
2. Intervention Design Phase
- Model multiple intervention scenarios (reduce-loss, net-zero, bending-curve)
- Compare projected outcomes across different habitat creation strategies
- Assess on-site versus off-site delivery options
- Optimize intervention design for maximum curve-bending potential
3. Implementation and Monitoring Phase
- Establish monitoring protocols aligned with modeled indicators
- Set interim targets recognizing data variability challenges
- Collect sufficient data to enable retrospective reassessment
- Adjust management interventions based on observed trajectories
4. Verification and Reporting Phase
- Compare actual outcomes against modeled scenarios
- Demonstrate curve-bending achievement (or identify shortfalls)
- Document lessons learned for future projects
- Contribute to standardized indicator databases
Practical Tools and Software Recommendations for 2026
Ecology surveyors conducting scenario modeling should build proficiency with these essential tools:
Statistical and Modeling Software:
- R programming environment: Essential for estar package and custom analyses
- QGIS/ArcGIS: Spatial modeling and habitat connectivity assessment
- Biodiversity Metric Calculator: UK-specific BNG quantification
- GLOBIO modeling framework: Global context for local assessments
Data Management and Reporting:
- Standardized field data collection apps: Ensure compatibility with modeling tools
- Long-term monitoring databases: Enable retrospective reassessment
- Visualization platforms: Communicate complex scenarios to stakeholders
Collaboration and Knowledge Sharing:
- International biodiversity forums: Access emerging methodologies and case studies [4]
- Professional networks: Share lessons learned from curve-bending attempts
- Academic partnerships: Contribute field data to validation studies
Overcoming Common Challenges in Biodiversity Scenario Modeling
Challenge 1: Climate Change Uncertainty
Most biodiversity models potentially overestimate climate impacts by overlooking local adaptations [2]. Surveyors can address this through:
- Incorporating species-specific adaptation potential into projections
- Using conservative climate scenarios for long-term predictions
- Building adaptive management flexibility into intervention designs
- Monitoring actual climate responses rather than relying solely on statistical correlations
Challenge 2: Indicator Standardization
With 42 different biodiversity indicators in use [2], ensuring comparability across projects requires deliberate standardization efforts. Surveyors should:
- Prioritize indicators aligned with emerging international standards
- Report multiple complementary metrics rather than single measures
- Contribute data to standardization initiatives
- Document methodology thoroughly to enable future comparisons
Challenge 3: Demonstrating Causality
Proving that interventions—rather than external factors—caused observed biodiversity changes requires robust study design. Effective approaches include:
- Establishing control sites for comparison
- Using before-after-control-impact (BACI) study designs
- Modeling counterfactual scenarios (what would have happened without intervention)
- Collecting sufficient temporal data to distinguish trends from natural variability
Challenge 4: Long-Term Commitment Requirements
Bending biodiversity loss curves requires decades of sustained effort. Surveyors must address this through:
- Securing long-term funding mechanisms for monitoring and management
- Establishing institutional arrangements that outlast individual projects
- Building redundancy into intervention designs to buffer against management gaps
- Creating stakeholder coalitions committed to multi-decadal outcomes
Case Studies: Successful Curve-Bending in Practice
Urban Biodiversity Recovery: The House Sparrow Example
The estar package's analysis of house sparrow populations demonstrates practical scenario modeling applications [1]. By quantifying population invariability across European cities, researchers identified:
- High-risk populations: Cities with extreme variability requiring intensive intervention
- Stable populations: Areas where modest habitat improvements could maintain trends
- Recovery potential: Locations where targeted interventions could reverse declines
This approach translates directly to surveyor practice when assessing urban development projects. By quantifying population stability metrics for key indicator species, surveyors can predict which interventions will genuinely bend curves versus those offering only marginal improvements.
Agricultural Landscape Restoration
Scenario modeling proves particularly valuable in agricultural contexts where biodiversity banking opportunities intersect with farming operations. Successful approaches include:
- Modeling habitat connectivity improvements across farm networks
- Quantifying pollinator population recovery under different management scenarios
- Projecting long-term biodiversity trajectories under various agricultural subsidy schemes
- Demonstrating curve-bending potential to justify biodiversity credit investments
Development-Driven Conservation
Forward-thinking developers increasingly recognize that ambitious biodiversity outcomes provide competitive advantages. Scenario modeling enables:
- Differentiation between minimum compliance and market-leading outcomes
- Quantification of ecosystem service benefits from curve-bending interventions
- Risk assessment for long-term biodiversity commitments
- Demonstration of genuine environmental leadership beyond greenwashing
Future Directions: What's Next for Biodiversity Scenario Modeling?
Emerging Technologies and Methodologies
The rapid evolution of analytical tools suggests several promising developments for ecology surveyors:
Artificial Intelligence and Machine Learning:
- Automated species identification from environmental DNA
- Pattern recognition in long-term monitoring datasets
- Predictive modeling of intervention outcomes
- Real-time adaptive management recommendations
Remote Sensing Advancements:
- High-resolution habitat mapping from satellite and drone imagery
- Vegetation health monitoring through multispectral analysis
- Automated change detection for intervention verification
- Landscape-scale connectivity assessment
Genetic and Molecular Tools:
- Population viability assessment through genetic diversity metrics
- Ecosystem function quantification via microbial community analysis
- Early warning indicators of population decline
- Verification of species-specific local adaptations
Policy and Regulatory Evolution
As scenario modeling capabilities advance, regulatory frameworks will likely evolve to incorporate more sophisticated requirements:
- Mandatory curve-bending targets for major developments
- Standardized indicator reporting across all BNG projects
- Long-term monitoring requirements enabling retrospective reassessment
- Landscape-scale planning replacing site-by-site approaches
Ecology surveyors who build proficiency with advanced scenario modeling tools now will be well-positioned to lead this regulatory evolution.
Conclusion
Scenario Modeling to Bend Biodiversity Loss Curves: Tools for 2026 Ecology Surveyors represents far more than academic exercise—it provides the practical foundation for genuine ecological recovery in an era of accelerating biodiversity loss. The release of sophisticated analytical tools like the estar R package [1], combined with growing understanding of scenario classification frameworks [2] and data variability challenges [3], equips surveyors with unprecedented capabilities to model, implement, and verify curve-bending interventions.
Yet tools alone prove insufficient. Success requires commitment to standardized indicators, long-term monitoring, rigorous study design, and honest assessment of whether interventions achieve reduce-loss, net-zero, or genuine curve-bending outcomes. As the UK's Biodiversity Net Gain framework matures and global biodiversity commitments intensify, ecology surveyors occupy a critical position—translating ambitious policy goals into measurable on-ground recovery.
Actionable Next Steps for Ecology Surveyors
- Build technical proficiency with the estar R package and other scenario modeling tools
- Adopt standardized biodiversity indicators in all assessment work to enable meaningful comparisons
- Design monitoring protocols that account for data variability and enable retrospective reassessment
- Engage with emerging research through international forums and academic partnerships [4]
- Differentiate between scenario types when communicating project outcomes to clients and regulators
- Contribute to knowledge sharing by documenting lessons learned from curve-bending attempts
- Advocate for long-term commitments that match the temporal scales required for genuine biodiversity recovery
The biodiversity crisis demands nothing less than transformative change. Armed with sophisticated modeling tools and rigorous analytical frameworks, ecology surveyors in 2026 possess the capabilities to guide that transformation—bending loss curves toward recovery and demonstrating that ambitious conservation goals remain achievable when supported by sound science and sustained commitment. 🌱
For surveyors ready to implement these approaches, resources including comprehensive BNG guidance and expert consultation services provide essential support for translating scenario modeling theory into successful on-ground outcomes.
References
[1] 2026 03 Software Biodiversity Enables Comprehensive Quantification – https://phys.org/news/2026-03-software-biodiversity-enables-comprehensive-quantification.html
[2] Sciadv – https://www.science.org/doi/10.1126/sciadv.aeb2277
[3] pubmed.ncbi.nlm.nih.gov – https://pubmed.ncbi.nlm.nih.gov/41756260/
[4] Oral And Poster Sessions Wbf2026 – https://worldbiodiversityforum.org/oral-and-poster-sessions-wbf2026/
