
Field surveys at the Knepp Estate revealed a startling truth: rewilded land contains approximately twice the biodiversity richness of conventional arable farmland, with 33% more pollinator species and 25% more beneficial fungus species. As the UK's mandatory 10% Biodiversity Net Gain (BNG) requirement enters its third year of enforcement in 2026, field surveyors face unprecedented demand for standardized protocols to measure and verify ecosystem recovery in rewilding projects.
Rewilding Project Evaluations for Biodiversity Net Gain: Field Surveyor Metrics for Ecosystem Recovery in 2026 has become essential as developers, landowners, and conservation organizations seek credible evidence that their restoration efforts deliver measurable biodiversity improvements. The challenge extends beyond simple species counts—ecologists must now quantify habitat connectivity, track recolonization rates, and demonstrate sustained ecosystem functioning using cutting-edge tools like drone mapping and camera traps.
Key Takeaways
- 🌱 Standardized measurement frameworks enable field surveyors to quantify biodiversity gains consistently, with one credit representing a 1% improvement per hectare
- 📊 Species recolonization tracking through camera traps and systematic surveys provides verifiable evidence of ecosystem recovery over time
- 🚁 Drone mapping technology revolutionizes habitat connectivity assessments, revealing wildlife corridors and patch dynamics across rewilding sites
- 💰 Biodiversity credit valuations demonstrate that 30-year rewilding projects can generate £1.5 million in measurable ecosystem value
- 📈 Combined monitoring approaches using digital tools and field observations deliver the robust data needed for BNG compliance and verification
Understanding Rewilding Project Evaluations for Biodiversity Net Gain in 2026
The landscape of biodiversity assessment has transformed dramatically since the Environment Act 2021 introduced mandatory BNG requirements. Field surveyors now operate within a sophisticated regulatory framework that demands quantifiable evidence of ecosystem improvements.
The Regulatory Context Driving Field Surveyor Metrics
The 10% mandatory Biodiversity Net Gain requirement formally implemented in early 2024 has fundamentally changed how rewilding projects are evaluated [2]. This regulatory shift means every development project must demonstrate measurable biodiversity improvements, creating unprecedented demand for professional field survey capabilities.
Recent guidance published in January 2026 by the Investment Property Forum highlights the operational challenges facing institutional investors and developers as they navigate BNG compliance [2]. Field surveyors have become critical intermediaries, translating complex ecological data into standardized metrics that satisfy both regulatory requirements and conservation objectives.
What Makes Rewilding Projects Unique for BNG Assessments
Rewilding projects differ substantially from conventional habitat creation schemes. Rather than establishing predetermined habitat types, rewilding allows natural processes to guide ecosystem development. This approach creates unique evaluation challenges:
- Dynamic habitat mosaics that change composition over time
- Unpredictable species assemblages driven by natural colonization
- Long-term recovery trajectories requiring multi-decade monitoring commitments
- Complex ecological interactions between trophic levels and functional groups
Field surveyors must adapt their methodologies to capture this ecological complexity while maintaining the standardization required for biodiversity net gain assessments.
The Wallacea Trust Framework for Standardized Measurement
The Wallacea Trust framework has emerged as a leading standardized approach for biodiversity measurement in 2026 [1]. This system defines one biodiversity credit as representing a 1% improvement in biodiversity per hectare of land, creating a common currency for comparing ecosystem recovery across diverse project types.
This standardization enables:
✅ Comparable assessments between rewilding sites and conventional habitats
✅ Transparent valuation of biodiversity improvements for credit markets
✅ Consistent monitoring protocols across different surveyor teams
✅ Verifiable evidence for regulatory compliance and investor reporting
Cambridge University research demonstrates the practical application of this framework, calculating that conventional arable farmland at Boothby, Lincolnshire, could achieve 69-92% biodiversity increase over 30 years through rewilding interventions [1].
Standardized Protocols for Measuring Ecosystem Recovery
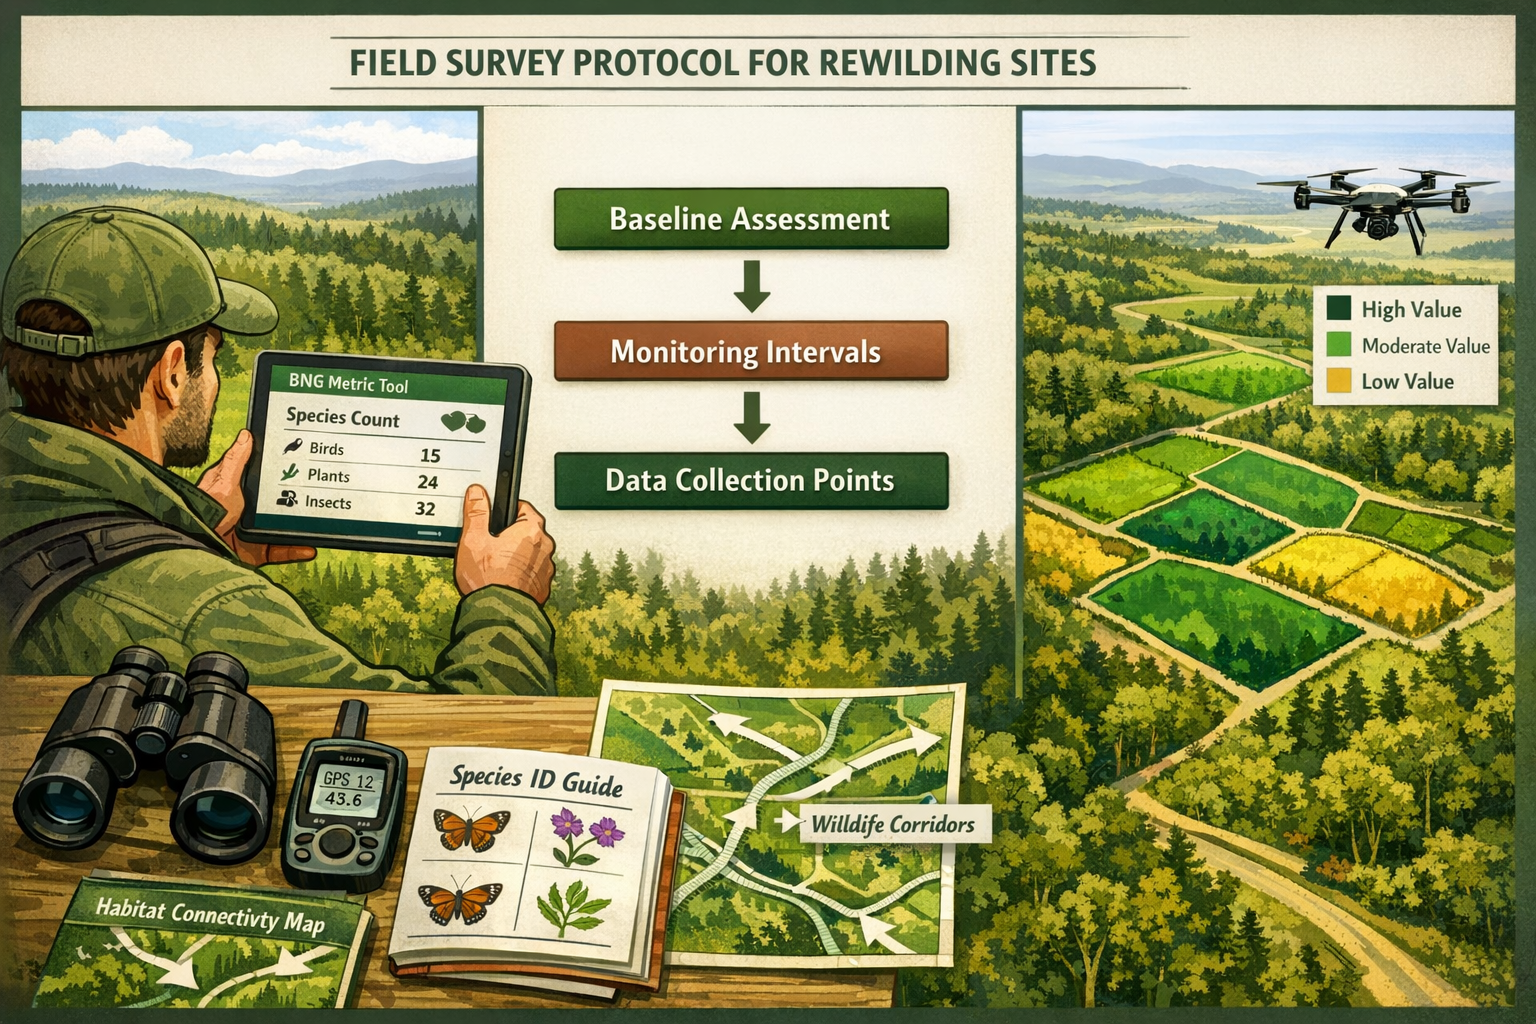
Field surveyors in 2026 employ sophisticated protocols that combine traditional ecological survey techniques with advanced technology. These standardized approaches ensure consistency, repeatability, and regulatory compliance across rewilding projects.
Baseline Assessment and Habitat Condition Scoring
Every rewilding evaluation begins with comprehensive baseline assessment. Field surveyors document:
Habitat Type Classification
- Dominant vegetation communities using UK Habitat Classification system
- Structural diversity including canopy layers, ground cover, and deadwood
- Soil conditions and hydrological characteristics
- Historical land use patterns and degradation indicators
Species Inventory Protocols
- Systematic transect surveys for vascular plants
- Point count surveys for breeding birds
- Timed searches for mammals, reptiles, and amphibians
- Targeted surveys for indicator species groups (pollinators, soil invertebrates)
The biodiversity impact assessment process establishes baseline metrics against which future recovery is measured, typically using the Defra Biodiversity Metric 4.0 or subsequent versions.
Monitoring Intervals and Survey Timing
Rewilding project evaluations require carefully planned monitoring schedules that capture seasonal variation and long-term trends:
| Survey Phase | Timing | Primary Metrics | Technology Used |
|---|---|---|---|
| Pre-intervention baseline | Year 0 | Habitat condition, species richness | Traditional field surveys, GPS mapping |
| Early establishment | Years 1-3 | Colonization rates, vegetation succession | Camera traps, quarterly surveys |
| Mid-term recovery | Years 5, 10, 15 | Community composition, connectivity | Drone mapping, annual surveys |
| Long-term maturity | Years 20, 25, 30 | Ecosystem functioning, trophic complexity | Integrated monitoring, eDNA sampling |
This temporal framework aligns with the 30-year monitoring commitments typical for biodiversity net gain delivery, ensuring surveyors capture both rapid colonization events and gradual ecosystem maturation.
Data Collection Standards and Quality Assurance
Professional field surveyors in 2026 adhere to rigorous data quality protocols:
🔍 Surveyor Competency Requirements
- Recognized ecological qualifications (BSc minimum, MSc preferred)
- Species identification proficiency validated through testing
- Survey license holders for protected species work
- Continuing professional development in emerging methodologies
📱 Digital Data Capture Systems
- Mobile applications with built-in validation rules
- GPS-tagged observation records with photographic evidence
- Real-time data synchronization to central databases
- Automated quality checks flagging anomalous entries
These standards ensure the data feeding into biodiversity net gain reports meets the evidential requirements for regulatory approval and credit verification.
Species Recolonization Rates: Tracking Wildlife Return
One of the most compelling indicators of rewilding success is the rate at which species recolonize restored habitats. Field surveyors in 2026 employ sophisticated techniques to document and quantify this ecological recovery.
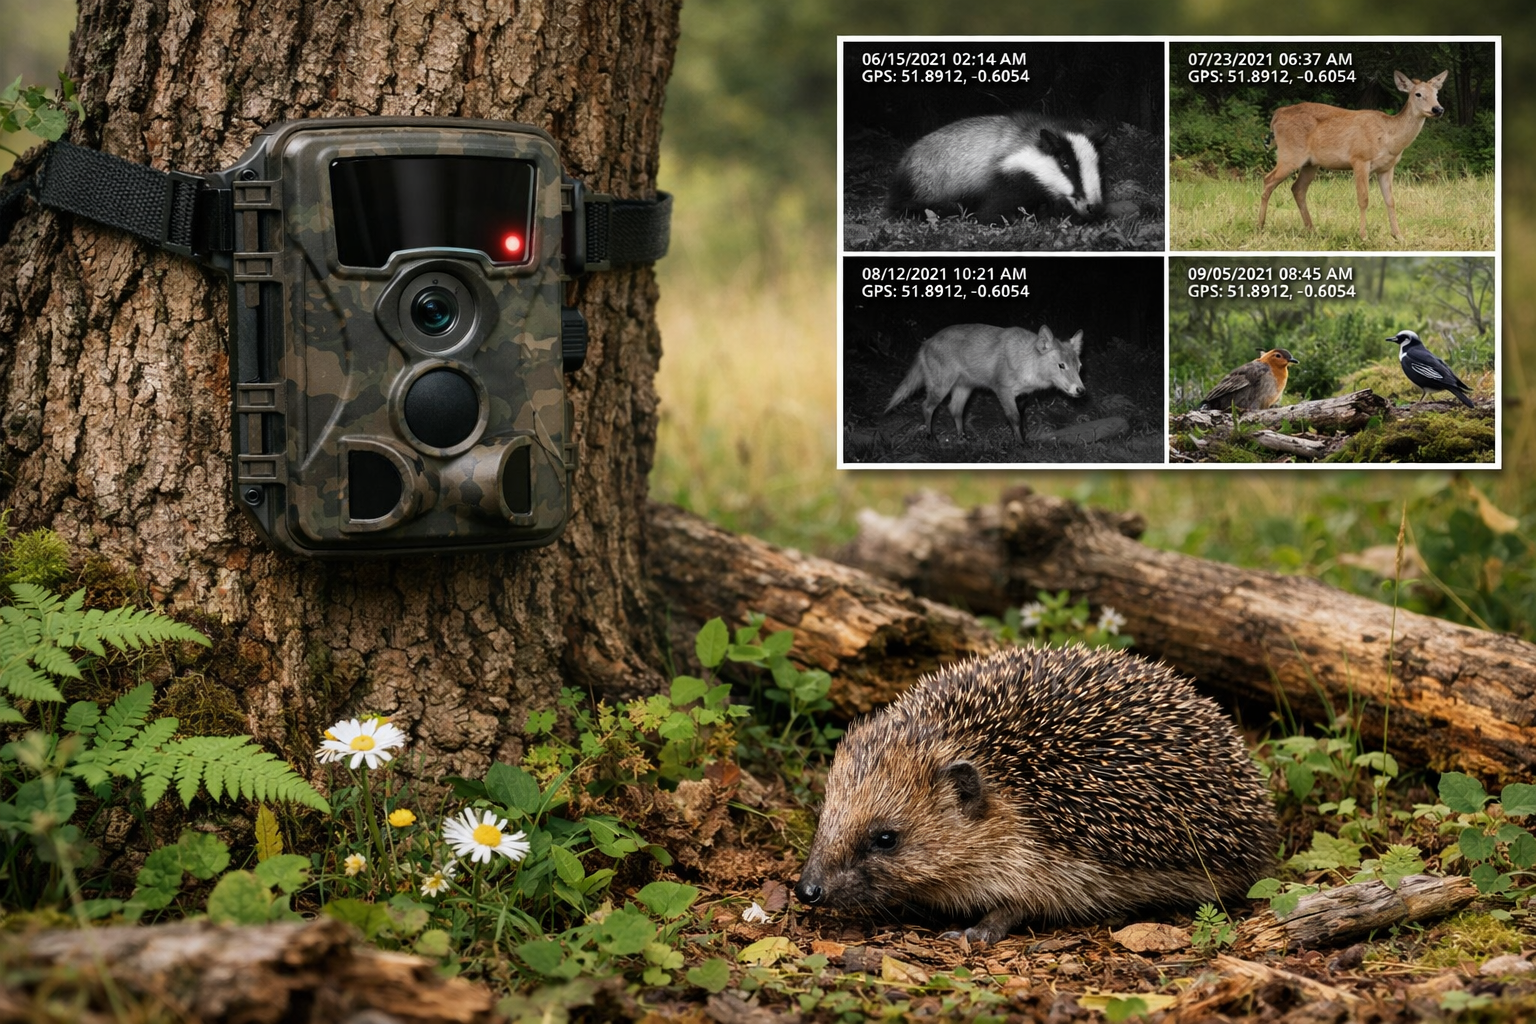
Camera Trap Networks for Mammal and Bird Monitoring
Motion-activated camera traps have revolutionized wildlife monitoring in rewilding projects. These devices provide continuous, non-invasive surveillance that captures species presence, behavior, and population dynamics.
Strategic Camera Placement Protocols
- Grid-based deployment at 250-500m intervals across site
- Targeted placement along habitat boundaries and corridors
- Height adjustment for different target species groups
- Orientation to minimize false triggers from vegetation movement
Research at successfully rewilded sites demonstrates the power of this approach. The Knepp Estate case study shows how systematic camera trap surveys revealed 33% more pollinator species compared to conventional farmland [1], providing quantifiable evidence of ecosystem recovery.
Data Analysis Frameworks
- Species identification using AI-assisted image recognition software
- Activity pattern analysis revealing temporal niche partitioning
- Population estimation through capture-recapture modeling
- Behavioral observations indicating breeding activity and territory establishment
Pollinator and Invertebrate Survey Methodologies
Invertebrates serve as sensitive indicators of ecosystem health and functional recovery. Field surveyors employ multiple complementary techniques:
Transect-Based Pollinator Surveys
- Standardized 100m transects walked at consistent speeds
- Timed observation periods during peak activity (10am-4pm, warm conditions)
- Species-level identification or morphospecies grouping
- Flower resource availability documentation
Field data from Knepp Estate revealed 25% more beneficial fungus species in rewilded areas [1], demonstrating how comprehensive invertebrate surveys capture below-ground as well as above-ground biodiversity recovery.
Supplementary Invertebrate Sampling
- Pitfall traps for ground-dwelling beetles and spiders
- Sweep netting for grassland invertebrates
- Malaise traps for flying insects
- Soil core sampling for decomposer communities
Avian Community Composition and Breeding Success
Bird communities provide excellent indicators of habitat structural complexity and food web recovery. Standardized survey protocols include:
🐦 Breeding Bird Surveys
- Territory mapping using multiple visits during breeding season
- Dawn chorus point counts at fixed locations
- Nest monitoring for productivity assessment
- Juvenile observation confirming successful reproduction
🦉 Specialist Species Monitoring
- Nocturnal surveys for owls and nightjars
- Raptor territory surveys and breeding attempt documentation
- Wetland bird counts for aquatic habitat recovery
- Winter bird assemblage surveys for year-round habitat value
The recolonization of specialist species—particularly those requiring specific habitat structures or prey availability—provides powerful evidence of ecosystem recovery trajectory. Field surveyors document these colonization events as key milestones in achieving biodiversity net gain targets.
Habitat Connectivity Assessment Using Advanced Technology
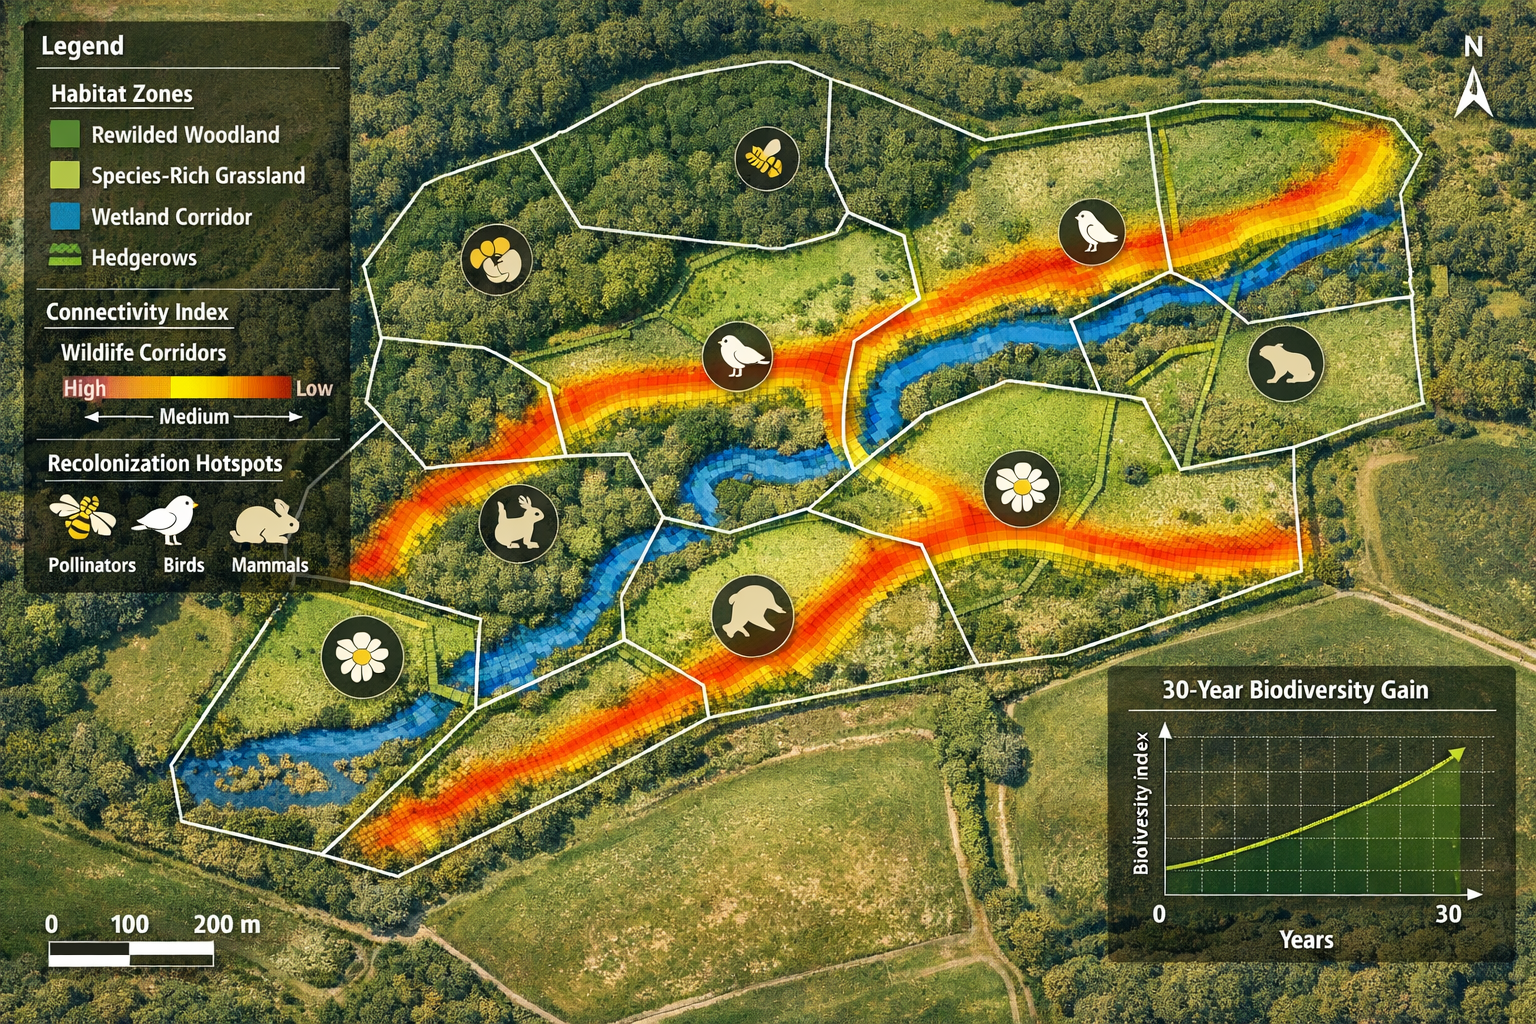
Habitat connectivity has emerged as a critical metric in rewilding project evaluations for Biodiversity Net Gain. Isolated habitat patches, regardless of quality, cannot support viable populations or facilitate species movement across landscapes. Field surveyors in 2026 leverage cutting-edge technology to quantify connectivity and identify critical corridors.
Drone Mapping for Landscape-Scale Habitat Analysis
Unmanned aerial vehicles (UAVs) have transformed how field surveyors assess habitat structure and connectivity. Modern drone platforms equipped with multispectral sensors provide unprecedented spatial resolution and temporal flexibility.
Drone Survey Specifications for BNG Projects
- High-resolution RGB cameras (20+ megapixels) for detailed habitat mapping
- Multispectral sensors capturing near-infrared bands for vegetation health
- LiDAR systems measuring canopy structure and terrain complexity
- Automated flight planning ensuring consistent coverage and overlap
A recent case study at Nattergal's rewilding project demonstrates how digital solutions streamline BNG assessments [5]. Drone-derived habitat maps enable surveyors to:
✈️ Quantify habitat patch characteristics including size, shape, and edge-to-interior ratios
✈️ Track vegetation succession through repeat surveys at 6-12 month intervals
✈️ Identify natural colonization patterns showing woodland expansion or grassland development
✈️ Document structural heterogeneity critical for diverse species assemblages
GIS Analysis of Wildlife Corridors and Movement Patterns
Geographic Information Systems (GIS) integrate drone imagery, camera trap data, and field observations to model connectivity across rewilding sites. Field surveyors collaborate with GIS specialists to generate:
Connectivity Index Mapping
- Least-cost path analysis identifying optimal movement routes between habitat patches
- Resistance surface modeling based on land cover and barrier features
- Corridor width calculations ensuring functional connectivity for target species
- Pinch point identification revealing critical bottlenecks requiring management
Research indicates that rewilded sites achieving 69-92% biodiversity increase over 30 years [1] typically demonstrate strong landscape connectivity, allowing species to recolonize from source populations and maintain genetic diversity.
Edge Effects and Buffer Zone Evaluation
The interface between rewilded areas and surrounding land uses significantly influences biodiversity outcomes. Field surveyors assess:
🌳 Edge Habitat Characteristics
- Vegetation density and structure at boundaries
- Microclimate gradients (temperature, humidity, light penetration)
- Predator access and disturbance levels
- Invasive species ingress points
📏 Buffer Zone Effectiveness
- Width of transitional habitat between core rewilding area and intensive land uses
- Vegetation screening reducing edge effects
- Connectivity to adjacent semi-natural habitats
- Management interventions maintaining buffer function
Effective connectivity assessment informs on-site versus off-site BNG delivery decisions, helping developers and landowners optimize biodiversity outcomes within landscape constraints.
Integration of Connectivity Metrics into BNG Calculations
The Biodiversity Metric 4.0 and subsequent versions incorporate connectivity considerations through:
- Strategic significance multipliers for habitats within identified wildlife corridors
- Spatial risk factors penalizing isolated habitat creation
- Connectivity scores rewarding projects that enhance landscape permeability
- Cumulative impact assessments considering project contribution to regional ecological networks
Field surveyors must document connectivity features comprehensively to ensure biodiversity net gain assessments accurately reflect the landscape-scale value of rewilding projects.
Financial Valuation and Biodiversity Credit Markets in 2026
The economic dimensions of rewilding project evaluations have gained prominence as biodiversity credit markets mature. Field surveyors provide the empirical foundation for credit valuation, linking measurable ecosystem recovery to financial instruments.
Calculating Biodiversity Credit Generation
Cambridge University research calculated that the Boothby farm rewilding project could generate £1.5 million in voluntary biodiversity credits following 30 years of ecosystem recovery [1]. This valuation derives from:
Credit Calculation Methodology
- Baseline biodiversity value established through comprehensive field surveys
- Projected biodiversity gain modeled using reference site data and ecological succession theory
- Credit quantity determined by percentage improvement × hectare area × time period
- Credit quality adjusted for additionality, permanence, and verification confidence
Field surveyors play a crucial role in steps 1 and 2, providing the empirical data that underpins credit calculations. The Wallacea Trust framework's definition—one credit equals 1% biodiversity improvement per hectare [1]—creates a standardized basis for these valuations.
The Funding Gap Challenge
Despite promising credit valuations, significant financial barriers constrain rewilding project implementation. Research reveals that investors are willing to pay approximately 15 times less than the actual costs required to fund comprehensive land restoration in England [1].
This funding gap creates several implications for field surveyors:
💷 Cost-Effective Monitoring Strategies
- Optimizing survey effort to balance data quality with budget constraints
- Leveraging volunteer citizen science for supplementary data collection
- Prioritizing indicator species and functional groups over comprehensive inventories
- Utilizing remote sensing to reduce field visit frequency
🤝 Combined Funding Models
- Integrating biodiversity credits with carbon credit revenue streams
- Aligning rewilding projects with agricultural subsidy schemes
- Securing philanthropic funding for monitoring and verification
- Exploring corporate biodiversity offset agreements
Field surveyors must understand these economic realities when planning biodiversity net gain projects, ensuring monitoring protocols remain financially viable while meeting regulatory standards.
Voluntary vs. Mandatory Credit Systems
The biodiversity credit landscape in 2026 encompasses both mandatory BNG requirements and emerging voluntary markets:
Mandatory BNG Credits (UK)
- Governed by Environment Act 2021 and secondary legislation
- Standardized using Defra Biodiversity Metric
- Registered through national habitat bank
- 30-year legal agreements with monitoring obligations
- Statutory credit prices set by government
Voluntary Biodiversity Credits (Global)
- Operate internationally with flexible frameworks
- Measure proportional biodiversity value increases
- Allow diverse ecological approaches including rewilding
- Market-determined pricing based on supply and demand
- Function most effectively combined with complementary funding [1]
Field surveyors may work across both systems, requiring familiarity with different standards, verification protocols, and reporting requirements. Understanding the importance of BNG to the UK helps contextualize these regulatory and market developments.
Challenges and Future Directions for Rewilding Evaluations
As rewilding project evaluations for Biodiversity Net Gain mature in 2026, field surveyors confront persistent challenges while embracing emerging opportunities.
Data Standardization and Interoperability
Despite frameworks like the Wallacea Trust system, inconsistencies remain in how different surveyors collect, analyze, and report biodiversity data. Key challenges include:
- Taxonomic resolution differences between generalist and specialist surveyors
- Survey effort variation affecting detection probabilities and species lists
- Temporal sampling inconsistencies complicating trend analysis
- Data format incompatibilities hindering aggregation across projects
Professional organizations and regulatory bodies are working toward greater standardization through:
📋 Competency frameworks defining minimum surveyor qualifications
💻 Shared data platforms enabling consistent data capture and reporting
🔬 Quality assurance schemes providing independent verification of survey data
📚 Best practice guidance documenting proven methodologies for different habitat types
Climate Change Adaptation and Novel Ecosystems
Rewilding projects increasingly encounter ecological conditions without historical precedent. Field surveyors must adapt evaluation approaches to:
- Shifting species ranges as climate envelopes move northward
- Novel species assemblages combining native and colonizing species
- Altered phenology affecting optimal survey timing
- Extreme weather impacts causing episodic disturbance and recovery
The EU Nature Restoration Regulation [4] recognizes these challenges, establishing flexible targets that accommodate climate-driven ecological change while maintaining restoration ambition.
Integration with Broader Environmental Frameworks
Rewilding project evaluations in 2026 increasingly connect with multiple policy frameworks:
🌍 Carbon sequestration measurement for climate mitigation credits
💧 Water quality monitoring for catchment management schemes
🏞️ Ecosystem service valuation for natural capital accounting
🌾 Agricultural subsidy compliance under schemes like the Sustainable Farming Incentive
Field surveyors developing skills across these domains provide greater value to clients while ensuring rewilding projects maximize multiple benefits.
Emerging Technologies on the Horizon
Several technological innovations promise to enhance rewilding evaluations beyond 2026:
Environmental DNA (eDNA) Sampling
- Water and soil samples revealing species presence without direct observation
- Particularly valuable for cryptic and rare species
- Reduced survey effort compared to traditional methods
- Challenges remain in quantifying abundance and distinguishing live populations from residual DNA
Acoustic Monitoring Arrays
- Automated recording units capturing bird and bat vocalizations
- Machine learning algorithms identifying species from sound signatures
- Continuous monitoring revealing temporal activity patterns
- Integration with camera trap networks for comprehensive surveillance
Satellite Remote Sensing
- Freely available Sentinel-2 imagery providing 10m resolution habitat mapping
- Radar data penetrating vegetation canopy to assess structure
- Thermal sensors detecting microclimate variations
- Complementing drone surveys for landscape-scale analysis
These technologies will augment rather than replace traditional field survey skills. The ecological expertise to interpret data, understand species ecology, and assess habitat quality remains fundamental to credible biodiversity net gain evaluations.
Conclusion
Rewilding Project Evaluations for Biodiversity Net Gain: Field Surveyor Metrics for Ecosystem Recovery in 2026 represents a maturing discipline at the intersection of ecology, technology, and environmental policy. The evidence is compelling: rewilded sites can achieve 69-92% biodiversity increases over 30 years [1], with measurable improvements in pollinator diversity, fungal communities, and overall species richness compared to conventional land uses.
Field surveyors provide the empirical foundation for these claims, employing standardized protocols that combine traditional ecological survey techniques with cutting-edge tools like drone mapping and camera traps. The Wallacea Trust framework and similar systems enable consistent measurement across diverse projects, translating complex ecological data into quantifiable biodiversity credits that support both regulatory compliance and voluntary conservation finance.
Key Success Factors for Effective Rewilding Evaluations
✅ Comprehensive baseline assessments establishing accurate starting points for recovery measurement
✅ Long-term monitoring commitments capturing gradual ecosystem maturation over decades
✅ Technology integration leveraging drones, camera traps, and GIS for efficient data collection
✅ Standardized methodologies ensuring comparability and regulatory acceptance
✅ Habitat connectivity analysis recognizing landscape-scale ecological processes
✅ Financial sustainability balancing monitoring rigor with budget realities
Actionable Next Steps for Stakeholders
For Developers and Landowners:
- Engage qualified ecological surveyors early in project planning to establish robust baseline data
- Budget adequately for 30-year monitoring commitments required for BNG compliance
- Explore combined on-site and off-site delivery options to optimize biodiversity outcomes
- Consider voluntary biodiversity credit generation as supplementary revenue stream
For Field Surveyors:
- Invest in training for emerging technologies including drone operation and GIS analysis
- Maintain species identification skills across multiple taxonomic groups
- Develop understanding of BNG regulatory requirements and credit market dynamics
- Participate in professional development and quality assurance schemes
For Conservation Organizations:
- Advocate for continued refinement of standardized measurement frameworks
- Support research documenting long-term rewilding outcomes
- Promote data sharing platforms enabling cross-project learning
- Engage with policy development ensuring regulations support ambitious restoration
The journey toward nature recovery requires rigorous, transparent evaluation. As rewilding projects proliferate across the UK and globally, the field surveyor metrics and protocols established in 2026 will shape ecosystem restoration for decades to come. The evidence from pioneering sites like Knepp Estate demonstrates what's possible—now the challenge lies in scaling these successes through professional, standardized evaluation that gives confidence to investors, regulators, and society that biodiversity net gain is being genuinely achieved.
References
[1] Voluntary Biodiversity Credits Could Help Fund Global Nature Recovery Alongside Other Approaches – https://www.cam.ac.uk/research/news/voluntary-biodiversity-credits-could-help-fund-global-nature-recovery-alongside-other-approaches
[2] Biodiversity Net Gain Regulations Opportunities And Challenges January 2026 – https://www.ipf.org.uk/resourceLibrary/biodiversity-net-gain-regulations—opportunities-and-challenges–january-2026-.html
[3] The State Of Biodiversity Net Gain In 2026 Key Policy Updates – https://biodiversity-netgain.co.uk/the-state-of-biodiversity-net-gain-in-2026-key-policy-updates/
[4] Nature Restoration Regulation En – https://environment.ec.europa.eu/topics/nature-and-biodiversity/nature-restoration-regulation_en
[5] Streamlining Bng A Digital Solution For Nattergals Rewilding Project – https://coreo.io/case-studies/streamlining-bng-a-digital-solution-for-nattergals-rewilding-project/
