
Imagine conducting a routine biodiversity survey in a recovering woodland, meticulously documenting species counts and habitat quality, only to discover that invisible air pollutants from past wildfires are fundamentally altering the ecosystem's recovery trajectory. Recent groundbreaking research from December 2025 has revealed that wildfire emissions release 21% more air pollutants than previously estimated[1][2], fundamentally changing how ecology surveyors must approach habitat assessments in 2026 and beyond.
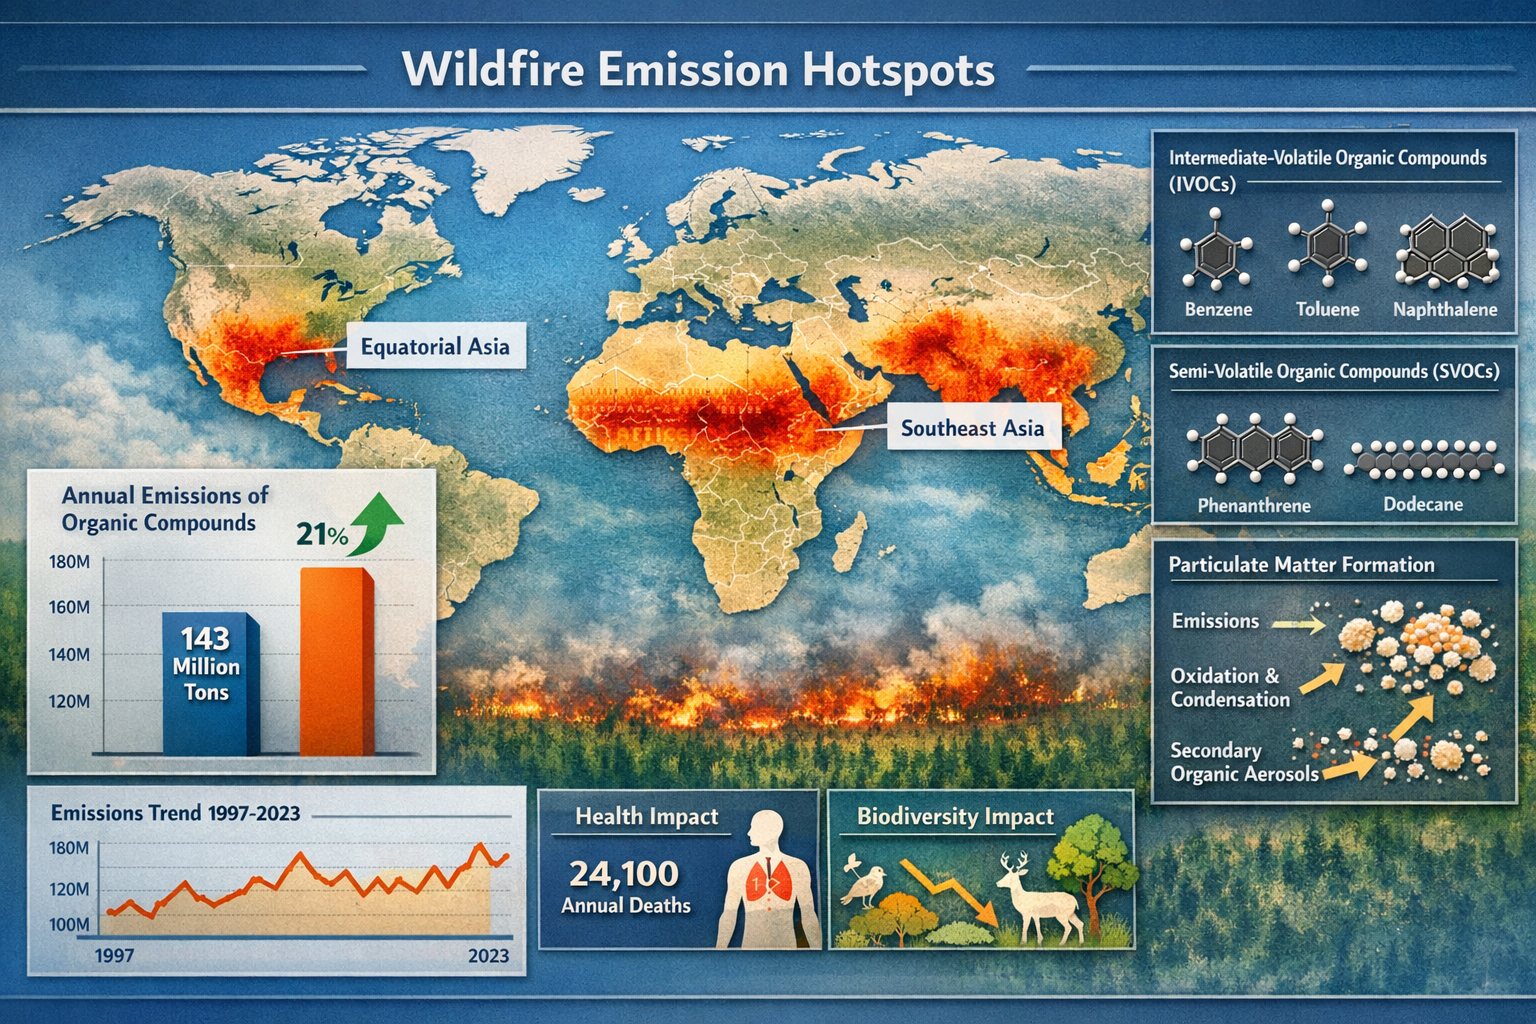
This revelation has profound implications for biodiversity professionals. The integration of air quality metrics into traditional ecological surveys is no longer optional—it's essential for accurate habitat assessments and biodiversity net gain calculations. As wildland fires have released an average of 143 million tons of airborne organic compounds annually between 1997 and 2023[1][2], understanding and quantifying these emissions has become a critical competency for modern ecology surveyors.
Quantifying Wildfire Air Pollutant Emissions in Biodiversity Surveys: 2026 Field Protocols for Ecology Surveyors represents a paradigm shift in ecological assessment methodology. This comprehensive guide addresses the urgent need to integrate atmospheric pollution measurements with traditional biodiversity metrics, ensuring that habitat evaluations reflect the complete environmental picture.
Key Takeaways
- 🔥 Wildfire emissions are 21% higher than previously calculated, requiring updated assessment protocols for accurate biodiversity evaluations[1][2]
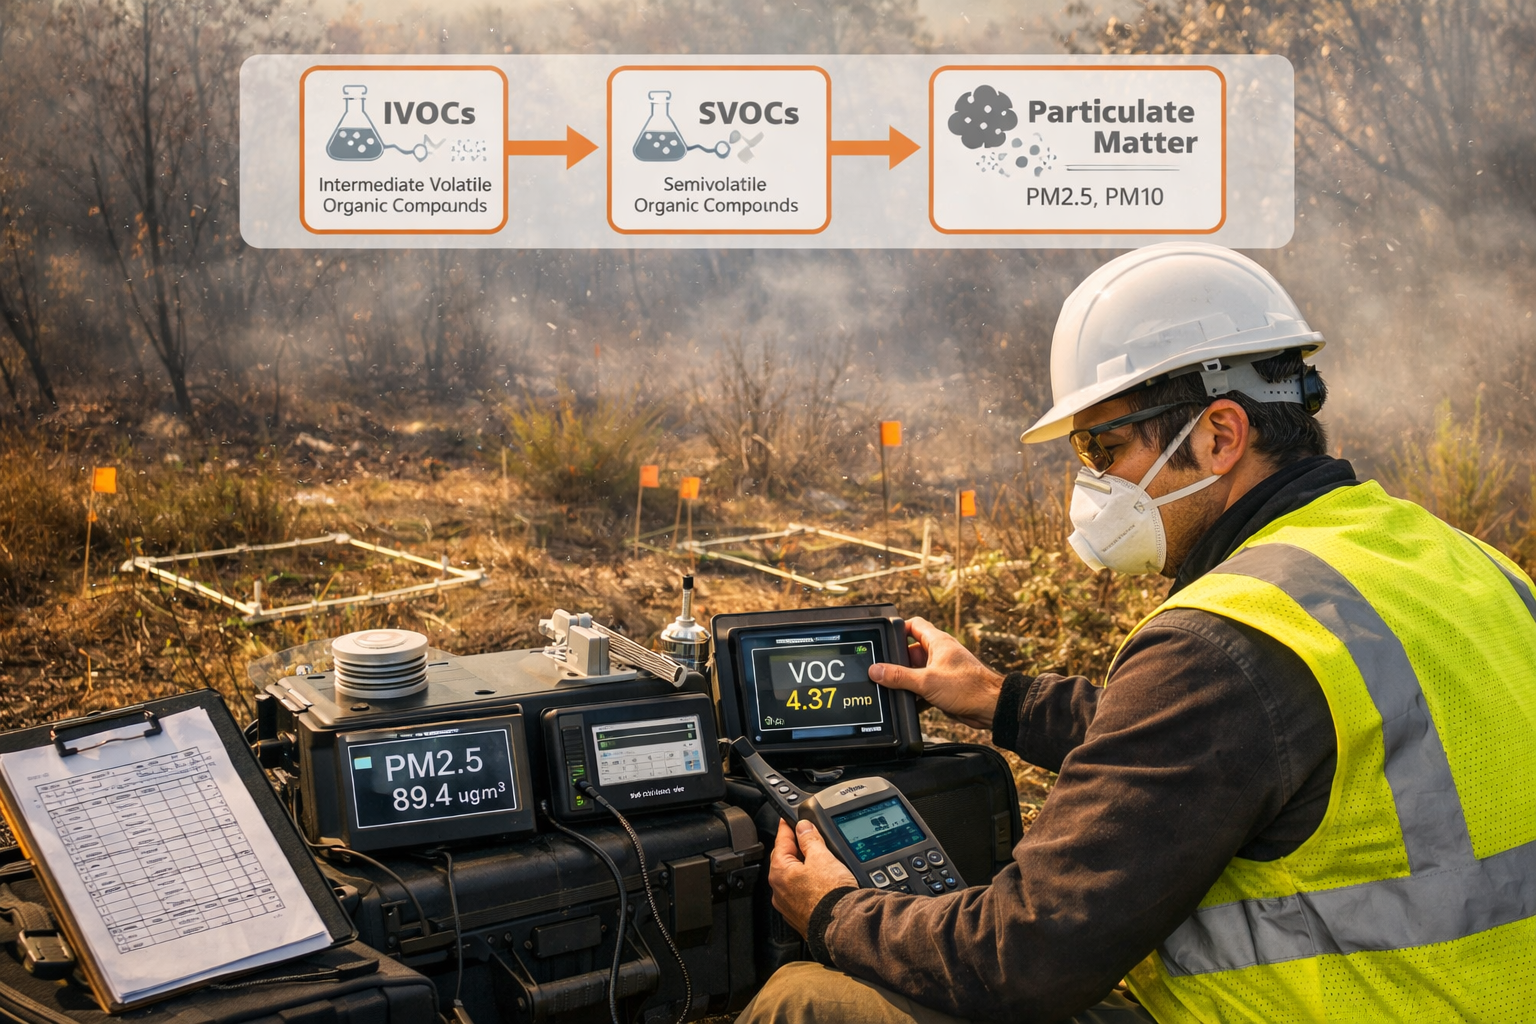
- 📊 Intermediate- and semi-volatile organic compounds (IVOCs and SVOCs) from wildfires form harmful fine particles that directly impact habitat quality and species health[1][2]
- 🌍 Key emission hotspots include Equatorial Asia, Northern Hemisphere Africa, and Southeast Asia, where biodiversity surveys must prioritize air quality integration[1][2]
- 💀 Wildfire smoke pollution contributes to 24,100 deaths annually in the United States alone, demonstrating the critical health-biodiversity connection[3][4]
- ✅ Integrated field protocols combining air quality monitoring with traditional biodiversity metrics provide more accurate net gain calculations and habitat assessments
Understanding the Wildfire-Biodiversity Connection
The Hidden Impact of Wildfire Emissions
Wildfires don't just burn vegetation—they fundamentally alter the chemical composition of the atmosphere in ways that persist long after flames are extinguished. The December 2025 study published by researchers has fundamentally changed our understanding of wildfire emissions, revealing that these events release significantly more organic compounds than atmospheric models previously accounted for[1][2].
What makes this discovery so significant? The additional 21% of emissions consists primarily of intermediate-volatile organic compounds (IVOCs) and semi-volatile organic compounds (SVOCs)[1][2]. Unlike traditional volatile organic compounds that disperse more readily, these IVOCs and SVOCs have a troubling tendency to form fine particulate matter—the microscopic particles that penetrate deep into living tissues and cause widespread ecological damage.
For ecology surveyors conducting biodiversity impact assessments, this means that post-fire habitats contain invisible pollutants that affect:
- Plant photosynthesis efficiency through stomatal interference
- Pollinator navigation and foraging behavior via chemical signal disruption
- Soil microbial communities essential for nutrient cycling
- Water quality in nearby streams and wetlands
- Animal respiratory health across all species groups
Global Emission Patterns and Biodiversity Hotspots
The research spanning 1997-2023 has identified critical emission hotspots that overlap significantly with global biodiversity priority areas[1][2]. The three primary regions experiencing the highest wildfire organic compound emissions are:
| Region | Annual Emission Impact | Biodiversity Significance |
|---|---|---|
| Equatorial Asia | Highest IVOC/SVOC concentrations | Critical rainforest ecosystems |
| Northern Hemisphere Africa | Extensive savanna fire emissions | Mega-fauna migration corridors |
| Southeast Asia | Peatland fire compounds | Endemic species strongholds |
These overlapping zones create a critical challenge: the areas experiencing the most severe air quality degradation from wildfires are often the same regions harboring irreplaceable biodiversity. This intersection demands that surveyors working in these regions adopt enhanced protocols that account for atmospheric pollution impacts.
Health Impacts Extending to Ecosystem Function
The human health crisis caused by wildfire smoke—responsible for approximately 24,100 deaths per year in the United States alone[3][4]—provides a sobering preview of the impacts on wildlife populations. Fine particulate matter from wildfire emissions affects biological systems universally, regardless of species.
When conducting surveys for biodiversity net gain calculations, surveyors must now consider that baseline habitat quality may be compromised by air pollutants that:
- Reduce reproductive success in sensitive species
- Alter predator-prey dynamics through sensory impairment
- Decrease plant vigor and ecosystem productivity
- Compromise immune system function across taxa
- Accelerate habitat degradation beyond visible fire damage
Quantifying Wildfire Air Pollutant Emissions in Biodiversity Surveys: Essential Equipment and Methods
Core Air Quality Monitoring Equipment for Field Surveys
Integrating air quality measurements into biodiversity surveys requires specialized equipment that complements traditional ecological monitoring tools. In 2026, ecology surveyors should consider the following essential instruments:
Portable Particulate Matter Monitors
- PM2.5 and PM10 sensors: Measure fine and coarse particulate concentrations
- Real-time data logging: Track temporal variations throughout survey periods
- GPS integration: Georeference air quality data with habitat locations
- Battery life: Minimum 8-hour continuous operation for full field days
Volatile Organic Compound (VOC) Analyzers
- Multi-gas detection: Identify specific organic compound classes
- IVOC/SVOC sensitivity: Target the newly-identified emission categories[1][2]
- Calibration standards: Regular verification against known concentrations
- Data export capability: Integration with biodiversity databases
Meteorological Instruments
- Wind speed and direction sensors: Track pollutant dispersal patterns
- Temperature and humidity monitors: Contextualize emission behavior
- Atmospheric pressure gauges: Account for altitude effects
- Solar radiation meters: Assess photochemical reaction potential
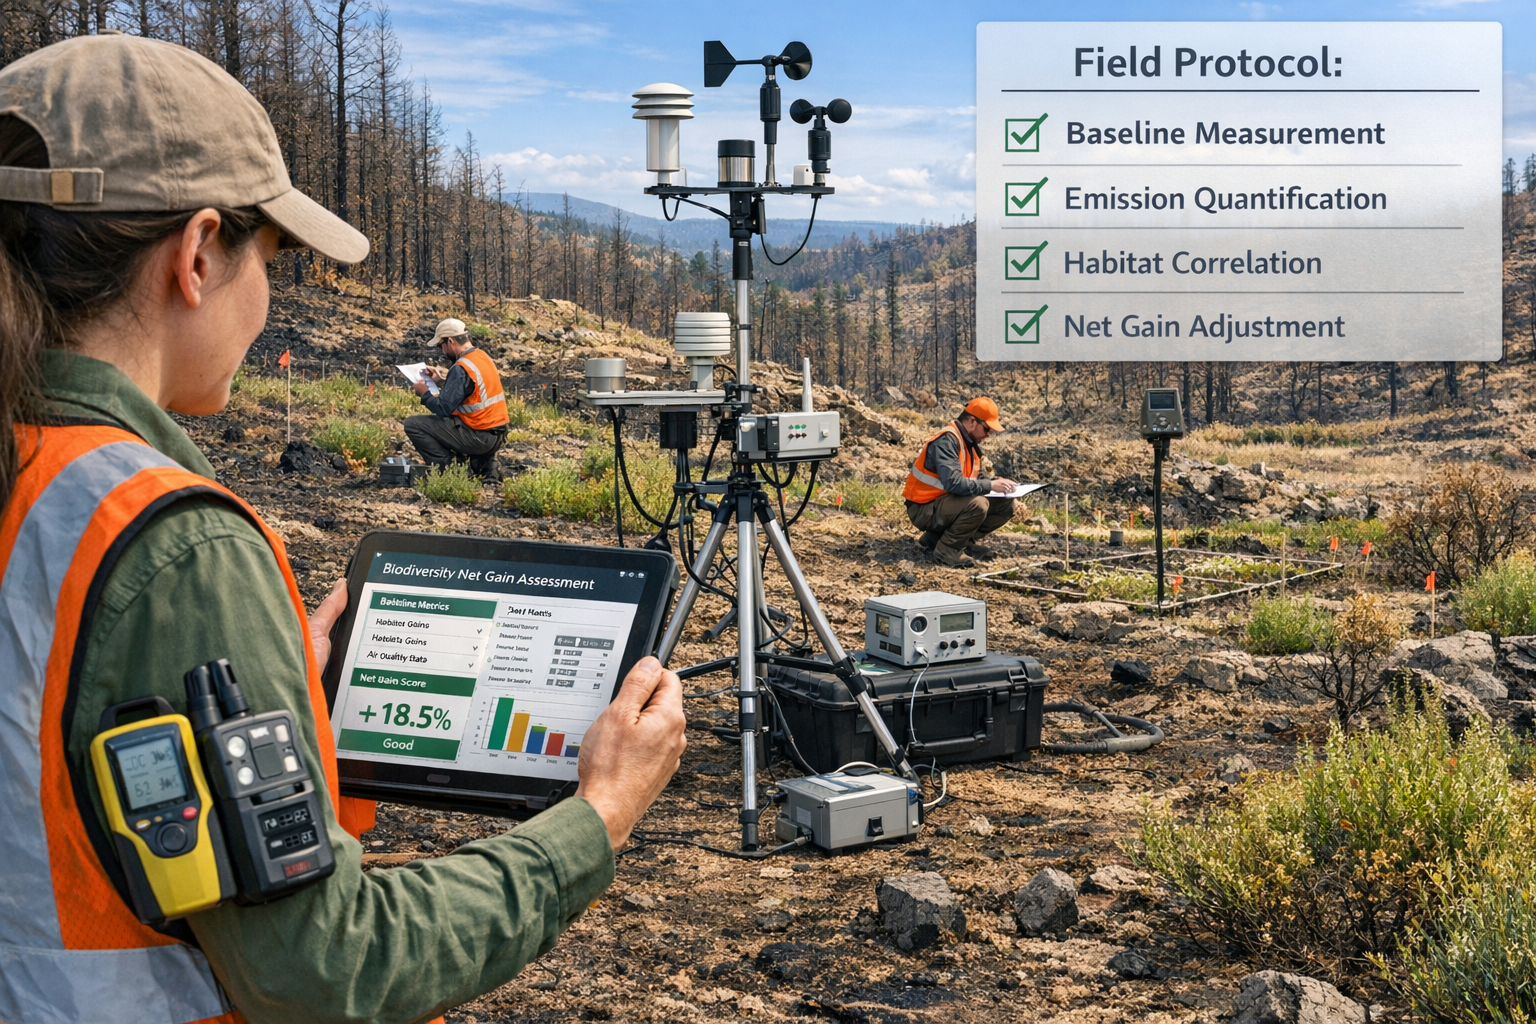
Field Protocol Integration Framework
Successfully quantifying wildfire air pollutant emissions within biodiversity surveys requires a systematic integration framework. The following protocol ensures comprehensive data collection without compromising traditional survey objectives:
Pre-Survey Planning Phase
- Historical fire analysis: Review wildfire occurrence within 5km radius over past 5 years
- Prevailing wind assessment: Identify likely pollutant transport corridors
- Equipment calibration: Verify all air quality sensors against standards
- Safety protocols: Establish air quality thresholds for surveyor health protection
Field Implementation Protocol
-
Baseline measurements (15 minutes before biodiversity transects)
- Record ambient PM2.5, PM10, and VOC concentrations
- Document meteorological conditions
- Photograph atmospheric visibility conditions
- Note any smoke odor or haze presence
-
Synchronized monitoring (during biodiversity surveys)
- Continuous air quality logging throughout survey duration
- Coordinate GPS timestamps between ecological and atmospheric data
- Record observations of wildlife behavior potentially linked to air quality
- Document vegetation stress indicators beyond fire damage
-
Habitat-specific measurements (at each survey station)
- Microclimate air quality readings at ground level, mid-canopy, and canopy top
- Particulate deposition sampling on vegetation surfaces
- Soil surface emission measurements in recently burned areas
- Water body interface atmospheric sampling
Data Collection and Recording Standards
Standardized data recording ensures that air quality measurements integrate seamlessly with biodiversity metrics for comprehensive biodiversity assessments. The following data fields should be recorded for each survey location:
Atmospheric Pollutant Data Fields
- Date, time, and GPS coordinates (decimal degrees, WGS84)
- PM2.5 concentration (μg/m³)
- PM10 concentration (μg/m³)
- Total VOC concentration (ppb)
- IVOC concentration (when equipment available, μg/m³)
- SVOC concentration (when equipment available, μg/m³)
- Temperature (°C), relative humidity (%), wind speed (m/s), wind direction (degrees)
- Atmospheric pressure (hPa)
- Visibility estimate (meters)
- Smoke presence (none/light/moderate/heavy)
Integration with Biodiversity Metrics
- Habitat type classification
- Vegetation condition score (adjusted for air quality impacts)
- Species richness and abundance data
- Behavioral observations potentially linked to air quality
- Photographic documentation showing atmospheric conditions
- Notes on species absences potentially explained by air quality
Quality Assurance and Quality Control (QA/QC)
Maintaining data integrity when quantifying wildfire air pollutant emissions requires rigorous quality control measures:
✅ Daily Equipment Checks
- Zero and span calibration verification each morning
- Battery level confirmation before field deployment
- Data logger memory capacity verification
- Physical inspection for damage or contamination
✅ Field Blanks and Controls
- Collect air samples from reference locations unaffected by wildfire
- Compare readings across multiple instruments when available
- Document any equipment malfunctions or anomalous readings
- Record equipment serial numbers and calibration dates
✅ Data Validation Procedures
- Cross-reference air quality readings with regional monitoring networks
- Verify GPS accuracy within ±5 meters
- Check for data gaps or logger failures
- Flag outlier values for review and annotation
Quantifying Wildfire Air Pollutant Emissions in Biodiversity Surveys: Analytical Methods and Interpretation
Converting Air Quality Data to Habitat Impact Metrics
The critical challenge facing ecology surveyors in 2026 is translating atmospheric pollutant concentrations into meaningful habitat quality adjustments. This conversion process requires understanding dose-response relationships between air pollutants and ecological function.
Vegetation Impact Assessment
Research has established threshold concentrations above which plant communities experience measurable stress:
- PM2.5 > 35 μg/m³ (24-hour average): Reduced photosynthetic efficiency in herbaceous plants
- PM2.5 > 55 μg/m³ (24-hour average): Visible foliar damage in sensitive species
- VOCs > 500 ppb: Altered plant-pollinator chemical signaling
- Chronic exposure (seasonal averages > 12 μg/m³ PM2.5): Cumulative growth reduction
When conducting habitat condition assessments, apply the following adjustment factors to vegetation scores:
| PM2.5 Concentration | Habitat Condition Modifier | Rationale |
|---|---|---|
| < 12 μg/m³ | No adjustment | Background levels |
| 12-35 μg/m³ | -5% condition score | Mild chronic stress |
| 35-55 μg/m³ | -15% condition score | Moderate acute impacts |
| > 55 μg/m³ | -25% condition score | Severe impairment |
Wildlife Population Impact Factors
Air pollutant exposure affects wildlife populations through multiple pathways. When analyzing species abundance data, consider these documented effects:
- Respiratory stress: Reduced activity levels, altered habitat use patterns
- Reproductive impairment: Decreased breeding success in polluted areas
- Behavioral changes: Modified foraging efficiency, predator avoidance
- Immunosuppression: Increased disease susceptibility and mortality
For biodiversity net gain calculations, incorporate air quality impacts by:
- Adjusting baseline condition scores downward in proportion to pollutant exposure
- Modifying habitat distinctiveness ratings for chronically impacted areas
- Applying temporal discounting for habitats requiring extended recovery periods
- Documenting uncertainty introduced by air quality variables
Spatial Analysis and Emission Mapping
Understanding the spatial distribution of wildfire air pollutants enhances survey accuracy and informs targeted conservation strategies. Modern GIS tools enable sophisticated emission mapping that integrates with traditional habitat mapping.
Creating Air Quality Overlay Maps
- Import field data: Load GPS-referenced air quality measurements into GIS software
- Interpolation analysis: Use kriging or inverse distance weighting to create continuous pollutant surfaces
- Habitat layer integration: Overlay air quality surfaces on habitat classification maps
- Impact zone delineation: Identify areas where pollutant concentrations exceed ecological thresholds
Emission Source Modeling
When historical wildfire data is available, apply dispersion modeling to predict pollutant distribution:
- HYSPLIT trajectories: Model smoke plume transport from known fire locations
- CALPUFF modeling: Estimate ground-level concentrations from emission sources
- Terrain analysis: Account for topographic effects on pollutant accumulation
- Vegetation structure: Consider canopy effects on particulate deposition
These spatial analyses prove particularly valuable when working with developers on biodiversity plans, as they identify areas requiring enhanced mitigation or extended monitoring periods.
Statistical Analysis and Correlation Studies
Robust statistical analysis strengthens the scientific foundation of integrated wildfire-biodiversity assessments. The following analytical approaches provide defensible evidence for management decisions:
Correlation Analysis
- Test relationships between air pollutant concentrations and species richness
- Examine associations between PM2.5 levels and vegetation condition scores
- Analyze temporal patterns linking fire events to biodiversity changes
- Calculate correlation coefficients with appropriate significance testing
Multivariate Analysis
- Principal component analysis (PCA) to identify dominant environmental gradients
- Redundancy analysis (RDA) to partition variance between air quality and other factors
- Cluster analysis to group sites by combined biodiversity-air quality profiles
- NMDS ordination to visualize community composition along pollution gradients
Threshold Detection
- Piecewise regression to identify pollutant concentration breakpoints
- Generalized additive models (GAMs) to model non-linear responses
- Classification and regression trees (CART) to define decision rules
- Threshold indicator taxa analysis (TITAN) to identify sensitive species
Reporting Standards for Integrated Assessments
Comprehensive reporting ensures that air quality data enhances rather than complicates biodiversity assessments. The following reporting framework meets professional standards while remaining accessible to stakeholders:
Executive Summary Components
- Clear statement of survey objectives and spatial scope
- Summary of air quality conditions encountered during surveys
- Key findings regarding pollutant impacts on habitat quality
- Recommendations for management or mitigation
- Implications for biodiversity net gain calculations
Technical Data Presentation
- Tabular summary of air quality measurements by survey location
- Maps showing spatial distribution of pollutants and biodiversity metrics
- Graphs illustrating temporal patterns and correlations
- Statistical analysis results with appropriate confidence intervals
- Photographic documentation of atmospheric and ecological conditions
Integration with Biodiversity Net Gain Reporting
When preparing reports for biodiversity net gain compliance, include dedicated sections addressing:
- Baseline condition adjustments: Document how air quality influenced initial habitat scores
- Uncertainty quantification: Specify confidence intervals widened by air quality variables
- Monitoring recommendations: Propose continued air quality tracking during post-development phases
- Mitigation opportunities: Identify interventions that address both biodiversity and air quality
- Temporal considerations: Explain recovery timelines affected by persistent pollutants
Advanced Considerations for Wildfire Emission Quantification
Seasonal and Temporal Dynamics
Wildfire air pollutant impacts on biodiversity vary substantially across temporal scales, requiring surveyors to consider timing carefully when planning assessments.
Immediate Post-Fire Period (0-3 months)
- Highest pollutant concentrations: Active emissions from smoldering materials
- Acute wildlife impacts: Displacement, respiratory distress, mortality
- Vegetation stress: Combined fire damage and atmospheric pollution
- Survey challenges: Safety concerns, access limitations, equipment protection
Early Recovery Phase (3-12 months)
- Declining but persistent emissions: Continued release from burned organic matter
- Particulate deposition effects: Accumulated pollutants on vegetation surfaces
- Species recolonization: Air quality influences which species return first
- Critical assessment window: Baseline conditions for recovery monitoring
Medium-term Recovery (1-5 years)
- Background pollutant levels: Return to regional atmospheric conditions
- Legacy effects: Soil chemistry alterations, vegetation community shifts
- Chronic exposure impacts: Cumulative effects on long-lived species
- Comparative assessments: Distinguishing fire versus air quality impacts
Long-term Patterns (>5 years)
- Ecosystem trajectory: Permanent versus temporary biodiversity changes
- Repeated fire effects: Cumulative impacts in fire-prone landscapes
- Climate interactions: Changing fire regimes and emission patterns
- Adaptive management: Incorporating lessons into future protocols
Species-Specific Sensitivity Considerations
Different taxonomic groups exhibit varying sensitivity to wildfire air pollutants, requiring tailored survey approaches:
Highly Sensitive Groups
- 🦋 Invertebrates: Particularly pollinators dependent on chemical signaling
- 🐦 Birds: Efficient respiratory systems concentrate particulate exposure
- 🦎 Amphibians: Permeable skin increases pollutant uptake
- 🌸 Flowering plants: Reproductive success impaired by pollinator disruption
Moderately Sensitive Groups
- 🦌 Mammals: Size-dependent effects, smaller species more vulnerable
- 🐍 Reptiles: Behavioral thermoregulation may reduce exposure
- 🌲 Woody vegetation: Established plants show greater resilience
Indicator Species Selection
When designing monitoring programs, prioritize species that:
- Have documented sensitivity to air pollutants
- Occupy multiple trophic levels
- Represent key functional groups
- Are reliably detectable using standard survey methods
- Occur across pollutant concentration gradients
Emerging Technologies and Future Protocols
The field of integrated wildfire-biodiversity assessment continues to evolve rapidly. Ecology surveyors should monitor these developing technologies:
Remote Sensing Advances
- Satellite-based air quality monitoring: Real-time PM2.5 and aerosol optical depth
- Drone-mounted sensors: High-resolution pollutant mapping at habitat scale
- LiDAR vegetation analysis: Detecting structural changes from chronic exposure
- Hyperspectral imaging: Identifying vegetation stress signatures
Sensor Network Innovations
- Low-cost sensor arrays: Dense spatial coverage for fine-scale mapping
- IoT-enabled continuous monitoring: Long-term deployment in fixed locations
- Multi-pollutant platforms: Integrated measurement of diverse compounds
- Cloud-based data management: Real-time access and analysis
Molecular and Biomarker Approaches
- Environmental DNA (eDNA): Detecting species presence in polluted environments
- Bioaccumulation analysis: Measuring pollutant loads in tissue samples
- Stress protein expression: Molecular indicators of air quality impacts
- Microbiome profiling: Soil and gut community responses to pollutants
Integration with Climate Change Assessments
Wildfire emissions represent a critical intersection between climate change and biodiversity loss. Forward-thinking surveyors should consider:
Climate-Fire-Biodiversity Feedbacks
- Warming temperatures increase fire frequency and intensity
- Increased emissions accelerate atmospheric warming
- Biodiversity loss reduces ecosystem fire resilience
- Degraded habitats become more fire-prone
Scenario Planning for Future Conditions
When working with planners and developers on biodiversity strategies, incorporate climate-fire projections:
- Model future fire regimes under different climate scenarios
- Estimate emission trajectories based on projected fire activity
- Assess habitat vulnerability to combined climate and air quality stresses
- Design resilient interventions that address multiple stressors
- Plan adaptive monitoring that tracks changing conditions over time
Regulatory and Policy Landscape
The integration of air quality metrics into biodiversity assessments aligns with evolving regulatory frameworks:
Current Policy Drivers
- Air quality standards: EPA and equivalent international regulations
- Biodiversity net gain requirements: Mandatory habitat quality assessments
- Climate action commitments: COP27 and subsequent agreements
- Environmental impact assessment: Comprehensive evaluation requirements
Anticipated Regulatory Developments
- Explicit air quality components in biodiversity assessment guidance
- Standardized protocols for wildfire impact quantification
- Integration of atmospheric monitoring with ecological surveys
- Enhanced reporting requirements for fire-affected areas
Staying informed about these policy developments ensures that survey protocols remain compliant and scientifically defensible. Professional organizations and regulatory agencies regularly update guidance documents that surveyors should review quarterly.
Practical Implementation: Case Studies and Lessons Learned
Case Study 1: Post-Wildfire Woodland Recovery Assessment
Context: A 150-hectare mixed deciduous woodland in southeast England experienced a significant wildfire in summer 2024. A development proposal adjacent to the site required comprehensive biodiversity assessment in spring 2026.
Integrated Protocol Implementation:
- Deployed continuous PM2.5 monitors at five locations across the site
- Conducted synchronized air quality and vegetation surveys
- Measured particulate deposition on leaf surfaces
- Compared results with unburned reference woodland
Key Findings:
- PM2.5 concentrations averaged 18 μg/m³, 50% above regional background
- Vegetation condition scores required 10% downward adjustment
- Pollinator abundance 35% lower than predicted by habitat structure alone
- Particulate loading on vegetation correlated with reduced photosynthetic rates
Implications for Net Gain Calculations:
- Baseline habitat value reduced by 12% due to air quality impacts
- Extended monitoring period recommended (5 years vs. standard 3 years)
- Additional off-site compensation required to achieve 10% net gain
- Mitigation strategy included air quality improvement measures
Lessons Learned:
- Early-season surveys captured residual winter emissions from smoldering materials
- Multi-season monitoring revealed temporal variation in pollutant concentrations
- Integration with biodiversity impact assessment protocols strengthened overall evaluation
- Stakeholder communication improved when air quality data visualized alongside biodiversity metrics
Case Study 2: Heathland Habitat Banking Site Evaluation
Context: A landowner proposed establishing a habitat banking site on 50 hectares of degraded heathland located 3 km downwind from an area experiencing recurrent wildfires.
Integrated Protocol Implementation:
- Twelve-month continuous air quality monitoring program
- Seasonal biodiversity surveys aligned with air quality data collection
- Spatial analysis of pollutant dispersion from fire sources
- Comparison with potential alternative banking sites
Key Findings:
- Seasonal PM2.5 peaks during August-September fire season exceeded 45 μg/m³
- Heathland specialist invertebrates showed 40% reduced abundance during high-pollution periods
- Vegetation recovery rates 25% slower than unpolluted reference sites
- Chronic exposure effects persisted beyond visible fire impacts
Implications for Habitat Banking:
- Site valuation reduced by 18% to account for air quality limitations
- Biodiversity unit pricing adjusted to reflect reduced habitat quality
- Management plan incorporated air quality monitoring and adaptive responses
- Alternative site selected for primary habitat banking investment
Lessons Learned:
- Long-term monitoring essential for sites in fire-prone landscapes
- Air quality impacts substantially affect habitat banking viability
- Transparent communication about limitations builds stakeholder trust
- Integration with guidance for landowners improved decision-making
Case Study 3: Urban Development Biodiversity Assessment
Context: A major residential development proposed on a 20-hectare site adjacent to urban parkland that experienced wildfire impacts from nearby industrial fire events.
Integrated Protocol Implementation:
- High-density air quality monitoring grid (15 locations)
- Synchronized ecological and atmospheric surveys
- Source apportionment analysis distinguishing wildfire from urban pollution
- Community engagement regarding air quality and biodiversity
Key Findings:
- Complex pollutant mixture from multiple sources required sophisticated analysis
- Wildfire emissions contributed 30% of total particulate matter
- Biodiversity impacts attributable specifically to wildfire emissions quantified
- Urban heat island effects exacerbated pollutant impacts on vegetation
Implications for Development Planning:
- Biodiversity net gain strategy incorporated air quality improvement features
- Green infrastructure designed to filter particulates and support biodiversity
- Monitoring program established to track both air quality and ecological outcomes
- Development phasing aligned with habitat recovery timelines
Lessons Learned:
- Urban contexts require distinguishing wildfire from other pollution sources
- Multi-benefit interventions addressing air quality and biodiversity most effective
- Community health and ecological health messaging resonated with stakeholders
- Integration with architect and developer guidance improved project outcomes
Training and Professional Development for Surveyors
Essential Competencies for Integrated Assessment
Successfully implementing protocols for quantifying wildfire air pollutant emissions in biodiversity surveys requires surveyors to develop new competencies beyond traditional ecological training:
Technical Skills
- ✅ Operation and calibration of air quality monitoring equipment
- ✅ Data management for combined ecological and atmospheric datasets
- ✅ GIS analysis integrating multiple data layers
- ✅ Statistical analysis of multivariate environmental data
- ✅ Quality assurance and quality control procedures
Conceptual Understanding
- ✅ Atmospheric chemistry and pollutant behavior
- ✅ Dose-response relationships for ecological systems
- ✅ Spatial and temporal dynamics of emission dispersion
- ✅ Ecosystem service interactions between air quality and biodiversity
- ✅ Climate-fire-biodiversity feedback mechanisms
Professional Practice
- ✅ Integrated report writing combining multiple data types
- ✅ Stakeholder communication about complex environmental interactions
- ✅ Regulatory compliance across air quality and biodiversity frameworks
- ✅ Adaptive management and monitoring program design
- ✅ Interdisciplinary collaboration with air quality specialists
Recommended Training Pathways
Professional development opportunities for ecology surveyors seeking to implement these protocols include:
Formal Education
- Short courses in atmospheric science and air quality monitoring
- GIS and spatial analysis workshops focused on environmental applications
- Statistical analysis training for multivariate ecological data
- Environmental health and toxicology fundamentals
Professional Certifications
- Air quality monitoring technician certifications
- Advanced ecological survey credentials with air quality modules
- Environmental data management and analysis qualifications
- Health and safety training for working in polluted environments
Practical Experience
- Mentorship with experienced practitioners implementing integrated protocols
- Participation in collaborative research projects
- Attendance at conferences bridging ecology and atmospheric science
- Field trials of new equipment and methodologies
Building Interdisciplinary Teams
The complexity of integrated wildfire-biodiversity assessments often exceeds the capacity of individual surveyors. Building effective interdisciplinary teams enhances project outcomes:
Core Team Composition
- Ecology surveyor: Traditional biodiversity assessment expertise
- Air quality specialist: Atmospheric monitoring and data interpretation
- GIS analyst: Spatial data integration and visualization
- Statistician: Advanced data analysis and modeling
- Project manager: Coordination and stakeholder communication
Collaborative Workflows
- Joint protocol development: All team members contribute to survey design
- Coordinated field implementation: Synchronized data collection activities
- Integrated data analysis: Combined interpretation of multiple data streams
- Collaborative reporting: Unified presentation of findings and recommendations
- Adaptive learning: Team debriefs and protocol refinement
This collaborative approach proves particularly valuable when working on complex projects requiring comprehensive biodiversity planning.
Conclusion: The Future of Integrated Biodiversity Assessment
The revelation that wildfire emissions are 21% higher than previously estimated[1][2] represents more than a scientific footnote—it fundamentally reshapes how ecology surveyors must approach habitat assessment in 2026 and beyond. The integration of air quality monitoring into biodiversity surveys is no longer an optional enhancement but an essential component of rigorous ecological evaluation.
Quantifying Wildfire Air Pollutant Emissions in Biodiversity Surveys: 2026 Field Protocols for Ecology Surveyors provides the framework necessary to meet this challenge. By systematically measuring atmospheric pollutants alongside traditional biodiversity metrics, surveyors can:
- Deliver more accurate baseline habitat assessments
- Calculate biodiversity net gain with greater precision
- Identify management interventions addressing multiple stressors
- Provide stakeholders with comprehensive environmental intelligence
- Contribute to scientific understanding of fire-biodiversity interactions
The protocols outlined in this guide represent current best practice, but the field continues to evolve rapidly. Surveyors committed to professional excellence should:
Actionable Next Steps
- Invest in essential equipment: Acquire portable PM2.5 monitors and VOC analyzers suitable for field deployment
- Develop technical competencies: Pursue training in air quality monitoring and data analysis
- Pilot integrated protocols: Implement these methods on upcoming projects to build experience
- Establish baseline data: Begin collecting air quality measurements in survey areas to establish temporal patterns
- Build collaborative networks: Connect with air quality specialists and interdisciplinary teams
- Stay informed: Monitor emerging research on wildfire emissions and ecological impacts
- Contribute to knowledge: Share experiences and lessons learned with the professional community
- Engage stakeholders: Communicate the importance of integrated assessment to clients and regulators
The convergence of wildfire impacts and biodiversity loss represents one of the defining environmental challenges of our time. With 143 million tons of organic compounds released annually[1][2] from wildland fires and 24,100 deaths per year[3][4] attributable to wildfire smoke pollution in the United States alone, the stakes could not be higher.
Ecology surveyors stand at the frontline of documenting and responding to these interconnected crises. By embracing integrated assessment protocols that quantify both atmospheric and ecological dimensions of wildfire impacts, the profession can deliver the comprehensive environmental intelligence that society urgently needs.
The journey toward fully integrated wildfire-biodiversity assessment has only just begun. The protocols presented here provide a solid foundation, but continued innovation, collaboration, and commitment to scientific rigor will drive future advances. As climate change intensifies fire regimes and biodiversity faces mounting pressures, the work of skilled ecology surveyors implementing these advanced protocols becomes ever more critical.
The future of biodiversity conservation depends on our ability to see the complete picture—including the invisible atmospheric dimensions that profoundly shape ecosystem health and resilience. By quantifying wildfire air pollutant emissions within biodiversity surveys, ecology professionals in 2026 are pioneering the integrated environmental assessment approaches that will define conservation practice for decades to come.
For those ready to implement these protocols, the path forward is clear: equip yourself with the necessary tools, develop the required competencies, and commit to the rigorous, comprehensive assessment that our planet's biodiversity deserves. The integration of air quality and biodiversity metrics represents not just better science—it represents better stewardship of the irreplaceable natural systems upon which all life depends.
References
[1] Fires Could Emit More Air Pollution Than Previously Estimated – https://www.acs.org/pressroom/presspacs/2025/december/fires-could-emit-more-air-pollution-than-previously-estimated.html
[2] sciencedaily – https://www.sciencedaily.com/releases/2026/01/260107012114.htm
[3] Study Ties Particle Pollution From Wildfire Smoke To 24100 Us Deaths Per Year – https://www.opb.org/article/2026/02/05/study-ties-particle-pollution-from-wildfire-smoke-to-24100-us-deaths-per-year/
[4] Wildfire Smoke Pollution Us Deaths Study – https://www.cbsnews.com/news/wildfire-smoke-pollution-us-deaths-study/
[5] Wildfire Emissions – https://ww2.arb.ca.gov/wildfire-emissions
[6] Air Quality – https://wildfiretaskforce.org/the-northern-california-region/air-quality/
[7] Research Database – https://nwfirescience.org/research-database?f%5B0%5D=publication_keywords%3A488&f%5B1%5D=publication_keywords%3A576&f%5B2%5D=publication_keywords%3A772&field_publication_topics_target_id=5990
