
{"cover":"Professional landscape format (1536x1024) hero image featuring bold text overlay 'Multi-Pressure Threat Surveys: Protocols for Ecologists' in extra large 72pt white sans-serif font with dark shadow and semi-transparent navy overlay box, positioned in upper third center. Background shows split-screen composition: left side displays ecologist in field gear examining diseased amphibian with scientific equipment, right side shows layered transparent data visualization screens with climate graphs, pollution heat maps, and disease spread models overlapping. Color palette: deep forest green, navy blue, amber warning accents, white text. High contrast, National Geographic editorial quality, scientific magazine cover aesthetic with subtle grid lines and data points integrated into background.","content":["Detailed landscape format (1536x1024) illustration showing three-dimensional Venn diagram with overlapping transparent spheres representing climate change (red-orange sphere with temperature graphs), disease pressure (green sphere with pathogen symbols), and pollution stress (gray-blue sphere with chemical formulas). Center intersection glows bright yellow showing synergistic effects. Background features faded field notes, data tables, and Bayesian probability equations. Foreground includes small wildlife silhouettes (frogs, birds, insects) positioned at sphere intersections. Clean scientific aesthetic with labeled axes, percentage indicators, and professional typography showing interaction coefficients.","Wide-angle landscape format (1536x1024) photograph of field ecologist team conducting multi-pressure survey in wetland habitat during golden hour. Foreground shows scientist kneeling with tablet displaying real-time data collection interface with multiple parameter inputs (temperature sensors, water quality probes, disease swab samples in labeled vials). Middle ground features survey transect markers with color-coded flags. Background shows diverse habitat with visible stress indicators: some yellowing vegetation, algal bloom in water, monitoring equipment stations. Professional documentary style with natural lighting, shallow depth of field focusing on data collection tools and methodology.","Detailed landscape format (1536x1024) infographic-style illustration showing step-by-step protocol workflow for multi-pressure threat assessment. Left side displays vertical timeline with numbered stages (1-6) connected by arrows: baseline survey, stressor identification, data collection, Bayesian modeling, interaction analysis, reporting. Each stage includes small icon and brief descriptor. Right side shows example outputs: correlation matrices, interaction plots, confidence interval graphs, and biodiversity net gain calculation tables. Center features large Bayesian network diagram with nodes and probability distributions. Color-coded by threat type: climate (orange), disease (green), pollution (blue). Professional technical manual aesthetic with clean lines and scientific precision."]
}
Wildlife populations worldwide face an unprecedented crisis in 2026—but the real danger isn't just climate change, disease, or pollution alone. New global analyses reveal that interacting threats accelerate species declines far beyond what single-factor models predict, leaving ecologists and conservation professionals scrambling to develop accurate assessment methods. For biodiversity surveyors working on net gain projects, understanding these synergistic effects has become essential for producing reliable baseline data and meaningful conservation outcomes.
The challenge is clear: traditional ecological surveys measure individual stressors in isolation, missing the complex interactions that drive real-world population crashes. Multi-Pressure Threat Synergies: Protocols for Ecologists Quantifying Interacting Climate, Disease, and Pollution Declines represents a paradigm shift in how professionals approach biodiversity assessment, offering systematic methods to disentangle these interconnected effects using advanced statistical approaches.
Key Takeaways
- 🔬 Interacting threats create synergistic effects that accelerate wildlife declines 2-5 times faster than single stressors alone
- 📊 Bayesian statistical models provide the most robust framework for quantifying multi-pressure interactions in field surveys
- 🌍 Climate-disease-pollution interactions represent the most common and devastating threat combinations facing ecosystems in 2026
- 📋 Standardized protocols enable ecologists to collect compatible data across sites, improving regional and global assessments
- ✅ Accurate multi-pressure assessments are becoming essential for biodiversity net gain reporting and regulatory compliance
Understanding Multi-Pressure Threat Interactions in Ecological Systems
The concept of multiple interacting stressors fundamentally challenges how ecologists have traditionally approached conservation assessments. While single-threat models dominated ecological research for decades, mounting evidence shows that real-world population declines rarely result from isolated factors [2].
The Synergy Problem
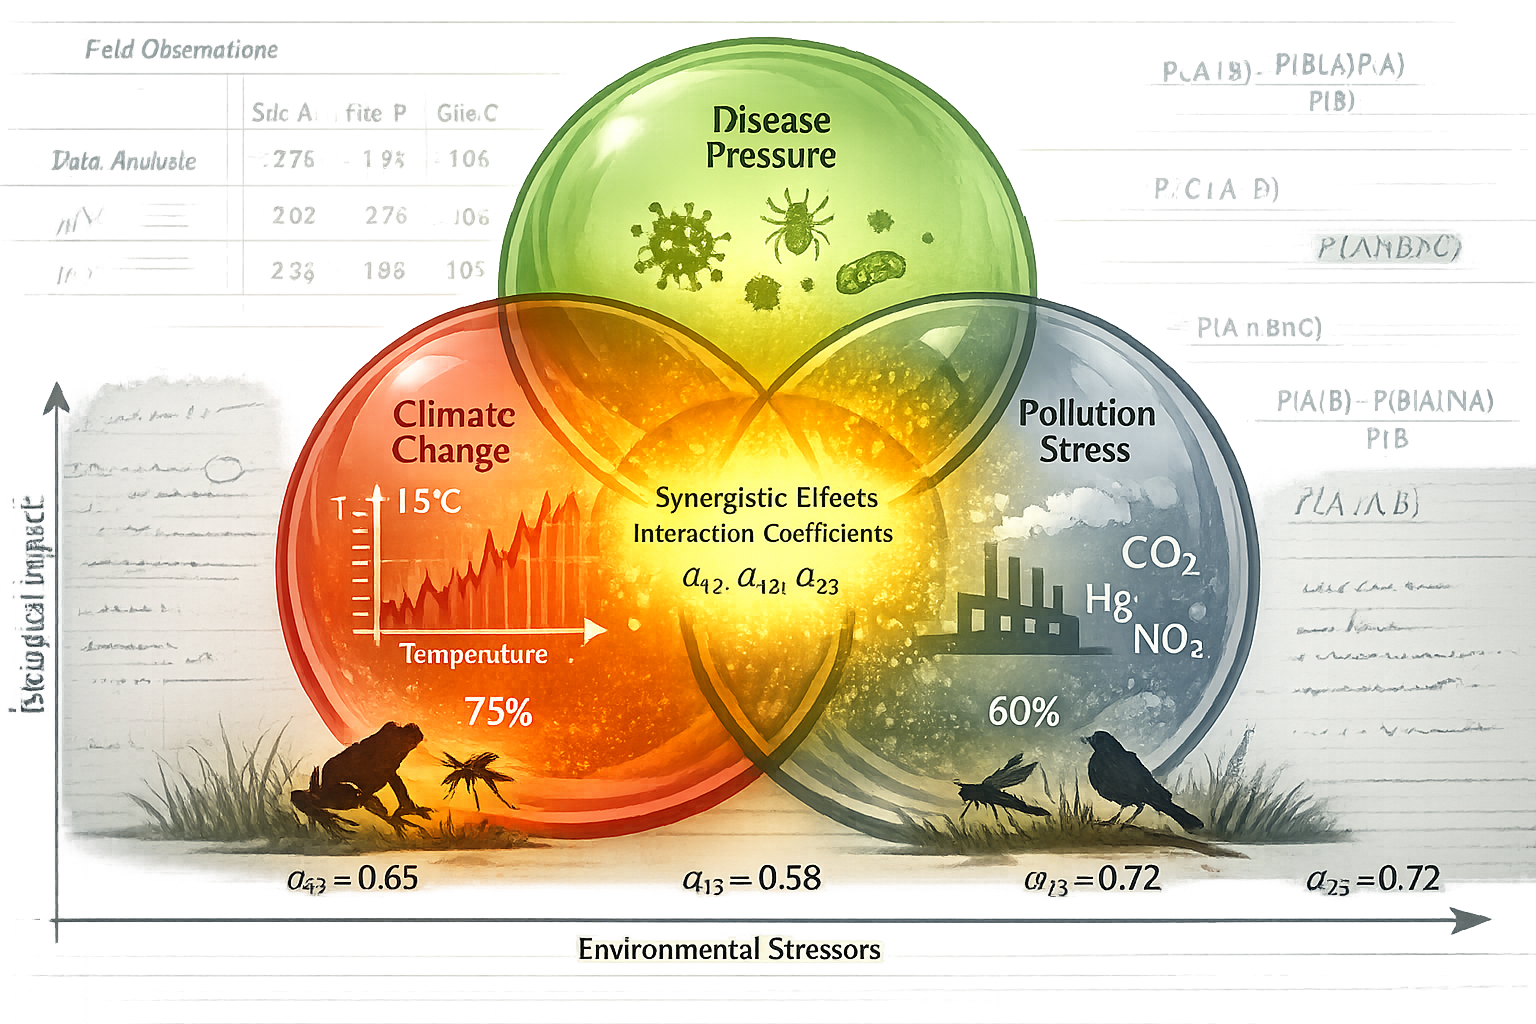
When climate change, infectious disease, and pollution converge on a population, their combined impact typically exceeds the sum of their individual effects. This phenomenon, called synergistic interaction, occurs through several mechanisms:
- Physiological stress amplification: Heat stress weakens immune systems, making organisms more susceptible to pathogens
- Habitat quality degradation: Pollution reduces food availability while climate shifts force species into suboptimal ranges
- Behavioral disruption: Multiple stressors interfere with breeding, foraging, and predator avoidance simultaneously
- Recovery prevention: Overlapping pressures eliminate refuge habitats where populations might otherwise rebound
For professionals conducting biodiversity impact assessments, these interactions create significant measurement challenges. A population decline attributed solely to habitat loss might actually result from habitat loss plus pesticide exposure plus emerging disease—with each factor amplifying the others.
Why Traditional Surveys Fall Short
Conventional ecological survey protocols typically:
- Measure single variables in isolation (temperature, pathogen prevalence, contaminant levels)
- Assume linear relationships between stressor intensity and population response
- Ignore temporal dynamics of how threats accumulate and interact over time
- Lack statistical power to detect interaction effects among three or more factors
This approach creates systematic underestimation of threat severity, leading to inadequate conservation interventions and inaccurate baseline data for biodiversity net gain projects.
Core Components of Multi-Pressure Threat Surveys: Protocols for Ecologists
Implementing effective Multi-Pressure Threat Surveys: Protocols for Ecologists Quantifying Interacting Climate, Disease, and Pollution Declines requires systematic integration of multiple data streams and analytical approaches. The following framework provides the foundation for comprehensive multi-stressor assessment.
Essential Survey Components
1. Hierarchical Sampling Design
Multi-pressure surveys must capture variation at multiple spatial and temporal scales:
| Scale Level | Sampling Focus | Typical Frequency | Key Measurements |
|---|---|---|---|
| Landscape | Regional threat gradients | Annual | Climate zones, land use patterns, pollution sources |
| Site | Local habitat conditions | Seasonal | Microclimate, disease prevalence, contaminant levels |
| Individual | Organism health status | Monthly | Body condition, pathogen load, tissue contamination |
| Population | Demographic parameters | Continuous | Survival rates, reproduction, recruitment |
This hierarchical structure enables ecologists to link individual-level stress responses to population-level outcomes while accounting for environmental context.
2. Integrated Threat Measurements
Comprehensive protocols measure all three major threat categories simultaneously:
Climate Stressors:
- Temperature extremes and variability
- Precipitation patterns and drought indices
- Phenological mismatches
- Microhabitat thermal profiles
Disease Pressures:
- Pathogen prevalence and diversity
- Infection intensity and co-infection rates
- Vector abundance and distribution
- Host immune function markers
Pollution Indicators:
- Heavy metal concentrations in tissues
- Pesticide residues and metabolites
- Endocrine-disrupting compounds
- Microplastic accumulation
- Nutrient loading effects
3. Biological Response Variables
Effective surveys track multiple response indicators across biological organization levels:
- Physiological: Stress hormone levels, metabolic rates, immune markers
- Behavioral: Activity patterns, foraging efficiency, reproductive behavior
- Individual: Growth rates, body condition, survival probability
- Population: Abundance trends, age structure, genetic diversity
Data Collection Protocols
Field Sampling Standards for multi-pressure assessments include:
✅ Standardized timing: Coordinate sampling across threat types within narrow time windows
✅ Quality controls: Use certified reference materials for contamination analyses
✅ Metadata documentation: Record environmental conditions during all sampling events
✅ Replication requirements: Minimum 30 individuals per site for robust statistical power
✅ Non-invasive methods: Prioritize techniques that minimize additional stress to study organisms
These protocols align with emerging requirements for comprehensive biodiversity assessments in development contexts.
Bayesian Statistical Approaches for Quantifying Threat Interactions
The analytical heart of Multi-Pressure Threat Surveys: Protocols for Ecologists Quantifying Interacting Climate, Disease, and Pollution Declines lies in sophisticated statistical modeling that can disentangle complex cause-effect relationships from observational data.
Why Bayesian Methods?
Traditional frequentist statistics struggle with multi-stressor data because they:
- Require large sample sizes that are impractical for many threatened species
- Cannot easily incorporate prior knowledge from related systems
- Provide limited inference about interaction mechanisms
- Offer poor performance with missing data and unbalanced designs
Bayesian hierarchical models overcome these limitations by:
🔹 Integrating multiple data sources: Combining field observations, experimental results, and expert knowledge
🔹 Quantifying uncertainty: Providing probability distributions for all parameter estimates
🔹 Handling complexity: Modeling non-linear relationships and higher-order interactions
🔹 Enabling prediction: Forecasting population responses under different threat scenarios
Key Modeling Frameworks
State-Space Models
These models separate observation processes (what ecologists measure) from biological processes (what actually happens to populations), accounting for measurement error and incomplete detection.
Structure:
- Process model: Describes true population dynamics under multiple stressors
- Observation model: Links field measurements to underlying biological states
- Parameter model: Estimates threat effects and their interactions
Interaction Term Specification
Quantifying synergistic effects requires careful model formulation:
Additive effects only:
Population decline = β₁(Climate) + β₂(Disease) + β₃(Pollution)
With two-way interactions:
Population decline = β₁(Climate) + β₂(Disease) + β₃(Pollution) + β₄(Climate×Disease) + β₅(Climate×Pollution) + β₆(Disease×Pollution)
With three-way interaction:
Population decline = ... + β₇(Climate×Disease×Pollution)
The three-way interaction term (β₇) captures whether the combined effect of all three stressors differs from what would be expected based on their pairwise interactions alone.
Model Selection and Validation
Ecologists must compare competing models to identify which interaction terms are supported by data:
- Information criteria: Use WAIC (Widely Applicable Information Criterion) or LOO (Leave-One-Out cross-validation) to balance model fit and complexity
- Posterior predictive checks: Verify that models generate realistic predictions
- Sensitivity analysis: Test how results change under different prior specifications
- External validation: Compare predictions to independent datasets when available
Practical Implementation
Several software tools facilitate Bayesian multi-stressor analysis:
- R packages:
brms,rstan,JAGS,nimble - Python libraries:
PyMC3,TensorFlow Probability - Specialized tools:
BUGS,OpenBUGS
For ecologists new to Bayesian methods, brms provides the most accessible entry point, offering intuitive syntax similar to standard regression models while handling complex hierarchical structures.
Field Implementation: From Protocol Design to Data Collection
Translating Multi-Pressure Threat Surveys: Protocols for Ecologists Quantifying Interacting Climate, Disease, and Pollution Declines from theory to practice requires careful planning and systematic execution.
Pre-Survey Planning Phase
Step 1: Threat Prioritization
Not all sites face identical stressor combinations. Initial reconnaissance should identify:
- Which of the three major threat categories (climate, disease, pollution) are present
- Relative intensity of each stressor based on preliminary data
- Potential interaction pathways based on species biology
- Logistical constraints on sampling frequency and methods
Step 2: Resource Allocation
Multi-pressure surveys demand significant investment in:
- Personnel: Field teams with diverse expertise (ecology, disease ecology, toxicology)
- Equipment: Environmental sensors, disease diagnostic tools, contamination analysis instruments
- Laboratory capacity: Pathogen identification, chemical analysis, genetic screening
- Analytical support: Statistical expertise for Bayesian modeling
For organizations working on biodiversity net gain projects, these requirements represent a substantial expansion beyond traditional habitat surveys.
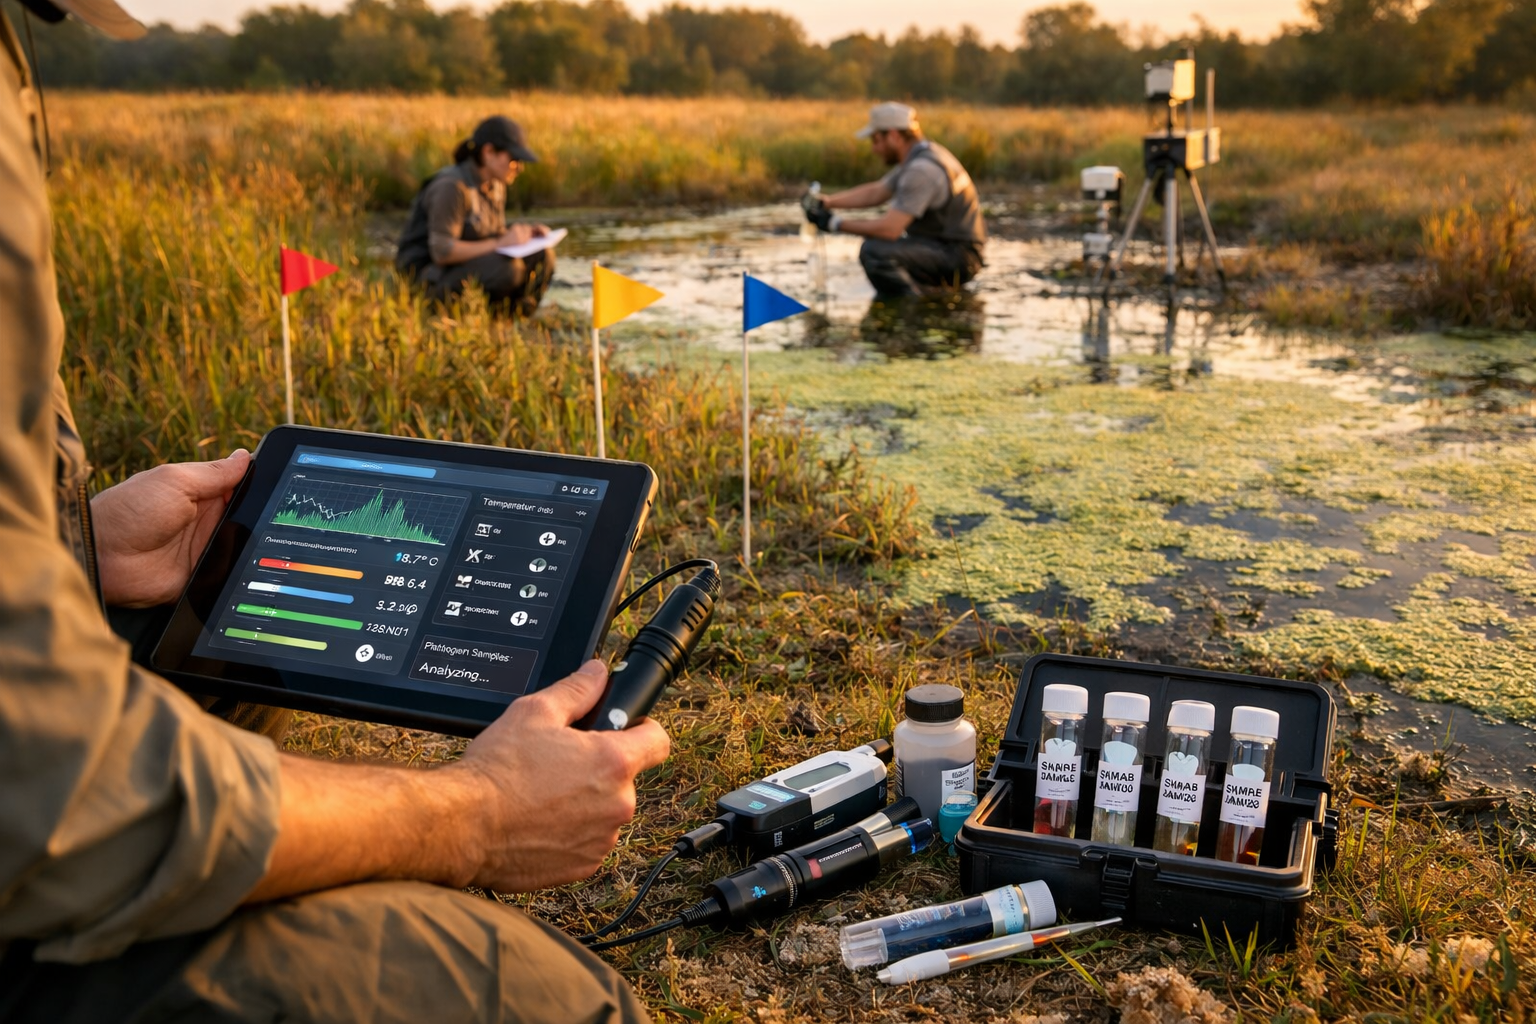
Field Execution Best Practices
Coordinated Sampling Events
Synchronize measurements across threat types to capture true interaction effects:
- Collect climate data (temperature, humidity) during organism sampling
- Obtain disease samples (swabs, blood) simultaneously with pollution samples (tissue, water)
- Record behavioral observations during all sampling events
- Document habitat conditions at each sampling point
Quality Assurance Protocols
Implement rigorous QA/QC procedures:
✅ Calibration: Verify instrument accuracy before each field session
✅ Blanks and controls: Include field blanks for contamination analyses
✅ Duplicate samples: Collect 10% duplicates for precision assessment
✅ Chain of custody: Maintain detailed sample tracking from field to laboratory
✅ Data validation: Check for outliers and inconsistencies during data entry
Adaptive Monitoring
Multi-pressure surveys benefit from adaptive management approaches:
- Review preliminary results after initial sampling rounds
- Adjust sampling intensity based on observed threat patterns
- Focus resources on sites showing strongest interaction signals
- Modify protocols if new stressors emerge during study period
Data Management and Documentation
Comprehensive metadata documentation is essential for multi-stressor studies:
Required documentation includes:
- Exact sampling locations (GPS coordinates with accuracy estimates)
- Environmental conditions during sampling (weather, time of day, recent disturbances)
- Observer identities and experience levels
- Equipment specifications and settings
- Laboratory methods and detection limits
- Any deviations from standard protocols
This level of documentation supports data integration across projects and enables meta-analyses that advance understanding of threat interactions at broader scales.
Applications to Biodiversity Net Gain and Conservation Planning
The insights generated through Multi-Pressure Threat Surveys: Protocols for Ecologists Quantifying Interacting Climate, Disease, and Pollution Declines have immediate practical applications for conservation practitioners and development professionals in 2026.
Improving Baseline Assessments
Traditional biodiversity baseline surveys often underestimate threats by measuring habitat quality without assessing stressor interactions. Multi-pressure protocols provide:
- More accurate population viability estimates: Accounting for synergistic threats improves predictions of long-term persistence
- Better identification of vulnerable populations: Detecting multiple stressors reveals which populations face highest extinction risk
- Refined habitat quality metrics: Incorporating stressor interactions produces more realistic habitat suitability scores
For professionals conducting biodiversity impact assessments for developers, these improvements translate to more defensible baseline data and more accurate predictions of development impacts.
Informing Mitigation Strategies
Understanding threat interactions guides more effective conservation interventions:
Single-stressor mitigation might fail if other threats remain:
- Creating habitat corridors won't help populations decimated by disease and pollution
- Reducing pollution may have limited benefit if climate stress and pathogens persist
Multi-pressure mitigation strategies address interaction pathways:
- Prioritize actions that break synergistic cycles (e.g., reducing pollution to improve disease resistance)
- Design interventions that buffer multiple stressors simultaneously (e.g., riparian restoration that provides thermal refugia and filters contaminants)
- Sequence actions to address most limiting factors first
Enhancing Net Gain Calculations
Current biodiversity net gain methodologies typically assess habitat quantity and quality without explicit consideration of multiple interacting threats. Integrating multi-pressure assessments:
- Adjusts habitat quality scores based on stressor interactions present
- Improves predictions of whether created or restored habitats will support target species
- Identifies sites where multiple stressors prevent successful compensation
- Guides selection of off-site biodiversity units in areas with lower threat interactions
Regional Conservation Planning
Multi-pressure threat data enables landscape-scale prioritization:
🗺️ Threat mapping: Identify hotspots where multiple stressors converge
🗺️ Corridor design: Route connectivity networks through areas with lower cumulative threats
🗺️ Protected area selection: Prioritize sites that buffer populations from multiple stressors
🗺️ Climate adaptation: Identify refugia where threat interactions remain manageable under future scenarios
Challenges and Future Directions
Despite their value, Multi-Pressure Threat Surveys: Protocols for Ecologists Quantifying Interacting Climate, Disease, and Pollution Declines face several implementation challenges in 2026.
Current Limitations
Technical Barriers:
- High cost of comprehensive sampling across multiple threat categories
- Limited availability of ecologists trained in both field methods and Bayesian statistics
- Lack of standardized protocols for many taxa and ecosystems
- Insufficient laboratory infrastructure in many regions
Analytical Challenges:
- Distinguishing correlation from causation in observational data
- Determining appropriate spatial and temporal scales for different stressor types
- Handling missing data when some threat measurements are unavailable
- Validating models with limited experimental data on interaction mechanisms
Institutional Obstacles:
- Regulatory frameworks that still focus on single-stressor assessments
- Funding structures that don't support long-term, multi-disciplinary monitoring
- Limited data sharing across projects and organizations
- Resistance to adopting complex analytical methods
Emerging Solutions
The ecological community is actively addressing these challenges through:
Methodological Advances:
- Development of rapid assessment tools for multi-stressor screening
- Machine learning approaches to predict threat interactions from limited data
- Citizen science protocols that expand spatial coverage cost-effectively
- Remote sensing integration to supplement field measurements
Capacity Building:
- Training programs in Bayesian statistics for ecologists
- Standardized protocols through professional societies and government agencies
- Open-source software tools with user-friendly interfaces
- Collaborative networks that share expertise and resources
Policy Evolution:
- Updated regulatory guidance incorporating multi-stressor considerations [1]
- Funding programs specifically supporting integrated threat assessments
- Data repositories facilitating cross-project synthesis
- Recognition of multi-pressure approaches in biodiversity net gain frameworks
Research Priorities for 2026-2030
Key areas requiring further development include:
- Mechanistic understanding: Experimental studies elucidating how specific stressor combinations interact
- Threshold identification: Determining critical levels where interactions shift from additive to synergistic
- Temporal dynamics: Characterizing how threat interactions change seasonally and across years
- Recovery potential: Assessing whether populations can rebound when stressors are reduced
- Taxonomic breadth: Extending protocols to understudied groups beyond vertebrates
Conclusion
Multi-Pressure Threat Surveys: Protocols for Ecologists Quantifying Interacting Climate, Disease, and Pollution Declines represent an essential evolution in how ecological professionals assess and respond to biodiversity loss in 2026. As global analyses increasingly demonstrate that interacting threats drive population declines far beyond what single-factor models predict, the need for comprehensive, statistically rigorous assessment methods has never been more urgent.
For biodiversity surveyors, conservation practitioners, and development professionals, adopting multi-pressure protocols offers several critical advantages:
✅ More accurate baseline data that reflects real-world threat complexity
✅ Better predictions of population viability and conservation outcomes
✅ More effective mitigation strategies that address interaction pathways
✅ Improved regulatory compliance as frameworks evolve to recognize multiple stressors
✅ Greater credibility in biodiversity net gain reporting and conservation planning
Actionable Next Steps
Organizations and professionals looking to implement multi-pressure threat assessments should:
- Invest in training: Build capacity in Bayesian statistical methods and integrated field protocols
- Start small: Pilot multi-pressure approaches on a subset of projects before full-scale implementation
- Collaborate: Partner with specialists in disease ecology, toxicology, and climate science
- Advocate: Encourage regulatory agencies to recognize multi-stressor approaches in biodiversity net gain requirements
- Share data: Contribute to collaborative databases that advance understanding of threat interactions
- Engage stakeholders: Educate clients and decision-makers about why multi-pressure assessments provide more reliable information
The transition from single-stressor to multi-pressure assessment frameworks requires significant effort, but the payoff—more effective conservation outcomes and more sustainable development—makes this investment essential. As climate change, emerging diseases, and pollution continue to interact in complex ways, ecological professionals who master these protocols will be best positioned to deliver meaningful biodiversity gains in an increasingly challenging world.
For support in implementing comprehensive biodiversity assessments that account for multiple interacting threats, contact biodiversity specialists who can guide your organization through this critical transition.
References
[1] Multirisk2026 – https://www.ioer.de/en/events/multirisk2026
[2] Conl – https://conbio.onlinelibrary.wiley.com/doi/10.1111/conl.12435
[3] International Ai Safety Report 2026 – https://internationalaisafetyreport.org/publication/international-ai-safety-report-2026
