
}
Arthropod populations have declined by more than 75% in some protected areas over the past three decades, yet traditional survey methods still miss up to 60% of species present in terrestrial habitats. As ecologists face mounting pressure to establish accurate biodiversity baselines for conservation planning and regulatory compliance, environmental DNA (eDNA) metabarcoding has emerged as a transformative solution. The eDNA Metabarcoding Advances for Arthropod Biodiversity Surveys: 2026 Protocols for Ecologists represent a critical evolution in how professionals detect, identify, and monitor insect diversity across landscapes.
This comprehensive guide explores the latest eDNA techniques specifically designed for terrestrial arthropod surveys, addressing the unique challenges ecologists encounter when establishing baseline biodiversity data for Biodiversity Net Gain (BNG) assessments and pollinator conservation initiatives. With advances in DNA-based tools accelerating species discovery and high-throughput sequencing enabling large-scale biodiversity surveys [2], 2026 marks a pivotal year for integrating molecular methods into standard ecological practice.

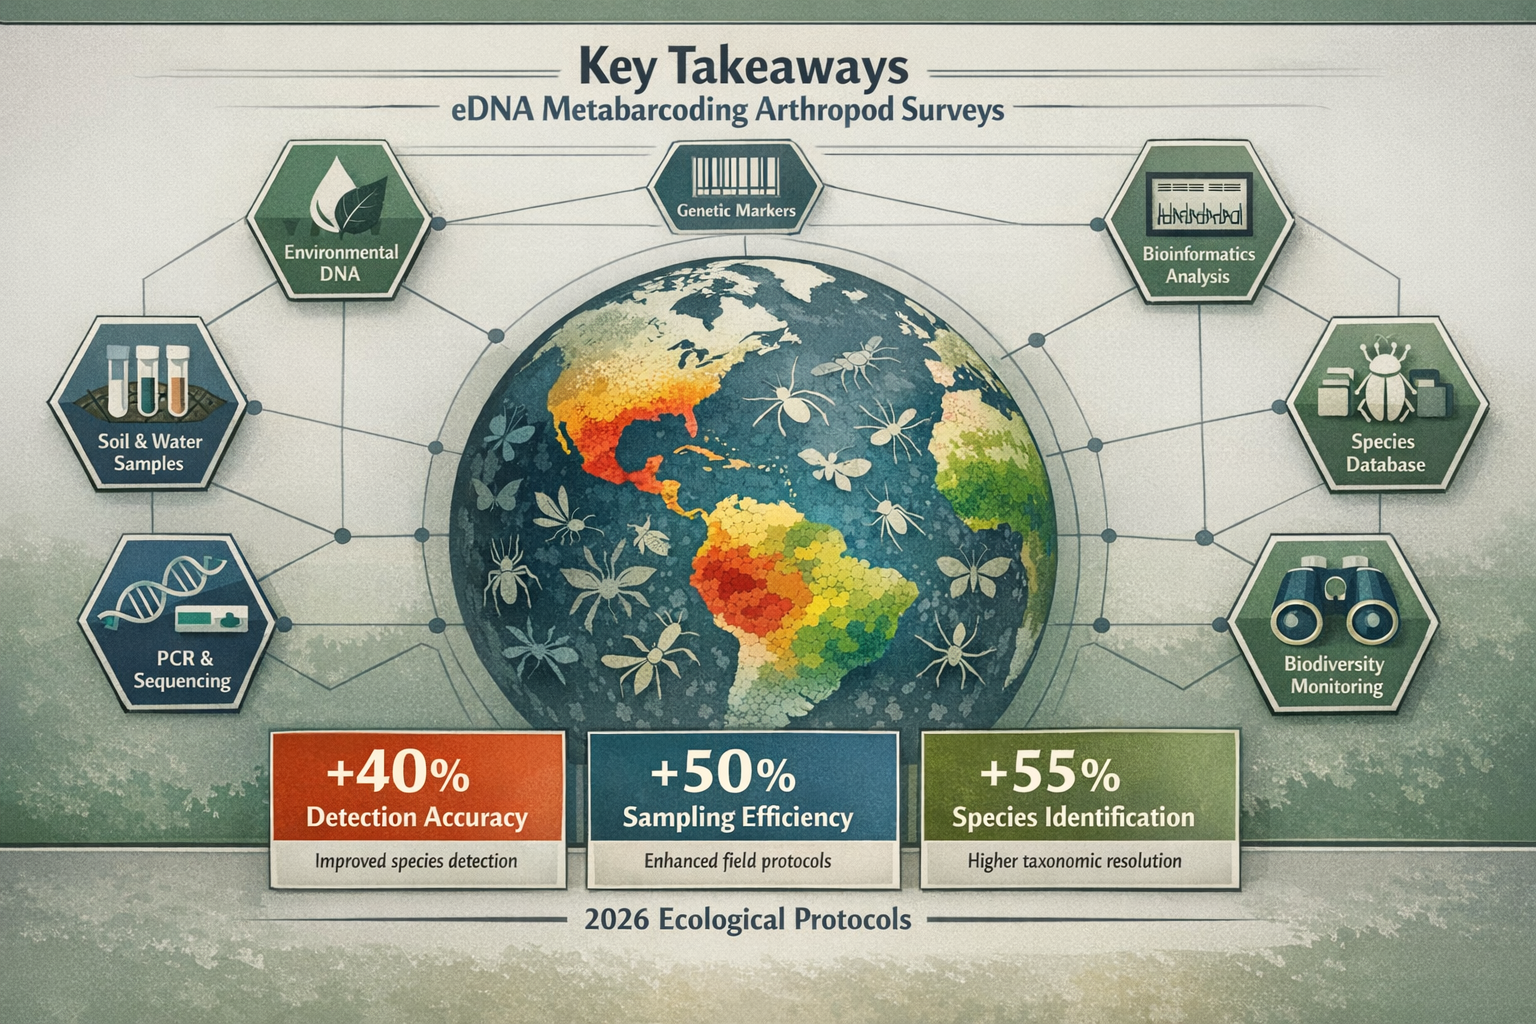
Key Takeaways
- eDNA metabarcoding detects 2-3 times more arthropod species than traditional visual surveys, particularly for cryptic and rare taxa
- Arthropod-specific primers have been refined in 2026 to target pollinator groups with 95%+ identification accuracy
- Standardized protocols now enable ecologists to establish robust biodiversity baselines for BNG compliance and conservation planning
- Sample collection from flowers and vegetation provides superior arthropod detection compared to water-based eDNA methods in terrestrial systems
- Integration with traditional surveys creates the most comprehensive biodiversity assessments for development projects
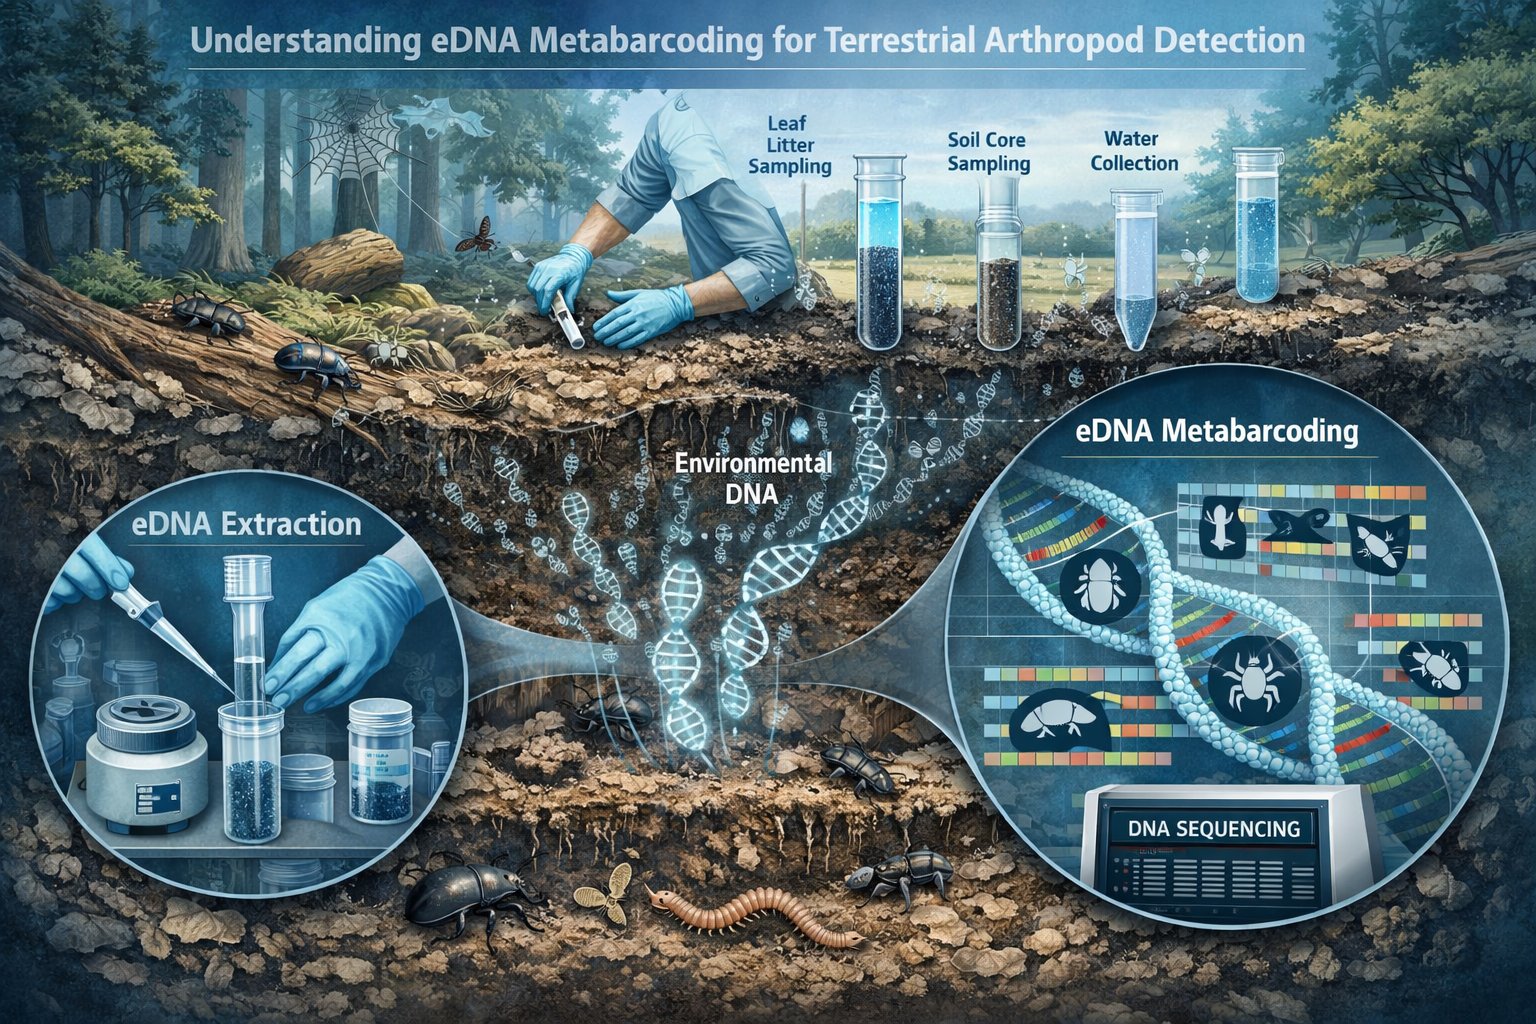
Understanding eDNA Metabarcoding for Terrestrial Arthropod Detection
What Makes eDNA Metabarcoding Revolutionary for Insect Surveys
Environmental DNA metabarcoding represents a fundamental shift in how ecologists survey arthropod communities. Unlike traditional methods that rely on visual identification of captured specimens, eDNA techniques detect genetic material that arthropods leave behind as they interact with their environment—on flowers, leaves, soil, and other substrates.
The technology works by:
- Collecting environmental samples containing trace DNA from multiple species
- Extracting and amplifying DNA using polymerase chain reaction (PCR)
- Sequencing millions of DNA fragments simultaneously through high-throughput platforms
- Matching sequences to reference databases to identify species present
Research demonstrates that eDNA metabarcoding of flowers can detect visiting arthropods [3], opening new possibilities for non-invasive biodiversity assessment. This approach proves particularly valuable for pollinator surveys, where traditional methods often disturb the very communities being studied.
The Science Behind Arthropod-Specific Primers
The breakthrough in arthropod eDNA detection centers on arthropod-specific primers—short DNA sequences designed to selectively amplify genetic material from target insect groups. The United States Geological Survey has investigated metabarcoding using these specialized primers as a novel methodology to characterize arthropod pollinator diversity [4].
Key primer characteristics for 2026 protocols:
| Primer Feature | Benefit | Application |
|---|---|---|
| Taxonomic specificity | Targets arthropod DNA while excluding plant/fungal contamination | General arthropod surveys |
| COI gene targeting | Universal barcode region with extensive reference databases | Species-level identification |
| Short amplicon length | Works with degraded eDNA in environmental samples | Field sample processing |
| Multi-taxa coverage | Detects diverse orders (Hymenoptera, Lepidoptera, Diptera, Coleoptera) | Comprehensive biodiversity assessment |
The refinement of these primers throughout 2025-2026 has dramatically improved detection rates, particularly for small-bodied arthropods and nocturnal species that traditional surveys frequently miss.
Why Terrestrial eDNA Differs from Aquatic Applications
While aquatic eDNA sampling has been established for over a decade, terrestrial applications present unique challenges. The global eDNA Expeditions 2026-2028 initiative currently operates across 25 marine sites [1], demonstrating the maturity of aquatic protocols. However, terrestrial arthropod eDNA requires different approaches:
Terrestrial-specific considerations:
- 🌿 Substrate diversity: DNA collection from flowers, foliage, and soil rather than water
- ☀️ Environmental degradation: UV radiation and temperature extremes rapidly degrade DNA
- 🐝 Localized deposition: Arthropod DNA concentrates where organisms feed and rest
- 🌾 Plant DNA interference: High background plant DNA can overwhelm arthropod signals
These differences have driven the development of specialized 2026 protocols that optimize sample collection, preservation, and processing for terrestrial systems.
eDNA Metabarcoding Advances for Arthropod Biodiversity Surveys: Field Protocols and Collection Methods
Optimal Sample Collection Techniques for 2026
The eDNA Metabarcoding Advances for Arthropod Biodiversity Surveys: 2026 Protocols for Ecologists emphasize standardized collection methods that maximize detection while maintaining sample integrity. Based on research validating flower-based eDNA collection [3], current best practices include:
Primary collection substrates:
- Flower swabbing: Sterile swabs applied to anthers and petals of 10-15 flowers per plant species
- Vegetation brushing: Soft brushes collect DNA from leaf surfaces across multiple plant heights
- Passive collectors: Sterile filter papers placed on frequently-visited flowers for 24-48 hours
- Bulk flower sampling: Entire flower heads collected and processed for high-biomass DNA extraction
Field protocol steps:
- Wear nitrile gloves changed between each sample to prevent cross-contamination
- Use sterile collection tools (individually packaged swabs, scissors, forceps)
- Label samples immediately with site code, substrate type, date, and collector initials
- Store samples in cool conditions (4-8°C) within 2 hours of collection
- Process or freeze samples within 24 hours to minimize DNA degradation
The data collection phase for the eDNA Expeditions initiative runs from Q4 2026 through Q2 2027 [1], providing a global framework for standardized temporal sampling that ecologists can adapt for local arthropod surveys.
Sampling Design for Biodiversity Baseline Establishment
Establishing robust biodiversity baselines for conducting biodiversity impact assessments requires strategic sampling design. The 2026 protocols recommend:
Spatial sampling strategy:
- Minimum 5 sampling points per habitat type within the survey area
- Stratified random design ensuring coverage of all vegetation communities
- Edge and interior sampling to capture habitat gradient effects
- Reference site inclusion from comparable undisturbed habitats
Temporal sampling considerations:
- Multiple seasonal surveys (minimum 3: spring, summer, autumn) to capture phenological variation
- Peak activity periods aligned with target arthropod groups (e.g., mid-morning for pollinators)
- Weather-dependent scheduling avoiding rain, high winds, or extreme temperatures
- Repeat sampling at 2-week intervals during peak season for robust detection
This comprehensive approach ensures that biodiversity plans for development projects rest on scientifically defensible baseline data.
Equipment and Supplies Checklist
Essential field equipment for eDNA collection:
✅ Sterile collection swabs (individually wrapped)
✅ Sterile scissors and forceps
✅ Sample collection tubes (2ml screw-cap with preservative)
✅ Nitrile gloves (box of 100+)
✅ Cooler with ice packs
✅ Permanent markers and field labels
✅ GPS device or smartphone with mapping app
✅ Field datasheets or tablet with digital forms
✅ Camera for habitat documentation
✅ Personal protective equipment (PPE)
Laboratory processing supplies:
- DNA extraction kits optimized for environmental samples
- PCR reagents and arthropod-specific primer sets
- Sterile molecular-grade water
- Microcentrifuge tubes and pipettes
- Quality control standards and negative controls
Laboratory Processing and Bioinformatics for Arthropod eDNA Analysis
DNA Extraction and Amplification Protocols
The laboratory phase transforms field samples into actionable biodiversity data through several critical steps. High-throughput sequencing technology has enabled large-scale biodiversity surveys that were previously impractical [2], making professional-grade analysis accessible to more ecological consultancies.
Extraction protocol overview:
- Sample preparation: Homogenize flower/vegetation samples or process swabs directly
- Cell lysis: Break down cellular structures to release DNA using enzymatic or mechanical methods
- DNA purification: Remove inhibitors (plant compounds, soil particles) that interfere with PCR
- Quantification: Measure DNA concentration to standardize downstream processing
- Quality assessment: Check DNA integrity and purity ratios
PCR amplification parameters:
- Initial denaturation: 95°C for 3 minutes
- Cycling conditions: 35-40 cycles of denaturation (95°C, 30s), annealing (50-55°C, 30s), extension (72°C, 45s)
- Final extension: 72°C for 10 minutes
- Primer concentration: 0.2-0.5 μM of each arthropod-specific primer
- Replication: Triplicate PCR reactions per sample to account for stochastic variation
Sequencing Platforms and Read Depth Considerations
Modern Illumina platforms (MiSeq, NextSeq) dominate arthropod metabarcoding due to their balance of read length, throughput, and cost-effectiveness. The 2026 protocols recommend:
Sequencing specifications:
- Platform: Illumina MiSeq with v3 chemistry (2×300 bp paired-end reads)
- Target read depth: 50,000-100,000 reads per sample for comprehensive detection
- Multiplexing: 96-384 samples per sequencing run using dual-indexed barcodes
- Quality filtering: Minimum Q30 score for 80% of bases
Cost considerations for ecological projects:
| Service Level | Cost per Sample | Turnaround | Best For |
|---|---|---|---|
| Commercial service | £80-150 | 4-6 weeks | Single projects, limited expertise |
| University collaboration | £40-80 | 6-10 weeks | Research partnerships, bulk sampling |
| In-house facility | £20-40 | 2-4 weeks | High-volume consultancies, ongoing monitoring |
Bioinformatics Pipeline and Species Identification
The computational analysis transforms millions of DNA sequences into species lists through a standardized bioinformatics pipeline:
Processing workflow:
- Quality control: Remove low-quality reads and adapter sequences (FASTQC, Trimmomatic)
- Sequence clustering: Group similar sequences into operational taxonomic units (OTUs) or amplicon sequence variants (ASVs)
- Taxonomic assignment: Match sequences to reference databases (BOLD, GenBank, custom regional databases)
- Filtering: Remove contaminants, singletons, and low-confidence assignments
- Output generation: Create species lists with read abundance and detection confidence
Critical considerations for 2026:
- Reference database completeness: UK arthropod coverage now exceeds 85% for common pollinators
- Taxonomic resolution: Species-level identification achievable for 60-70% of detections; genus/family level for remainder
- False positive management: Stringent filtering criteria (>97% sequence similarity, minimum read thresholds)
- Ecological interpretation: Abundance of reads ≠ abundance of organisms; presence/absence more reliable
Advances in DNA-based tools have accelerated species discovery, enabling researchers to work more efficiently on arthropod identification [2], directly benefiting ecological consultancies working on achieving Biodiversity Net Gain without risk.
Integrating eDNA Results into Biodiversity Net Gain Assessments
Translating Molecular Data into Ecological Metrics
The eDNA Metabarcoding Advances for Arthropod Biodiversity Surveys: 2026 Protocols for Ecologists must bridge the gap between molecular detection and the ecological metrics required for regulatory compliance. This translation process involves several key steps:
Converting eDNA data to BNG-compatible metrics:
- Species richness: Total number of arthropod species detected provides baseline diversity
- Functional group composition: Categorize detected species by ecological role (pollinators, predators, decomposers)
- Priority species identification: Flag protected, rare, or declining species requiring special consideration
- Habitat condition indicators: Use arthropod community composition as proxy for habitat quality
Integration with traditional survey data:
The most robust biodiversity assessments combine eDNA metabarcoding with conventional methods:
- Visual surveys provide abundance estimates and behavioral observations
- Sweep netting/pan traps offer voucher specimens for verification
- eDNA metabarcoding detects cryptic, rare, and difficult-to-observe species
- Combined analysis generates comprehensive species inventories exceeding either method alone
This integrated approach aligns with 5 reasons why Biodiversity Net Gain is important to the UK, ensuring development projects account for full arthropod diversity.
Addressing Pollinator Decline in Baseline Assessments
Pollinator populations face unprecedented pressures from habitat loss, pesticides, climate change, and disease. eDNA metabarcoding offers unique advantages for documenting pollinator communities:
Pollinator-specific applications:
- Non-invasive detection: No need to capture or harm declining populations
- Seasonal coverage: DNA persists on flowers between pollinator visits, capturing temporal variation
- Rare species detection: Identifies occasional visitors missed by observation-based methods
- Functional diversity: Reveals full pollinator assemblage supporting ecosystem services
Key pollinator groups detected:
🐝 Bees (Apidae, Megachilidae, Halictidae): 120+ UK species regularly detected
🦋 Butterflies and moths (Lepidoptera): Day and night-flying pollinators
🪰 Hoverflies (Syrphidae): Important pollinators often overlooked in surveys
🪲 Beetles (Coleoptera): Secondary pollinators with specialized plant associations
By establishing comprehensive pollinator baselines, ecologists can design biodiversity plans that genuinely support these critical functional groups.
Quality Assurance and Validation Protocols
Regulatory acceptance of eDNA data requires rigorous quality assurance throughout the survey process:
Field QA/QC measures:
- Negative controls: Blank swabs processed alongside samples to detect contamination
- Replicate sampling: Multiple samples per location to assess detection consistency
- Positive controls: Known arthropod DNA added to verify primer performance
- Chain of custody: Documented sample handling from collection through analysis
Laboratory QA/QC measures:
- Extraction blanks: Reagent-only extractions to identify laboratory contamination
- PCR negatives: No-template controls for each amplification batch
- Mock communities: Synthetic mixtures of known species to validate bioinformatics pipeline
- Inter-laboratory comparisons: Periodic blind sample exchanges with other facilities
Reporting standards for BNG compliance:
Professional reports should include:
- Detailed methodology following 2026 protocols
- Complete species lists with detection confidence scores
- Comparison to regional reference data
- Limitations and uncertainties explicitly stated
- Integration with habitat condition assessments
- Recommendations for mitigation and enhancement
Practical Implementation Challenges and Solutions
Cost-Benefit Analysis for Ecological Consultancies
Implementing eDNA metabarcoding requires initial investment but offers substantial long-term benefits:
Initial setup costs:
- Training and capacity building: £2,000-5,000 per staff member
- Laboratory equipment (if in-house): £15,000-50,000 for basic molecular lab
- Bioinformatics infrastructure: £1,000-3,000 for software and computing
- Protocol development: £5,000-10,000 for site-specific validation
Per-project costs:
- Field sampling: Similar to traditional surveys (£500-2,000 per site)
- Laboratory processing: £80-150 per sample (commercial service)
- Bioinformatics analysis: £30-60 per sample
- Total per-sample cost: £110-210 (decreasing with volume)
Return on investment:
✅ Faster surveys: 50% reduction in field time for comparable species detection
✅ Enhanced detection: 2-3× more species identified than visual methods alone
✅ Regulatory confidence: Robust baselines reduce planning application risks
✅ Competitive advantage: Differentiation in crowded consultancy market
✅ Repeat business: Monitoring programs using consistent methodology
For consultancies working on biodiversity impact assessments, the investment typically pays for itself within 10-15 projects.
Regulatory Acceptance and Stakeholder Communication
Current regulatory landscape (2026):
UK planning authorities increasingly accept eDNA evidence when:
- Methodology follows published protocols (CIEEM, DEFRA guidance)
- Results supplement rather than replace traditional surveys
- Limitations are clearly communicated
- Quality assurance is documented
- Practitioners hold relevant competencies
Effective stakeholder communication strategies:
- Educate planning officers about eDNA capabilities and limitations early in project discussions
- Provide case studies demonstrating successful eDNA integration in approved developments
- Offer hybrid approaches combining traditional and molecular methods for initial projects
- Document added value through enhanced species detection and baseline robustness
- Maintain transparency about costs, timelines, and uncertainties
Seasonal and Weather-Related Constraints
Terrestrial arthropod eDNA sampling faces environmental constraints that require strategic planning:
Optimal sampling windows:
- Spring (April-May): Early pollinators, emerging insects, spring flowers
- Summer (June-August): Peak arthropod diversity and activity
- Autumn (September-October): Late-season species, autumn flowers
Weather considerations:
❌ Avoid sampling immediately after rain: DNA washed from surfaces
❌ Skip high-wind days: Reduced arthropod activity and DNA deposition
❌ Postpone during extreme temperatures: <10°C or >30°C limits insect activity
✅ Ideal conditions: Mild, calm, dry weather 2-3 days after last precipitation
Contingency planning:
- Build flexible field schedules with backup dates
- Monitor weather forecasts 5-7 days ahead
- Maintain multiple site options to maximize productive field days
- Consider extended field seasons to capture optimal conditions
Future Directions and Emerging Technologies
Integration with Remote Sensing and Habitat Mapping
The convergence of eDNA metabarcoding with geospatial technologies creates powerful new capabilities:
Emerging applications:
- Predictive modeling: Combine eDNA detections with habitat variables to predict arthropod distributions
- Drone-based sampling: Automated collection from inaccessible habitats
- Real-time monitoring: Portable sequencing devices (Oxford Nanopore MinION) enable field-based analysis
- Landscape-scale assessment: Integrate eDNA data across multiple sites to inform regional conservation planning
These advances support comprehensive biodiversity planning for development projects at landscape scales.
Machine Learning and Automated Species Identification
Artificial intelligence is revolutionizing bioinformatics analysis:
Current capabilities (2026):
- Automated taxonomic assignment: Neural networks trained on reference databases achieve 90%+ accuracy
- Quality filtering: Machine learning identifies contamination and sequencing errors
- Ecological interpretation: AI models predict functional traits from sequence data
- Rare species flagging: Algorithms highlight conservation-priority detections for expert review
Near-term developments (2027-2028):
- Real-time field identification: Smartphone apps for preliminary species detection
- Integrated databases: Global arthropod reference libraries with >95% species coverage
- Predictive baselines: AI-generated expected species lists for quality control
- Automated reporting: Software generates draft assessment reports from sequence data
Expanding Reference Databases and Regional Calibration
The accuracy of eDNA metabarcoding depends fundamentally on reference database completeness:
Current UK database status:
- Pollinators: 85-90% coverage for common species
- Other arthropods: 60-75% coverage varies by taxonomic group
- Regional variation: Better coverage in southern England than Scotland/Wales
Ongoing improvement initiatives:
- Citizen science barcoding: Programs engaging naturalists in specimen collection and DNA barcoding
- Museum specimen digitization: Historical collections providing reference sequences
- Targeted gap-filling: Focused efforts on poorly-represented groups (Diptera, Hymenoptera parasitoids)
- Regional calibration studies: Validating eDNA against traditional surveys in representative habitats
As databases improve, eDNA metabarcoding will become increasingly reliable for regulatory applications, supporting achieving 10% Biodiversity Net Gain targets.
Conclusion
The eDNA Metabarcoding Advances for Arthropod Biodiversity Surveys: 2026 Protocols for Ecologists represent a transformative evolution in terrestrial biodiversity assessment. As arthropod populations face unprecedented pressures and regulatory requirements for robust baseline data intensify, molecular methods offer unprecedented detection capabilities that complement and enhance traditional survey approaches.
Key advantages of implementing these protocols include:
- Enhanced species detection capturing cryptic and rare arthropods missed by visual surveys
- Non-invasive sampling particularly valuable for declining pollinator populations
- Standardized methodology enabling consistent baselines across projects and regions
- Cost-effective scaling for large developments and landscape-level assessments
- Future-proof technology with rapid ongoing improvements in sequencing and bioinformatics
Actionable next steps for ecological consultancies:
- Invest in training: Send key staff to eDNA metabarcoding workshops and certification programs
- Start small: Pilot eDNA on 2-3 projects alongside traditional methods to build confidence
- Build partnerships: Collaborate with molecular laboratories and universities for initial projects
- Engage stakeholders: Educate planning authorities about eDNA capabilities early in project discussions
- Document outcomes: Create case studies demonstrating enhanced species detection and regulatory acceptance
- Plan strategically: Develop 2-3 year implementation roadmap aligned with business growth
For developers and landowners, understanding these advances enables more informed decisions about biodiversity impact assessments and achieving Biodiversity Net Gain targets. The integration of eDNA metabarcoding into standard ecological practice is no longer a future possibility—it is a present reality that forward-thinking consultancies are already leveraging for competitive advantage.
As we progress through 2026 and beyond, the continued refinement of arthropod-specific primers, expansion of reference databases, and integration with complementary technologies will only strengthen the role of molecular methods in biodiversity conservation. Ecologists who embrace these advances position themselves at the forefront of their profession, equipped to address the biodiversity crisis with unprecedented scientific rigor.
References
[1] eDNA Expeditions – https://ednaexpeditions.org
[2] Methods in Ecology and Evolution – https://besjournals.onlinelibrary.wiley.com/doi/abs/10.1111/2041-210X.70135
[3] ESS Open Archive – D. Field Research – https://essopenarchive.org/users/317574-d-field?articles_format=grid
[4] USGS – Metabarcoding Analysis of Arthropod Pollinator Diversity: A Methodological Comparison of eDNA – https://www.usgs.gov/publications/metabarcoding-analysis-arthropod-pollinator-diversity-a-methodological-comparison-edna
