
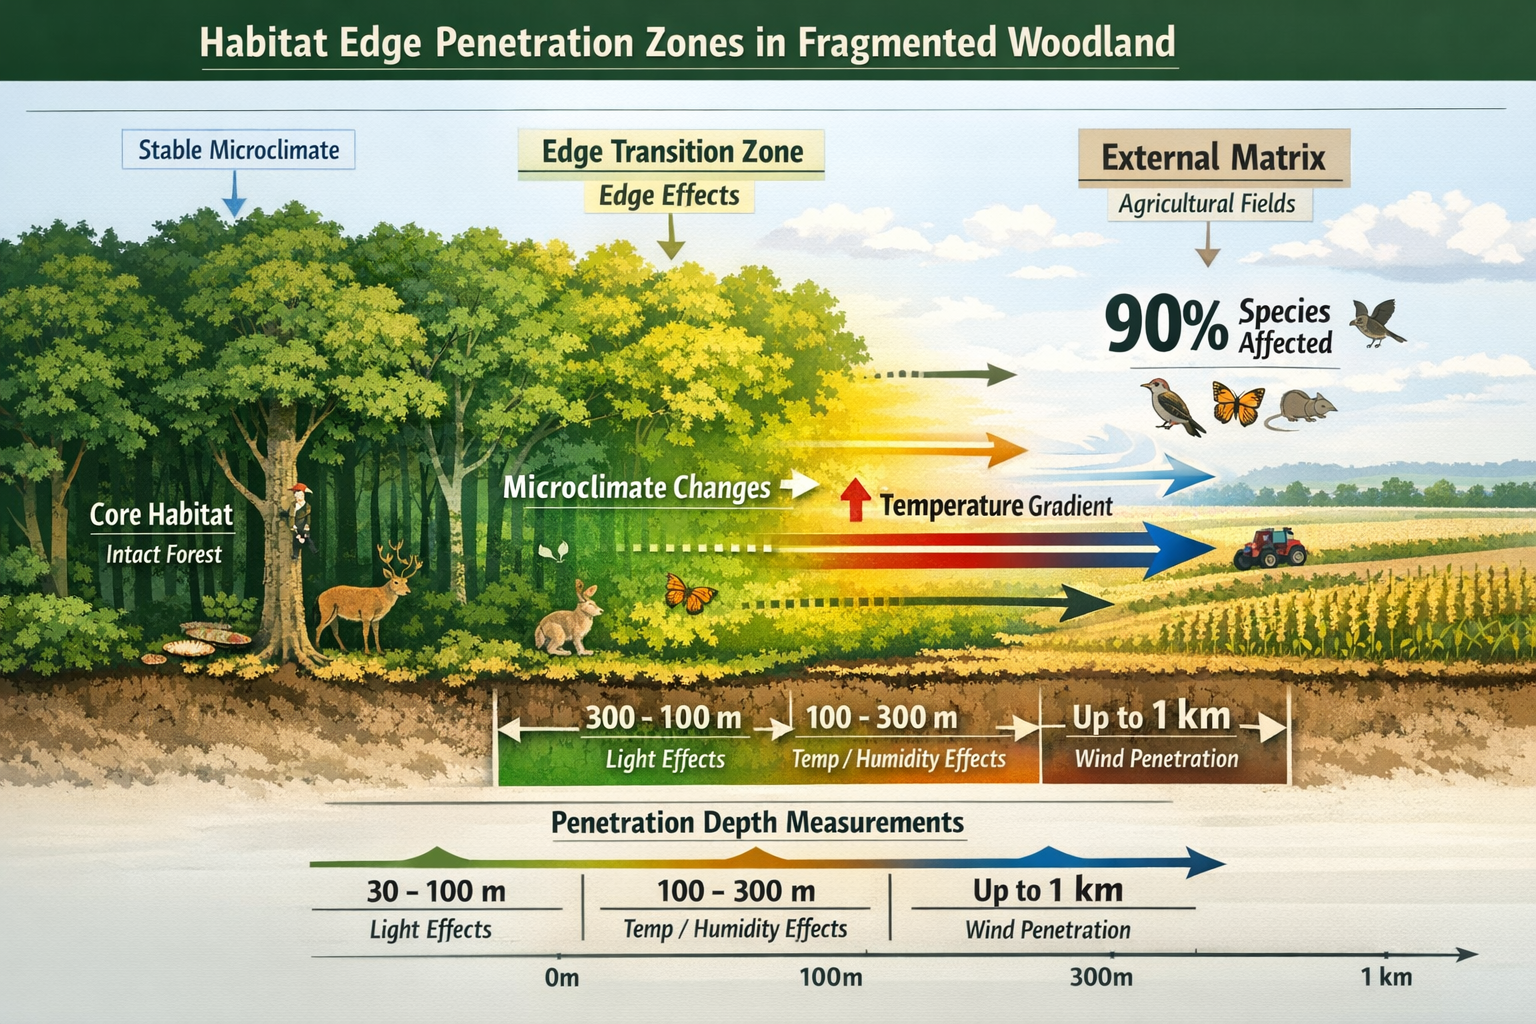
Research reveals that edge effects penetrate up to one kilometer into forest fragments, with approximately 90% of beetle species responding significantly to habitat boundaries[1]. As development pressure intensifies across the UK, understanding and mitigating these edge effects has become critical for achieving meaningful biodiversity net gain outcomes. The challenge for ecology surveyors in 2026 lies not just in measuring habitat loss, but in designing survey protocols that accurately capture the complex ecological dynamics occurring at habitat boundaries.
Edge Effect Mitigation in Fragmented Habitats: Advanced Survey Designs for 2026 Biodiversity Net Gain represents a fundamental shift in how ecological consultants approach urban development projects. Traditional survey methods often overlook the cascading impacts that occur when habitats are divided into smaller patches, leading to underestimated biodiversity losses and inadequate compensation strategies.
Key Takeaways
- Edge effects penetrate far deeper than previously understood, with impacts extending up to 1km into habitat fragments, requiring expanded survey buffer zones
- Stratified sampling protocols that measure biodiversity at multiple distances from habitat edges provide more accurate baseline assessments for BNG calculations
- Buffer zone design must account for microclimate changes, species-specific responses, and cumulative fragmentation impacts to achieve genuine net gain
- Advanced survey methodologies including gradient-based sampling and connectivity mapping are essential for urban BNG projects in 2026
- Fragmentation reduces biodiversity at multiple spatial scales[4], necessitating landscape-level assessment approaches rather than site-only evaluations
Understanding Edge Effects in Fragmented Habitats
Edge effects occur when the boundary between two distinct habitat types creates altered environmental conditions that differ from either habitat's interior. These boundary zones experience increased light penetration, wind exposure, temperature fluctuations, and altered humidity levels that fundamentally change the ecological character of the affected area.
Recent research has resolved a 50-year debate, confirming that fragmentation decreases biodiversity at multiple spatial scales[4]. This finding has profound implications for biodiversity net gain assessments, as it demonstrates that the total impact of development extends far beyond the physical footprint of construction.
The Penetration Distance Problem
The depth to which edge effects penetrate varies dramatically depending on:
- Habitat type (woodland, grassland, wetland)
- Surrounding land use (agricultural, urban, industrial)
- Edge contrast (abrupt vs. gradual transitions)
- Prevailing weather patterns (wind direction, sun exposure)
- Species sensitivity (specialist vs. generalist organisms)
Studies show that stronger fragmentation, characterized by higher edge density, correlates with weaker ecosystem resilience in both tropical and temperate forests[7]. This reduced resilience manifests as diminished cooling effects and increased local temperatures, creating feedback loops that further degrade habitat quality.
Impacts on Ecological Interactions 🦋
A large-scale replicated fragmentation experiment found that connectivity loss and edge-to-area ratio significantly alter multiple plant-arthropod interactions[2]. These disruptions cascade through food webs, affecting:
- Pollination services
- Seed dispersal mechanisms
- Predator-prey dynamics
- Decomposition processes
- Nutrient cycling
For ecology surveyors, this means that measuring species presence alone provides an incomplete picture. Functional relationships between species must also be assessed to understand true biodiversity value.
Advanced Survey Designs for Edge Effect Mitigation
Edge Effect Mitigation in Fragmented Habitats: Advanced Survey Designs for 2026 Biodiversity Net Gain requires a fundamental rethinking of standard ecological survey protocols. Traditional approaches that focus solely on habitat classification and species inventories within development boundaries fail to capture the spatial complexity of edge effects.
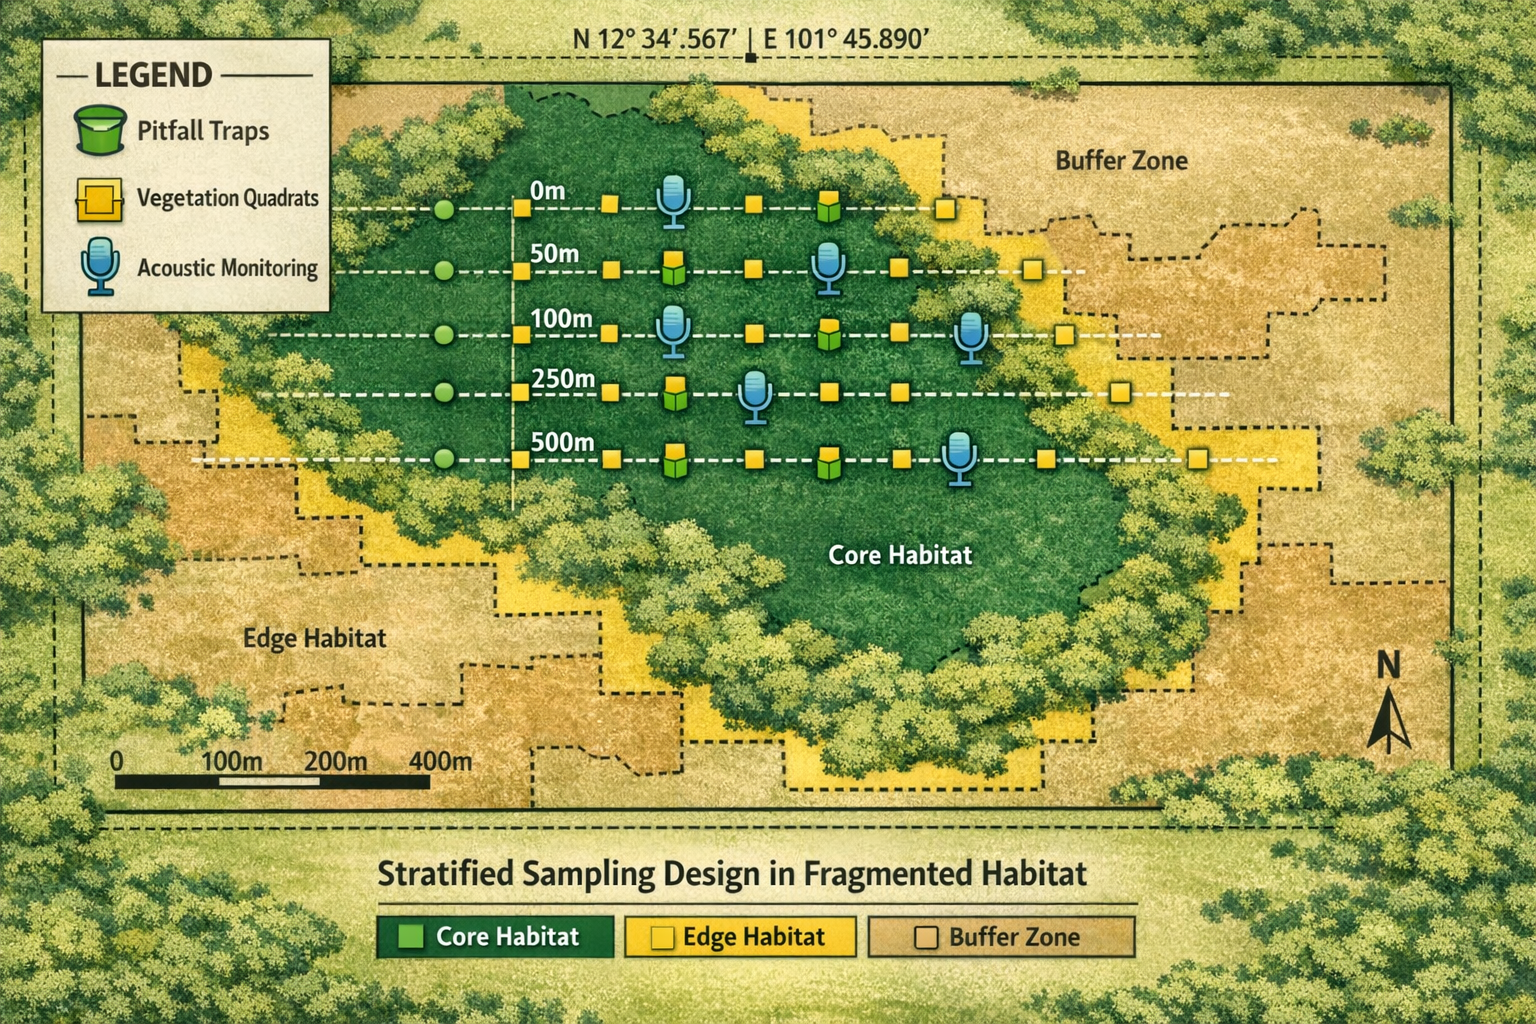
Stratified Gradient Sampling Methodology
The most effective approach for assessing edge effects involves stratified sampling along distance gradients perpendicular to habitat boundaries. This methodology provides quantitative data on how biodiversity metrics change as distance from the edge increases.
Implementation Protocol
| Distance from Edge | Survey Intensity | Key Metrics |
|---|---|---|
| 0-50m | High (5-7 replicates) | Microclimate, invasive species, generalist abundance |
| 50-100m | High (5-7 replicates) | Transition zone species, edge specialists |
| 100-250m | Medium (3-5 replicates) | Intermediate zone biodiversity |
| 250-500m | Medium (3-5 replicates) | Core habitat indicators |
| 500m+ | Low (2-3 replicates) | Baseline core habitat conditions |
This stratified approach enables surveyors to:
- Quantify the edge penetration distance for the specific habitat type
- Identify threshold distances where biodiversity metrics stabilize
- Calculate effective habitat area rather than total patch area
- Design appropriate buffer zones for mitigation
Temporal Sampling Considerations
Edge effects vary seasonally and may intensify over time as habitat fragments mature. Robust survey designs should include:
- Multiple seasonal visits to capture phenological variations
- Multi-year baseline establishment for sites with existing fragmentation
- Post-development monitoring at years 1, 3, 5, and 10
When planning biodiversity net gain projects, incorporating temporal dynamics ensures that mitigation strategies remain effective as edge conditions evolve.
Species-Specific Survey Adaptations
Different taxonomic groups respond to edge effects at varying spatial scales. Advanced survey designs must accommodate these differences:
Birds 🦜
- Large home ranges require landscape-scale assessment
- Territory mapping should extend 500m+ beyond development boundaries
- Breeding success metrics more informative than presence/absence
Invertebrates 🐛
- Highly sensitive to microclimate changes
- Require intensive sampling within 100m of edges
- Functional groups (pollinators, decomposers) provide better indicators than species counts
Plants 🌿
- Shade-tolerant species decline rapidly near edges
- Invasive species often dominate edge zones
- Vegetation structure changes precede species composition shifts
Mammals 🦡
- Movement patterns disrupted by habitat fragmentation
- Camera trap networks should span multiple habitat patches
- Connectivity assessment essential for population viability
Buffer Zone Protocols for Urban BNG Projects
Edge Effect Mitigation in Fragmented Habitats: Advanced Survey Designs for 2026 Biodiversity Net Gain places particular emphasis on buffer zone design, as these transitional areas serve as the primary defense against edge effects in urban development contexts.
Buffer Zone Design Principles
Effective buffer zones must be designed based on empirical edge penetration data rather than arbitrary distances. The 2026 best practice approach involves:
Width Calculations
Buffer width should equal or exceed the measured edge penetration distance for the most sensitive indicator species. For most UK habitats, this translates to:
- Woodland habitats: 250-500m minimum
- Grassland habitats: 100-250m minimum
- Wetland habitats: 150-300m minimum
- Hedgerow networks: 50-100m minimum
These distances far exceed the typical 10-20m buffers historically used in development projects, reflecting our improved understanding of edge effect extent[1].
Graduated Vegetation Structure
Rather than abrupt transitions, buffer zones should incorporate graduated vegetation structure that creates a gentle ecological gradient:
- Outer buffer layer (adjacent to development): Hardy, disturbance-tolerant species
- Middle buffer layer: Mixed native species with moderate shade tolerance
- Inner buffer layer (adjacent to core habitat): Shade-tolerant, specialist species matching core habitat composition
This graduated approach reduces the environmental contrast between habitats, minimizing edge effect intensity.
Integration with BNG Metric Calculations
The UK's Biodiversity Metric 4.0 framework requires careful consideration of habitat condition and connectivity. When achieving biodiversity net gain, edge effects must be factored into:
- Habitat condition assessments (edge-affected areas score lower)
- Connectivity multipliers (fragmentation reduces connectivity scores)
- Temporal multipliers (edge effects delay habitat maturation)
Surveyors should discount the biodiversity value of edge-affected zones proportionally to their distance from the boundary. A practical approach:
- 0-50m from edge: 40% reduction in habitat condition score
- 50-100m from edge: 25% reduction
- 100-250m from edge: 15% reduction
- 250m+ from edge: No reduction (core habitat)
These adjustments ensure that BNG calculations reflect the actual functional biodiversity value of retained and created habitats.
Connectivity Assessment and Landscape-Scale Planning
Fragmentation impacts extend beyond individual habitat patches to affect landscape-scale ecological connectivity. Advanced survey designs must therefore incorporate connectivity assessment as a core component.
Network Analysis Methodologies
Effective connectivity assessment involves:
Structural Connectivity Mapping
- Identification of all habitat patches within 2km radius
- Measurement of inter-patch distances
- Classification of matrix permeability (agricultural, urban, industrial)
Functional Connectivity Assessment
- Species-specific dispersal distance modeling
- Barrier identification (roads, rivers, buildings)
- Movement corridor quality evaluation
Graph Theory Applications
- Habitat patches as nodes
- Potential movement routes as edges
- Calculation of network metrics (centrality, clustering coefficient)
This analytical framework enables surveyors to identify critical connectivity nodes that disproportionately affect landscape-scale biodiversity. When these nodes are threatened by development, off-site biodiversity net gain delivery may be necessary to maintain landscape functionality.
Corridor Design for Edge Effect Mitigation
Wildlife corridors connecting fragmented habitats must themselves be designed to minimize edge effects. Best practice corridor specifications include:
- Minimum width: 50m for grassland corridors, 100m+ for woodland corridors
- Native vegetation: Species matched to connected habitat types
- Structural complexity: Multi-layered vegetation providing cover
- Reduced human disturbance: Fencing, signage, and access restrictions
"The effectiveness of habitat corridors depends not just on their presence, but on their width, vegetation structure, and freedom from edge effects. Narrow corridors may function as ecological traps rather than movement routes."
Practical Implementation for Developers and Consultants
Translating advanced survey methodologies into deliverable projects requires practical frameworks that balance ecological rigor with development feasibility. For developers navigating BNG requirements, the following implementation pathway provides a structured approach.
Phase 1: Pre-Development Assessment (Months 1-3)
Desktop Study
- Aerial imagery analysis to identify habitat patch sizes and configuration
- Historical fragmentation assessment using time-series mapping
- Preliminary edge effect risk evaluation
Field Survey Design
- Stratified sampling grid establishment based on habitat boundaries
- Selection of indicator species groups appropriate to habitat types
- Establishment of survey transects perpendicular to edges
Baseline Data Collection
- Minimum two seasonal surveys for vegetation and invertebrates
- Breeding season surveys for birds and mammals
- Microclimate monitoring at edge and core locations
Phase 2: Impact Assessment and Mitigation Design (Months 4-6)
Edge Effect Quantification
- Analysis of biodiversity gradients from baseline surveys
- Calculation of effective habitat area accounting for edge effects
- Identification of threshold distances for habitat functionality
Buffer Zone Specification
- Design of graduated buffer zones based on empirical penetration distances
- Native species selection for each buffer layer
- Integration with landscape design and site layout
Connectivity Enhancement
- Identification of corridor opportunities linking retained habitats
- Design of new habitat patches to reduce isolation
- Specification of matrix improvements (hedgerow planting, permeable fencing)
Phase 3: Metric Calculation and Enhancement Planning (Months 7-9)
When conducting biodiversity impact assessments, edge effect adjustments must be explicitly documented:
Pre-Development Baseline
- Habitat area calculations with edge effect discounting
- Condition assessments reflecting edge degradation
- Connectivity scores accounting for fragmentation
Post-Development Projections
- Retained habitat value with new edge effects
- Created habitat value with buffer zone protection
- Enhanced connectivity through corridor establishment
Net Gain Calculation
- Comparison of adjusted baseline vs. post-development scores
- Identification of any residual biodiversity deficit
- Specification of additional enhancement measures or biodiversity unit purchases if needed
Phase 4: Implementation and Monitoring (Years 1-30)
Construction Phase Safeguards 🚧
- Ecological fencing to prevent construction impacts on buffer zones
- Phased habitat creation to minimize temporal biodiversity gaps
- Contractor briefings on edge effect sensitivity
Establishment Phase Management
- Intensive management of buffer zone vegetation (years 1-5)
- Invasive species control particularly in edge zones
- Adaptive management based on monitoring results
Long-Term Monitoring Protocol
- Repeat stratified surveys at years 1, 3, 5, 10, 20, and 30
- Tracking of edge penetration distance changes over time
- Assessment of buffer zone effectiveness
- Connectivity monitoring through species movement data
Emerging Technologies and Future Directions
The field of edge effect assessment is rapidly evolving with technological advances that enable more sophisticated survey approaches in 2026.
Remote Sensing Applications
LiDAR Technology
- Three-dimensional vegetation structure mapping
- Identification of canopy gaps and edge zones
- Microclimate modeling based on topography and vegetation
Multispectral Imagery
- Vegetation health assessment using NDVI indices
- Detection of edge-related stress in plant communities
- Temporal change detection across seasons and years
Thermal Imaging
- Microclimate gradient visualization
- Identification of thermal edge effects
- Wildlife detection and movement pattern analysis
Environmental DNA (eDNA) Sampling
eDNA methodologies offer particular advantages for edge effect surveys:
- Reduced survey effort compared to traditional methods
- Detection of cryptic species that evade visual surveys
- Quantitative abundance estimates through DNA concentration
- Standardized protocols enabling robust comparisons
Stratified eDNA sampling along edge gradients provides cost-effective biodiversity profiling that complements traditional survey techniques.
Automated Monitoring Systems
Acoustic Monitoring
- Continuous recording of bird and bat vocalizations
- Automated species identification using AI algorithms
- Temporal pattern analysis revealing edge avoidance behaviors
Camera Trap Networks
- Motion-triggered wildlife photography across survey grids
- Individual identification for population estimates
- Movement pattern analysis for connectivity assessment
Sensor Arrays
- Continuous microclimate data (temperature, humidity, light)
- Soil moisture and nutrient monitoring
- Correlation of environmental variables with biodiversity patterns
These technologies enable long-term, high-resolution monitoring that captures edge effect dynamics at temporal scales impossible with traditional survey methods.
Regulatory Context and Compliance Requirements
Edge Effect Mitigation in Fragmented Habitats: Advanced Survey Designs for 2026 Biodiversity Net Gain must align with evolving regulatory frameworks. The UK's mandatory BNG requirements, fully implemented in 2024, continue to be refined through secondary legislation and updated guidance.
Key Compliance Considerations
Statutory BNG Requirements
- Minimum 10% net gain calculated using official Biodiversity Metric
- 30-year habitat management and monitoring commitments
- Submission of Biodiversity Gain Plan prior to development commencement
Edge Effect Documentation
- Survey methodologies must be clearly documented in BNG reports
- Edge effect adjustments to habitat condition scores must be justified
- Buffer zone specifications must be included in Habitat Management Plans
Professional Standards
- Surveys conducted by appropriately qualified ecologists
- Adherence to CIEEM guidelines and best practice protocols
- Peer review recommended for complex fragmentation scenarios
For planners evaluating BNG proposals, scrutiny of edge effect assessment methodology provides a key indicator of assessment quality and robustness.
Case Study Applications
Urban Infill Development (0.5 ha site)
Challenge: Small development site adjacent to ancient woodland fragment (2 ha)
Survey Approach:
- Stratified sampling at 0m, 25m, 50m, and 100m from woodland edge
- Comparison with core woodland conditions at 150m+ distance
- Assessment of existing edge degradation from previous development
Findings:
- Edge effects penetrated 75m into woodland
- Only 0.8 ha of 2 ha patch functioned as core habitat
- New development would extend edge effects further
Mitigation:
- 50m buffer zone with graduated native planting
- Existing garden vegetation replaced with woodland ground flora
- Green roof on development to reduce thermal impacts
- On-site habitat creation insufficient; off-site units purchased
Agricultural Conversion (15 ha site)
Challenge: Conversion of agricultural land to residential development with multiple retained hedgerows
Survey Approach:
- Hedgerow condition assessment including edge effect evaluation
- Connectivity analysis of hedgerow network
- Assessment of field margins and their ecological function
Findings:
- Existing hedgerows already subject to agricultural edge effects
- Proposed development would create new edges on previously interior hedgerow sections
- Network connectivity critical for bat foraging routes
Mitigation:
- 20m buffer zones along all retained hedgerows
- New hedgerow planting to maintain network connectivity
- Lighting restrictions to minimize impacts on nocturnal species
- Achieved 12% net gain through strategic habitat creation
Common Pitfalls and How to Avoid Them
Pitfall 1: Insufficient Survey Extent ❌
Problem: Surveys confined to development boundary miss edge effects on adjacent habitats
Solution: Extend surveys minimum 100m beyond development boundary, further for woodland habitats
Pitfall 2: Ignoring Existing Fragmentation ❌
Problem: Baseline assessments treat habitat patches as if they were intact, overestimating biodiversity value
Solution: Conduct stratified surveys to quantify existing edge degradation and adjust baseline accordingly
Pitfall 3: Inadequate Buffer Widths ❌
Problem: Narrow buffers (10-20m) insufficient to prevent edge effect penetration
Solution: Base buffer widths on empirical edge penetration data, typically 50-500m depending on habitat type
Pitfall 4: Static Assessment Approach ❌
Problem: Single-season surveys miss temporal dynamics of edge effects
Solution: Multi-season, multi-year surveys with long-term monitoring commitments
Pitfall 5: Neglecting Connectivity ❌
Problem: Focus on individual habitat patches without considering landscape-scale connectivity
Solution: Incorporate network analysis and corridor design into mitigation strategies
Conclusion
Edge Effect Mitigation in Fragmented Habitats: Advanced Survey Designs for 2026 Biodiversity Net Gain represents a critical evolution in ecological assessment methodology. As research continues to reveal the extensive spatial reach and complex ecological impacts of habitat fragmentation[1][4][7], survey protocols must adapt to capture these dynamics accurately.
The stratified sampling approaches, buffer zone protocols, and connectivity assessments outlined in this guide provide ecology surveyors with the tools needed to deliver robust BNG outcomes in fragmented landscapes. By quantifying edge penetration distances, adjusting habitat valuations accordingly, and designing evidence-based mitigation strategies, practitioners can ensure that development projects achieve genuine biodiversity enhancement rather than merely meeting regulatory minimums.
Actionable Next Steps
For Ecology Consultants:
- Review existing survey protocols and incorporate stratified edge gradient sampling
- Invest in remote sensing and automated monitoring technologies
- Develop standardized edge effect adjustment frameworks for metric calculations
- Build relationships with research institutions to stay current with fragmentation science
For Developers:
- Commission comprehensive edge effect assessments early in project planning
- Engage with biodiversity surveyors experienced in fragmentation impacts
- Budget for adequate buffer zones and connectivity enhancements
- Consider off-site biodiversity units when on-site mitigation is insufficient
For Planners:
- Scrutinize BNG assessments for appropriate edge effect consideration
- Require justification of buffer zone widths based on empirical data
- Prioritize developments that enhance rather than fragment habitat networks
- Consult the top questions about BNG to strengthen evaluation frameworks
The 2026 landscape of biodiversity net gain demands sophisticated approaches that acknowledge the spatial complexity of ecological systems. By embracing advanced survey designs that explicitly address edge effects and fragmentation, the development sector can move beyond compliance toward genuine environmental stewardship that delivers measurable, lasting biodiversity benefits.
References
[1] Pnas – https://www.pnas.org/doi/10.1073/pnas.0800460105
[2] Pmc12912847 – https://pmc.ncbi.nlm.nih.gov/articles/PMC12912847/
[4] Resolving A 50 Year Debate Fragmentation Decreases Biodiversity On Multiple Scales – https://conservationcorridor.org/digests/2025/03/resolving-a-50-year-debate-fragmentation-decreases-biodiversity-on-multiple-scales/
[7] 2025 07 Debate Forest Fragmentation Impact Ecosystem – https://phys.org/news/2025-07-debate-forest-fragmentation-impact-ecosystem.html
