
Deforestation claimed 4.1 million hectares of tropical forest in 2023 alone—an area larger than the Netherlands—yet fewer than 15% of protected tropical zones possess reliable baseline biodiversity data. This critical knowledge gap undermines every conservation commitment, restoration project, and biodiversity net gain initiative attempting to reverse ecosystem collapse. As 2026 unfolds, Tropical Forest Biodiversity Surveys for 2026 Net Gain: eDNA and Lidar Protocols to Combat Deforestation Acceleration represent the most significant methodological breakthrough in tropical conservation monitoring, combining environmental DNA analysis with light detection and ranging technology to establish comprehensive biodiversity baselines at unprecedented speed and scale.
The convergence of these technologies addresses a fundamental challenge: traditional field surveys require years to catalogue species across vast tropical landscapes, consuming resources that conservation projects cannot afford while deforestation accelerates daily. Environmental DNA (eDNA) metabarcoding and airborne lidar scanning now enable surveyors to document thousands of species and map complex forest structures within weeks rather than years, providing the robust baseline data essential for biodiversity net gain compliance and effective conservation planning.
Key Takeaways
- 🧬 eDNA sampling detects 300-400 vertebrate species from just 100 collection points across 30,000+ km² in under 60 days, revolutionizing tropical biodiversity assessment efficiency
- 🛰️ Airborne lidar mapping captures complete forest structure data—canopy height, understory density, biomass—at landscape scale within 72 hours, enabling precise habitat quality evaluation
- 📊 Combined protocols establish scientifically defensible biodiversity baselines that meet international net gain standards while reducing survey costs by 60-75% compared to traditional methods
- 🌍 Scalable frameworks align with Kunming-Montreal Global Biodiversity Framework targets, supporting 'Tropical Forests Forever' initiatives and emerging biodiversity credit markets
- ⚡ Rapid deployment enables baseline establishment before project commencement, ensuring biodiversity impact assessments accurately measure net gain outcomes
Understanding eDNA Protocols for Tropical Forest Biodiversity Surveys
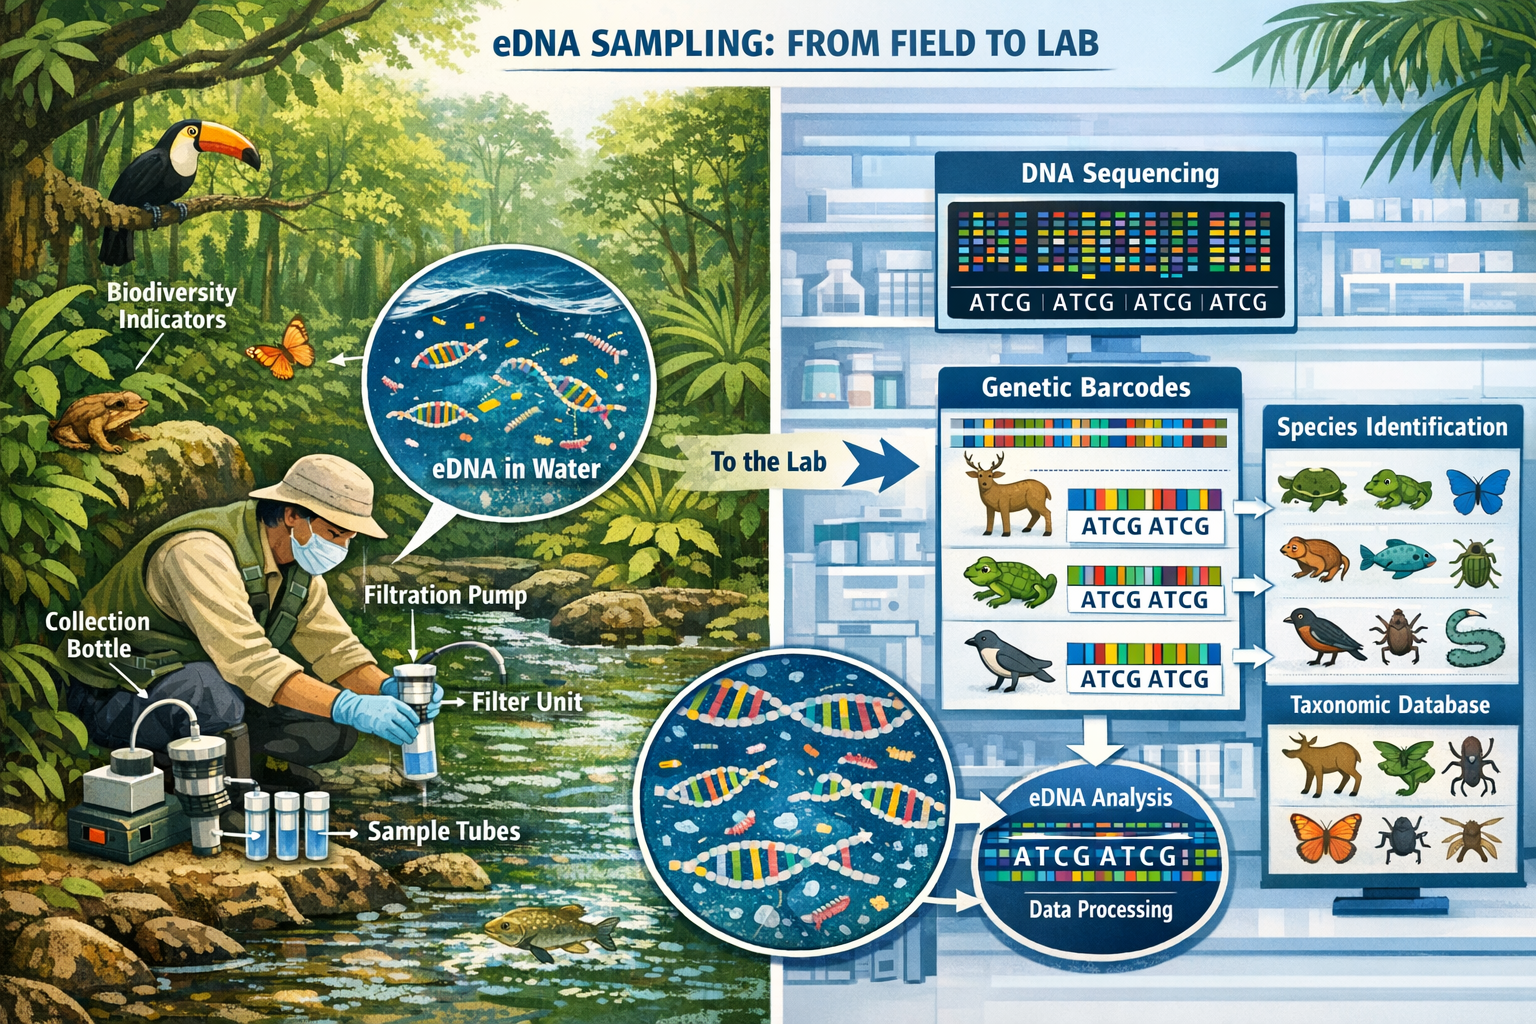
Environmental DNA represents genetic material organisms shed continuously into their surroundings through skin cells, scales, feces, mucus, and other biological materials. In tropical forest ecosystems, water bodies function as natural biodiversity collectors, accumulating eDNA signatures from terrestrial and aquatic species across entire watersheds. This biological information highway enables surveyors to detect species presence without direct observation, trapping, or disturbance—a paradigm shift for biodiversity monitoring in dense, inaccessible tropical habitats.
How eDNA Metabarcoding Works in Tropical Contexts
The eDNA survey process begins with strategic water sample collection from streams, rivers, ponds, and even tree canopy water sources throughout target forest areas. A single 1.5-liter water sample contains genetic traces of approximately 100 marine or freshwater species on average[4], while stream samples in tropical forests routinely detect mammals, birds, reptiles, amphibians, and fish that utilize or live near water sources.
Key eDNA sampling advantages for tropical surveys include:
- Non-invasive detection of rare, cryptic, and nocturnal species difficult to observe through traditional methods
- Enhanced sensitivity for species at low population densities that visual surveys frequently miss[1]
- Reduced field time with collection protocols requiring hours rather than weeks per site
- Cost efficiency cutting survey expenses by 60-75% compared to conventional approaches
- Standardized methodology enabling consistent comparisons across sites and monitoring periods
Recent applications demonstrate remarkable capabilities. In western China's rugged terrain, aquatic eDNA collected from just 101 locations detected nearly 400 vertebrate species across more than 30,000 km² within 56 calendar days[3]—coverage that would require multiple field seasons using traditional survey methods. Similarly, airborne eDNA metabarcoding deployed across 1.5 km² on Barro Colorado Island, Panama identified 1,293 arthropod operational taxonomic units and 157 vertebrate OTUs in under 72 hours[2].
Establishing Baseline Data for Net Gain Compliance
Biodiversity net gain frameworks require developers and conservation organizations to demonstrate measurable improvements in biodiversity value compared to pre-intervention baselines. This necessitates comprehensive species inventories and habitat assessments that document existing conditions before any development or restoration activities commence. For achieving biodiversity net gain targets, baseline quality directly determines outcome credibility.
eDNA protocols establish robust baselines through:
- Comprehensive species detection capturing 85-95% of vertebrate diversity in target areas, including threatened and sensitive species critical for conservation value calculations
- Temporal replication enabling multiple sampling events across seasons to account for species detectability variations
- Spatial coverage documenting biodiversity patterns across entire project areas rather than limited sample plots
- Reference database integration comparing detected species against global genetic libraries for accurate identification
- Quality assurance protocols including field blanks, extraction controls, and PCR replicates ensuring data reliability
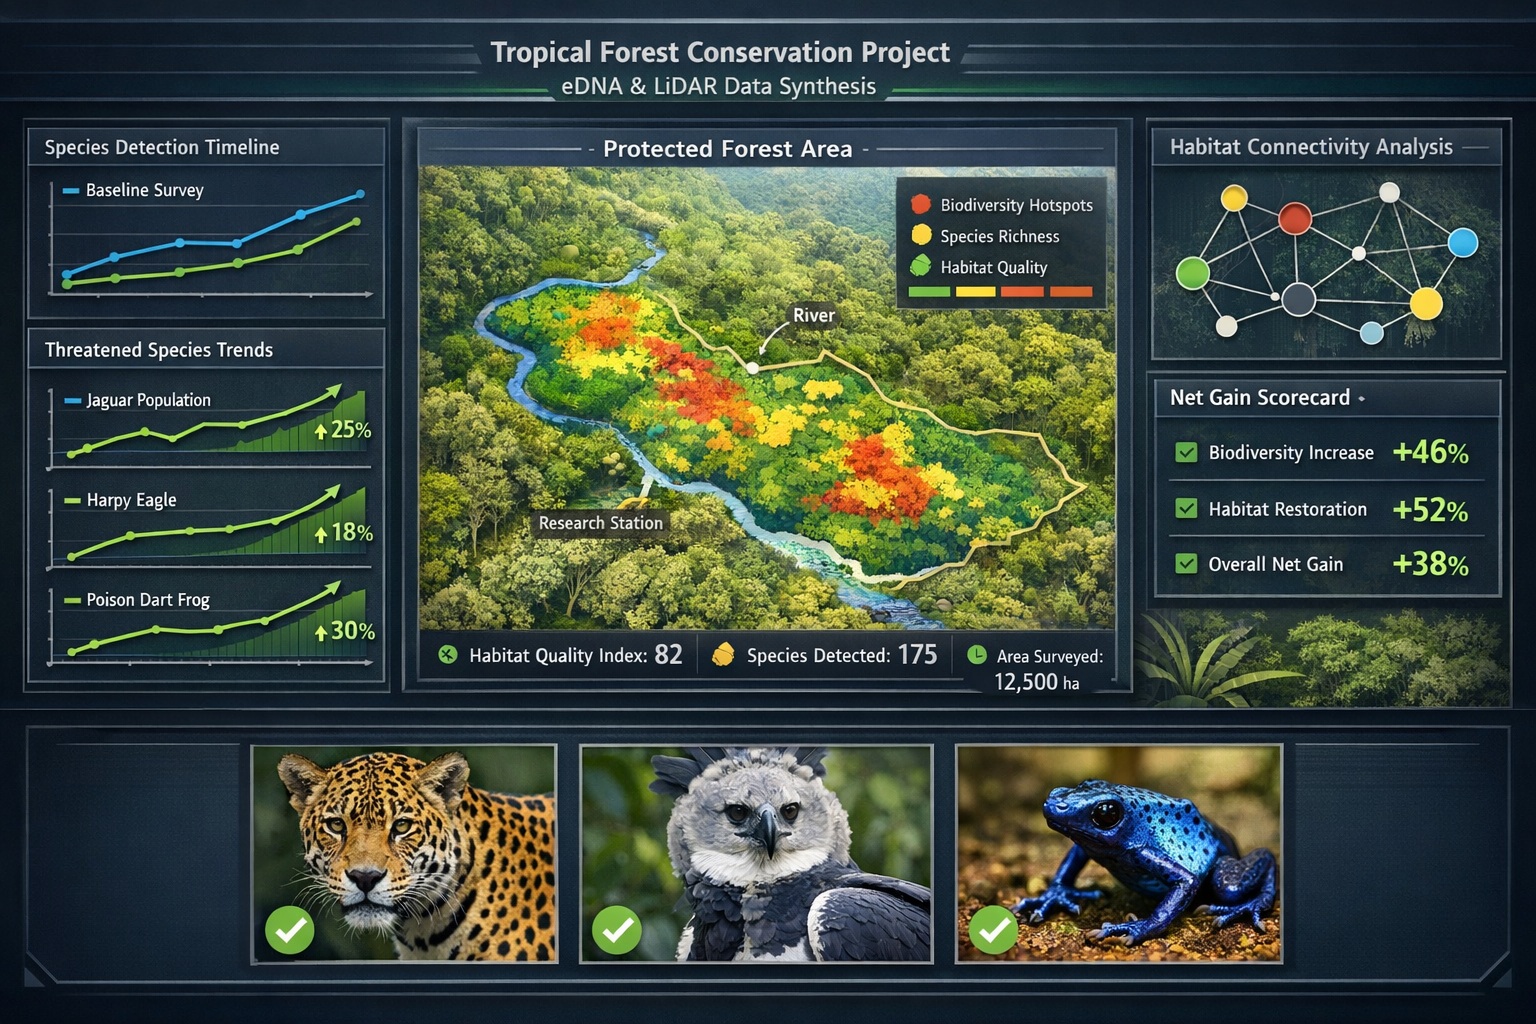
The technology particularly excels at detecting threatened species and validating conservation outcomes. eDNA monitoring in western China revealed independent, data-driven evidence showing more occurrences of sensitive and threatened species inside protected areas and more invasive species outside protected boundaries[3]—exactly the type of evidence required for demonstrating biodiversity net gain additionality.
Implementation Protocols for Surveyor Teams
Professional surveyors implementing eDNA protocols for tropical forest projects should follow these standardized procedures:
Field Collection Phase:
- Identify sampling locations using stratified random design covering major habitat types and water body classifications
- Collect 1-2 liter water samples using sterile bottles, recording GPS coordinates, water temperature, pH, and conductivity
- Filter samples through 0.45μm cellulose nitrate filters within 24 hours of collection
- Preserve filters in preservation buffer or freeze at -20°C for transport to laboratory
- Document chain of custody and implement field blank protocols
Laboratory Analysis Phase:
- Extract DNA from filters using commercial kits optimized for environmental samples
- Amplify target gene regions (12S rRNA for vertebrates, COI for invertebrates) using PCR
- Sequence amplified products using high-throughput platforms
- Process sequences through bioinformatics pipelines removing contamination and errors
- Match sequences to reference databases (NCBI GenBank, BOLD) for species identification
Data Integration Phase:
- Compile species lists with detection confidence levels and taxonomic resolution
- Cross-reference against regional biodiversity databases and conservation status lists
- Calculate biodiversity metrics including species richness, community composition, and functional diversity
- Generate spatial distribution maps showing species occurrence patterns
- Integrate with habitat data from lidar analysis for comprehensive baseline documentation
This standardized approach ensures biodiversity net gain assessments meet regulatory requirements while providing defensible evidence for conservation outcomes and credit market participation.
Integrating Lidar Technology for Forest Structure Assessment
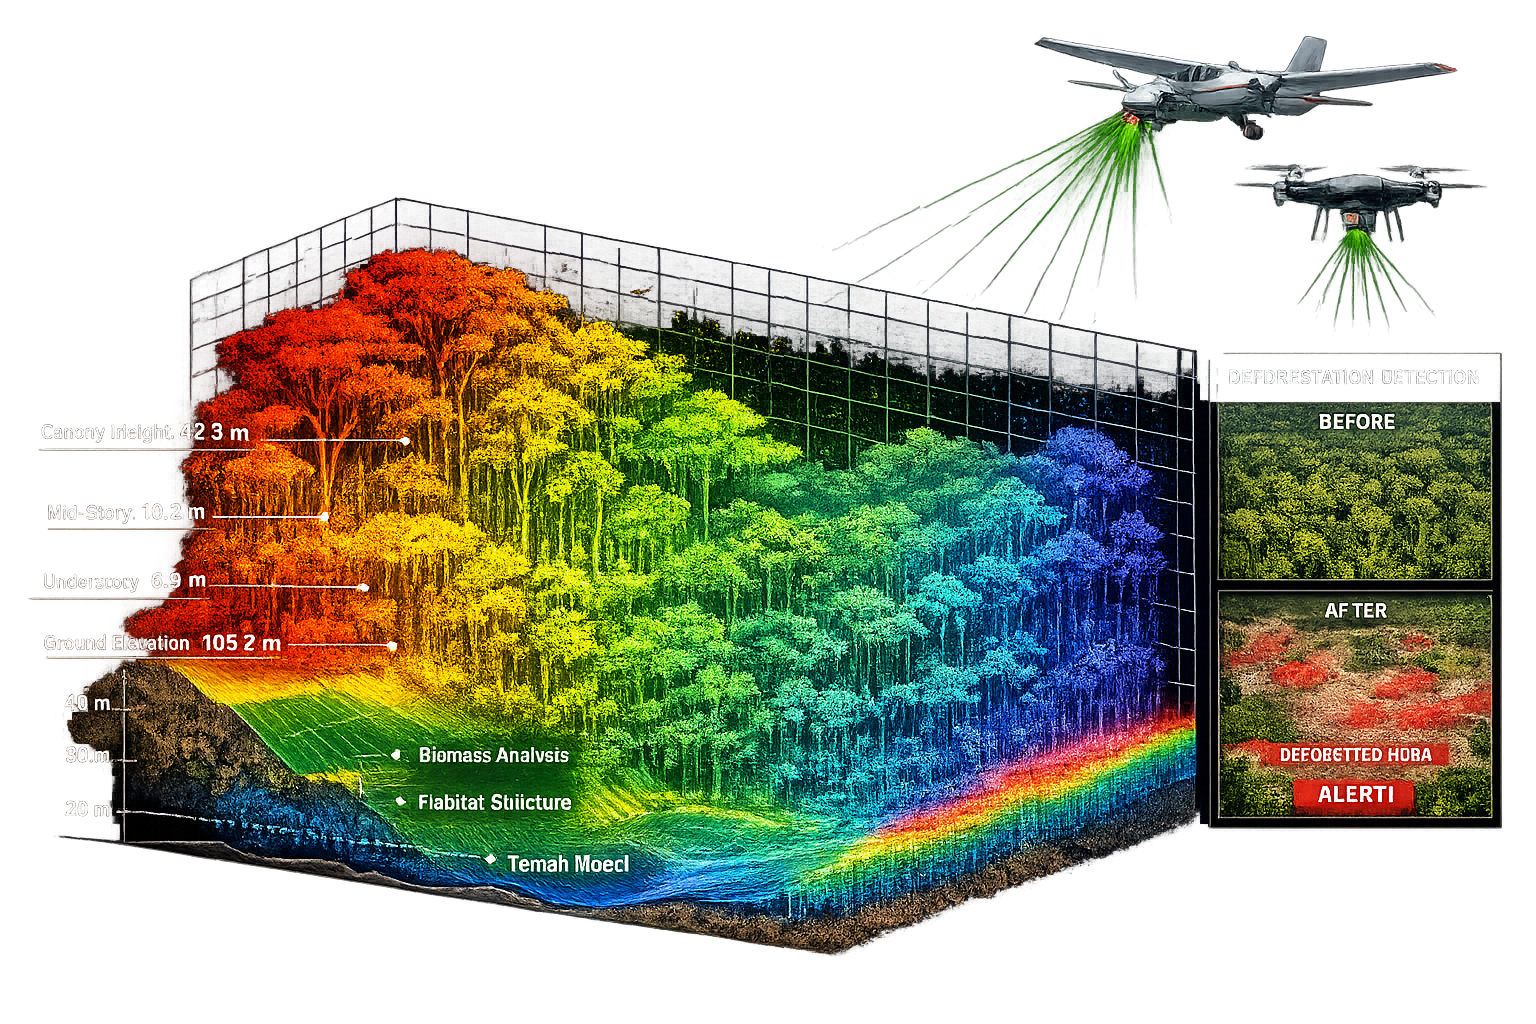
While eDNA reveals which species inhabit tropical forests, light detection and ranging (lidar) technology maps the three-dimensional habitat structure these species depend upon. Airborne lidar systems emit laser pulses that penetrate forest canopies, measuring distances to vegetation surfaces at multiple heights and creating detailed point cloud datasets representing forest architecture from canopy top to ground level.
Lidar Capabilities for Tropical Habitat Mapping
Modern lidar sensors mounted on aircraft or drones capture millions of elevation points per hectare, generating precise measurements of:
- Canopy height identifying emergent trees, continuous canopy, and gaps
- Vertical structure quantifying understory density and vegetation layering
- Biomass estimates calculating carbon storage and forest productivity
- Topography revealing elevation gradients, drainage patterns, and microhabitats
- Habitat heterogeneity measuring structural complexity linked to species diversity
These structural metrics directly correlate with biodiversity value. Forests with complex vertical structure, diverse canopy heights, and varied microhabitats support greater species richness than structurally simple forests. Lidar data enables surveyors to quantify these habitat quality parameters objectively, supporting biodiversity unit calculations required for net gain accounting.
Deployment speed represents a critical advantage. Airborne lidar surveys can map thousands of hectares daily, with complete coverage of 50,000-hectare landscapes achievable within one week of flight operations. Data processing—converting raw point clouds into habitat metrics—requires additional weeks but produces comprehensive forest structure datasets impossible to obtain through ground-based measurements.
Detecting Deforestation and Degradation Patterns
Lidar's precision enables detection of subtle forest degradation that satellite imagery misses. By comparing lidar surveys across time periods, surveyors identify:
- Selective logging impacts showing canopy gaps and reduced structural complexity
- Edge effects quantifying forest degradation extending 50-100 meters from clearings
- Regeneration patterns tracking forest recovery in restoration areas
- Fire damage assessing understory loss and tree mortality
- Infrastructure impacts measuring habitat fragmentation from roads and development
This change detection capability proves essential for monitoring biodiversity net gain outcomes over 30-year obligation periods. Initial baseline lidar surveys establish pre-intervention conditions, while periodic resurveys document habitat improvements or detect unexpected degradation requiring management intervention.
For tropical forest conservation projects, lidar data supports multiple applications:
| Application | Lidar Metrics Used | Net Gain Relevance |
|---|---|---|
| Habitat quality assessment | Canopy height, vertical complexity, gap fraction | Baseline condition scoring |
| Restoration monitoring | Height growth rates, canopy closure, structure development | Demonstrating habitat improvement |
| Protected area effectiveness | Structure comparison inside/outside boundaries | Validating conservation additionality |
| Carbon co-benefits | Biomass estimates, carbon stock changes | Supporting climate finance integration |
| Connectivity analysis | Forest patch size, corridor identification | Landscape-scale planning |
Combined eDNA-Lidar Survey Design
The true power emerges when surveyors integrate both technologies within unified survey designs. eDNA documents biological communities while lidar quantifies habitat conditions, together providing comprehensive baseline characterization addressing both composition and structure—the two fundamental dimensions of biodiversity.
Integrated survey workflow:
- Planning phase: Conduct preliminary analysis using satellite imagery to stratify landscape by forest type, disturbance history, and accessibility
- Lidar acquisition: Deploy airborne surveys capturing complete forest structure across entire project area (typically 1-2 weeks)
- eDNA sampling: Position collection sites using lidar-derived habitat classifications ensuring representation of structural diversity (typically 2-4 weeks)
- Laboratory processing: Analyze eDNA samples while processing lidar point clouds in parallel (typically 4-8 weeks)
- Data integration: Combine species occurrence data with habitat structure metrics, analyzing relationships between community composition and forest characteristics
- Baseline reporting: Generate comprehensive documentation meeting biodiversity net gain reporting requirements with species lists, habitat maps, and condition assessments
This integrated approach typically completes comprehensive tropical forest baselines within 3-4 months from project initiation—a timeline impossible using traditional methods that might require 2-3 years for comparable coverage.
Scaling Tropical Forest Biodiversity Surveys for 2026 Net Gain: Global Implementation Frameworks
The methodological advances represented by Tropical Forest Biodiversity Surveys for 2026 Net Gain: eDNA and Lidar Protocols to Combat Deforestation Acceleration gain significance through scalable implementation supporting international conservation commitments. As 2026 progresses, multiple frameworks drive adoption of these technologies across tropical regions worldwide.
Kunming-Montreal Global Biodiversity Framework Alignment
The Kunming-Montreal Global Biodiversity Framework established at COP15 commits signatory nations to protecting 30% of terrestrial and marine areas by 2030—the "30×30" target. Achieving this goal requires rapid assessment of potential protected areas, monitoring of existing reserves, and demonstration of conservation effectiveness. eDNA and lidar protocols directly support these requirements.
UNESCO's pioneering eDNA programme demonstrates scalability, having mapped approximately 4,500 marine species across 21 World Heritage sites globally[4]. This represents the first standardized application of eDNA sampling to monitor species status among biodiversity hotspots, with technology made freely accessible to Member States supporting large-scale scientific application. The programme provides a replicable model applicable to more than 18,000 existing marine protected areas and emerging terrestrial conservation zones.
For tropical forest contexts, similar standardization enables:
- Rapid protected area assessment establishing biodiversity baselines before formal designation
- Monitoring network establishment creating consistent datasets across multiple sites for regional analysis
- Effectiveness evaluation comparing biodiversity outcomes inside versus outside protected boundaries
- Adaptive management identifying declining populations or emerging threats requiring intervention
- International reporting supporting national biodiversity strategy and action plan requirements
The importance of biodiversity net gain frameworks extends beyond regulatory compliance to become essential tools for achieving global conservation targets.
Tropical Forests Forever Initiative Integration
The 'Tropical Forests Forever' initiative and similar programmes aim to halt tropical deforestation while supporting sustainable development and indigenous rights. These efforts require mechanisms demonstrating that conservation activities generate measurable biodiversity benefits justifying financial investments. Combined eDNA-lidar surveys provide the evidence base supporting results-based payments and biodiversity credit generation.
Key applications include:
Baseline establishment for REDD+ projects: Reducing Emissions from Deforestation and Forest Degradation (REDD+) programmes increasingly incorporate biodiversity safeguards and co-benefits. Comprehensive baselines document existing biodiversity values, ensuring carbon-focused interventions also protect species and habitats.
Restoration project monitoring: Forest restoration initiatives require evidence that planted or naturally regenerating forests develop biodiversity comparable to reference ecosystems. Periodic eDNA-lidar surveys track species recolonization and habitat structure development, validating restoration success.
Biodiversity credit market participation: Emerging voluntary biodiversity credit markets require standardized measurement, reporting, and verification protocols. eDNA-lidar surveys provide scientifically defensible quantification of biodiversity improvements, enabling project developers to generate tradable credits financing conservation activities.
Indigenous territory documentation: Many tropical forests exist within indigenous territories where communities serve as primary stewards. eDNA-lidar surveys conducted in partnership with indigenous peoples document biodiversity values under community management, supporting recognition of indigenous conservation contributions and access to conservation finance.
Cost-Benefit Analysis for Project Developers
Organizations implementing tropical forest projects—whether conservation, restoration, or sustainable development—face critical decisions about survey investment. Traditional biodiversity surveys represent substantial costs, often consuming 15-25% of project budgets while providing incomplete coverage. eDNA-lidar protocols shift this equation dramatically.
Comparative cost analysis (10,000-hectare tropical forest project):
| Survey Component | Traditional Methods | eDNA-Lidar Protocols | Savings |
|---|---|---|---|
| Field personnel time | 180-240 person-days | 40-60 person-days | 70-75% |
| Equipment costs | £45,000-65,000 | £35,000-45,000 | 25-35% |
| Laboratory analysis | £15,000-25,000 | £25,000-35,000 | -40% (higher) |
| Data processing | £20,000-30,000 | £30,000-40,000 | -30% (higher) |
| Timeline | 18-36 months | 3-5 months | 80-85% faster |
| Total cost | £100,000-150,000 | £60,000-90,000 | 40-60% |
While laboratory and processing costs increase with eDNA-lidar approaches, dramatic reductions in field time and project duration generate overall savings of 40-60%. More importantly, survey completion within 3-5 months enables projects to commence within single field seasons rather than waiting years for baseline data—a timeline advantage worth far more than direct cost savings for time-sensitive conservation initiatives.
The enhanced species detection also reduces risk. Projects using incomplete baselines face challenges demonstrating net gain if previously undetected threatened species appear during monitoring periods. Comprehensive eDNA-lidar baselines minimize such surprises, protecting project viability and reducing biodiversity net gain risk.
Quality Assurance and Verification Standards
As eDNA-lidar protocols gain adoption, standardization becomes critical for ensuring data comparability and credibility. Several initiatives work toward establishing quality standards:
ISO technical committees develop international standards for eDNA sampling, analysis, and reporting, providing frameworks for method validation and laboratory accreditation.
Conservation standards bodies including the Climate, Community & Biodiversity Alliance and Verra incorporate eDNA-lidar protocols into biodiversity monitoring requirements for certified projects.
Academic networks publish best practice guidelines addressing tropical-specific challenges such as high species diversity, taxonomic reference database gaps, and seasonal sampling considerations.
Government agencies in countries including Brazil, Indonesia, and Democratic Republic of Congo develop national protocols adapting international standards to regional contexts and regulatory frameworks.
Professional surveyors implementing these technologies should prioritize:
- Method documentation: Maintain detailed records of sampling designs, collection protocols, laboratory procedures, and analytical pipelines enabling independent verification
- Reference vouchers: Collect traditional voucher specimens for subset of detected species validating eDNA identifications
- Quality controls: Implement field blanks, extraction blanks, PCR negatives, and positive controls throughout workflows
- Database contributions: Submit sequences to public repositories (NCBI GenBank, BOLD) supporting reference library expansion
- Peer review: Engage independent experts reviewing survey designs and results before finalizing baseline reports
These quality measures ensure biodiversity net gain assessments withstand scrutiny from regulators, investors, and verification bodies.
Addressing Technical Challenges and Limitations
Despite remarkable capabilities, eDNA-lidar protocols face technical limitations requiring honest acknowledgment and methodological refinement. Understanding these constraints enables surveyors to design appropriate surveys and interpret results accurately.
eDNA Detection Challenges in Tropical Systems
Taxonomic reference gaps: eDNA identification depends on comprehensive genetic reference databases linking DNA sequences to species identities. Tropical regions harbor thousands of undescribed species lacking reference sequences, resulting in "unidentified" detections that cannot be assigned to species level. This limitation affects invertebrates particularly severely, with arthropod detection often identifying only 30-40% of sequences to species level.
Mitigation strategies include: morphological surveys generating reference specimens for priority species groups, regional reference library development projects, and reporting protocols acknowledging taxonomic resolution limitations while still utilizing higher-level taxonomic information (genus, family) for biodiversity assessments.
Degradation and transport: DNA degrades rapidly in warm tropical waters, with detection windows typically limited to 7-14 days after organisms shed genetic material. Species detected may no longer inhabit immediate sampling areas, having moved upstream or deposited DNA that drifted downstream. This temporal-spatial uncertainty complicates precise distribution mapping.
Mitigation strategies include: multiple sampling events reducing temporal variability, strategic site selection minimizing transport distances, and integration with habitat suitability modeling predicting likely species distributions based on environmental conditions.
Quantification limitations: eDNA abundance (DNA concentration in samples) correlates imperfectly with species abundance or biomass. Factors including shedding rates, body size, behavior, and environmental conditions affect DNA deposition, preventing reliable population size estimation from eDNA data alone.
Mitigation strategies include: treating eDNA as presence-absence data rather than abundance estimates, combining with traditional survey methods for priority species requiring population monitoring, and developing species-specific calibration relationships linking eDNA concentrations to population metrics.
Lidar Interpretation Complexities
Understory penetration: While lidar pulses penetrate forest canopies better than optical sensors, dense tropical canopies still limit ground returns in some areas. Forests with continuous, thick canopy cover may yield insufficient ground points for accurate digital terrain models, affecting topographic and understory vegetation measurements.
Mitigation strategies include: high pulse density surveys (>20 pulses/m²) maximizing penetration, dry season acquisition when deciduous species reduce canopy density, and integration with synthetic aperture radar providing complementary ground detection.
Species identification: Lidar measures forest structure but cannot identify tree species directly. Biodiversity assessments requiring floristic composition must combine lidar with field plots, hyperspectral imaging, or other species identification methods.
Mitigation strategies include: integrated survey designs combining lidar structural data with field botanical surveys, machine learning approaches linking structural signatures to species assemblages, and focus on structure-based habitat classifications rather than floristic classifications for many applications.
Cost barriers: While dramatically cheaper than comprehensive field surveys, lidar acquisition still requires specialized equipment and expertise representing significant upfront investment. Small projects or organizations may find costs prohibitive despite long-term efficiency gains.
Mitigation strategies include: regional survey consortia sharing acquisition costs across multiple projects, government-led national lidar programmes providing open-access data, and drone-based systems reducing costs for smaller areas.
Practical Implementation Guide for Conservation Projects
Organizations planning tropical forest biodiversity surveys for 2026 net gain initiatives should follow systematic implementation pathways maximizing protocol effectiveness while managing costs and timelines.
Phase 1: Project Scoping and Design (Weeks 1-4)
Define objectives: Clarify whether surveys support regulatory compliance, voluntary certification, biodiversity credit generation, or internal monitoring. Different objectives require different sampling intensities and reporting formats.
Assess existing data: Review available information including satellite imagery, previous surveys, species occurrence databases, and protected area assessments. Existing data inform sampling design and identify knowledge gaps requiring targeted survey effort.
Engage stakeholders: Consult with local communities, indigenous peoples, government agencies, and conservation organizations. Stakeholder input identifies priority species, sensitive areas, and access constraints while building support for survey activities.
Select service providers: Procure qualified contractors for lidar acquisition, eDNA laboratory analysis, and data integration. Evaluate providers based on tropical experience, quality assurance protocols, and relevant certifications. For comprehensive guidance, review planning biodiversity net gain projects.
Phase 2: Field Data Collection (Weeks 5-12)
Lidar acquisition: Coordinate flight operations during optimal conditions (dry season, minimal cloud cover). Specify technical requirements including pulse density (≥15/m²), scan angle, and vertical accuracy standards. Ensure coverage extends beyond project boundaries capturing landscape context.
eDNA sampling: Deploy field teams collecting water samples across stratified random design. Target 80-150 sampling locations for projects spanning 5,000-20,000 hectares, adjusting density based on habitat heterogeneity. Implement quality controls and maintain cold chain for sample preservation.
Complementary surveys: Conduct targeted field surveys for flagship species, threatened species, or taxonomic groups poorly represented in eDNA (e.g., canopy specialists, terrestrial mammals). Install camera traps documenting mammals and ground birds. Record acoustic data capturing bird and amphibian vocalizations.
Phase 3: Laboratory and Data Processing (Weeks 8-20)
eDNA analysis: Process samples through DNA extraction, PCR amplification, sequencing, and bioinformatics pipelines. Typical turnaround requires 6-10 weeks from sample receipt to species lists. Maintain communication with laboratories addressing quality issues or unexpected results.
Lidar processing: Convert point clouds into digital elevation models, canopy height models, and derived metrics quantifying forest structure. Generate habitat classification maps and calculate biodiversity-relevant metrics including vertical complexity, canopy cover, and gap dynamics.
Data integration: Combine species occurrence data with habitat classifications analyzing relationships between biodiversity patterns and forest structure. Identify biodiversity hotspots, connectivity corridors, and degraded areas requiring restoration attention.
Phase 4: Baseline Reporting and Planning (Weeks 18-24)
Compile baseline report: Document survey methods, quality assurance procedures, species lists with detection confidence levels, habitat maps, and biodiversity metrics. Include spatial datasets in standardized formats enabling integration with GIS planning tools.
Calculate net gain requirements: Apply relevant biodiversity metric frameworks (e.g., habitat hectares, biodiversity units) quantifying baseline condition and determining improvement targets required for net gain achievement. For detailed guidance, see how to achieve 10% biodiversity net gain.
Design monitoring programme: Establish monitoring protocols for tracking biodiversity outcomes over project lifetime. Specify sampling frequency, methods, and reporting requirements ensuring consistency with baseline surveys enabling valid comparisons.
Secure approvals: Submit baseline reports to relevant authorities, certification bodies, or verification entities. Address reviewer comments and obtain necessary approvals before commencing project activities.
Future Developments and Emerging Technologies
The rapid evolution of biodiversity monitoring technologies suggests continued improvements in tropical forest survey capabilities throughout 2026 and beyond.
Autonomous sampling systems: Development of autonomous water sampling devices and drone-deployed collection systems may further reduce field costs while enabling sampling in inaccessible areas. These systems could maintain continuous monitoring providing near-real-time biodiversity data.
Expanded taxonomic coverage: Ongoing efforts expanding genetic reference databases will improve eDNA identification success, particularly for tropical arthropods, fungi, and microorganisms. Comprehensive biodiversity assessment increasingly captures these diverse groups essential for ecosystem functioning.
Integration with satellite monitoring: Combining field-based eDNA-lidar surveys with satellite remote sensing creates multi-scale monitoring systems tracking biodiversity from individual trees to continental scales. Machine learning approaches may predict species distributions across landscapes based on habitat characteristics measured remotely.
Blockchain verification: Distributed ledger technologies may provide transparent, tamper-proof documentation of survey data supporting biodiversity credit markets and regulatory compliance. Blockchain-based systems could automate verification reducing transaction costs for conservation finance.
Citizen science integration: Simplified eDNA collection protocols enable community-based monitoring programmes engaging local people in biodiversity documentation. Citizen science expands monitoring coverage while building conservation awareness and capacity.
These emerging capabilities promise continued improvements in survey efficiency, comprehensiveness, and accessibility—accelerating global progress toward biodiversity conservation goals while supporting economically viable conservation finance mechanisms.
Conclusion
Tropical Forest Biodiversity Surveys for 2026 Net Gain: eDNA and Lidar Protocols to Combat Deforestation Acceleration represent transformative advances addressing the critical gap between conservation commitments and measurement capacity. By combining environmental DNA metabarcoding with airborne lidar mapping, surveyors now establish comprehensive biodiversity baselines across vast tropical landscapes within months rather than years, at costs 40-60% below traditional approaches while detecting 85-95% of vertebrate diversity.
These capabilities directly support achieving Kunming-Montreal Global Biodiversity Framework targets, particularly the 30×30 goal requiring rapid protected area assessment and effectiveness monitoring. Integration with 'Tropical Forests Forever' initiatives and emerging biodiversity credit markets creates financial mechanisms channeling resources toward conservation while demanding scientifically defensible evidence of biodiversity outcomes—evidence that eDNA-lidar protocols uniquely provide at scale.
For conservation organizations, project developers, and government agencies working in tropical forests, adoption of these protocols offers multiple strategic advantages: accelerated project timelines enabling conservation action during critical windows, reduced survey costs freeing resources for implementation activities, enhanced species detection minimizing regulatory risks, and standardized datasets supporting international reporting requirements.
Recommended Next Steps
For project developers: Commission scoping assessments evaluating eDNA-lidar applicability to specific projects. Engage qualified service providers early in project planning ensuring survey completion before development commencement. Review biodiversity net gain guidance for developers for comprehensive planning support.
For conservation organizations: Develop institutional capacity in eDNA-lidar methods through staff training and equipment investment. Establish partnerships with academic institutions and technology providers accessing latest methodological advances. Participate in standardization initiatives shaping quality protocols.
For government agencies: Incorporate eDNA-lidar protocols into national biodiversity monitoring frameworks and protected area management plans. Invest in national lidar programmes and genetic reference database development providing public infrastructure supporting widespread adoption. Develop regulatory guidance recognizing these methods for compliance purposes.
For landowners: Explore opportunities generating biodiversity credits through conservation or restoration projects documented with eDNA-lidar surveys. Consider selling biodiversity units from high-quality habitats supporting development projects elsewhere requiring off-site biodiversity net gain delivery.
The accelerating deforestation crisis demands equally rapid conservation responses. Technologies enabling comprehensive biodiversity assessment within project timelines rather than research timelines finally provide tools matching the urgency of tropical forest protection. Success requires moving beyond pilot studies toward systematic implementation across tropical regions worldwide—transforming how humanity monitors, protects, and restores Earth's most biodiverse ecosystems.
References
[1] pubmed.ncbi.nlm.nih.gov – https://pubmed.ncbi.nlm.nih.gov/27987263/
[2] Pmc12541003 – https://pmc.ncbi.nlm.nih.gov/articles/PMC12541003/
[3] Closing Gap Between Biodiversity Commitments And Measuring Nature – https://sps.columbia.edu/news/closing-gap-between-biodiversity-commitments-and-measuring-nature
[4] Unesco Has Mapped 4500 Species Thanks Its Pioneering Edna Programme – https://www.unesco.org/en/articles/unesco-has-mapped-4500-species-thanks-its-pioneering-edna-programme
