
Britain's rewilding movement has reached a critical inflection point: as of September 2025, 112 off-site Biodiversity Net Gain (BNG) projects covering over 4,000 hectares had been officially registered[1]. Yet behind these impressive numbers lies a more complex question—how do ecologists truly measure whether restored land is becoming ecologically functional, not just greener? Understanding Rewilding Metrics and Measurement: How Ecologists Quantify Restoration Success in BNG Projects has become essential for developers, landowners, and conservation professionals navigating the mandatory 10% net gain requirements introduced across England in 2026.
Traditional biodiversity assessment relied heavily on simple species counts and habitat area calculations. Modern rewilding science, however, demands a more sophisticated approach that captures ecological function, trophic complexity, and ecosystem resilience. This comprehensive guide explores the frameworks, tools, and methodologies that ecologists use to quantify genuine restoration success in BNG projects.
Key Takeaways
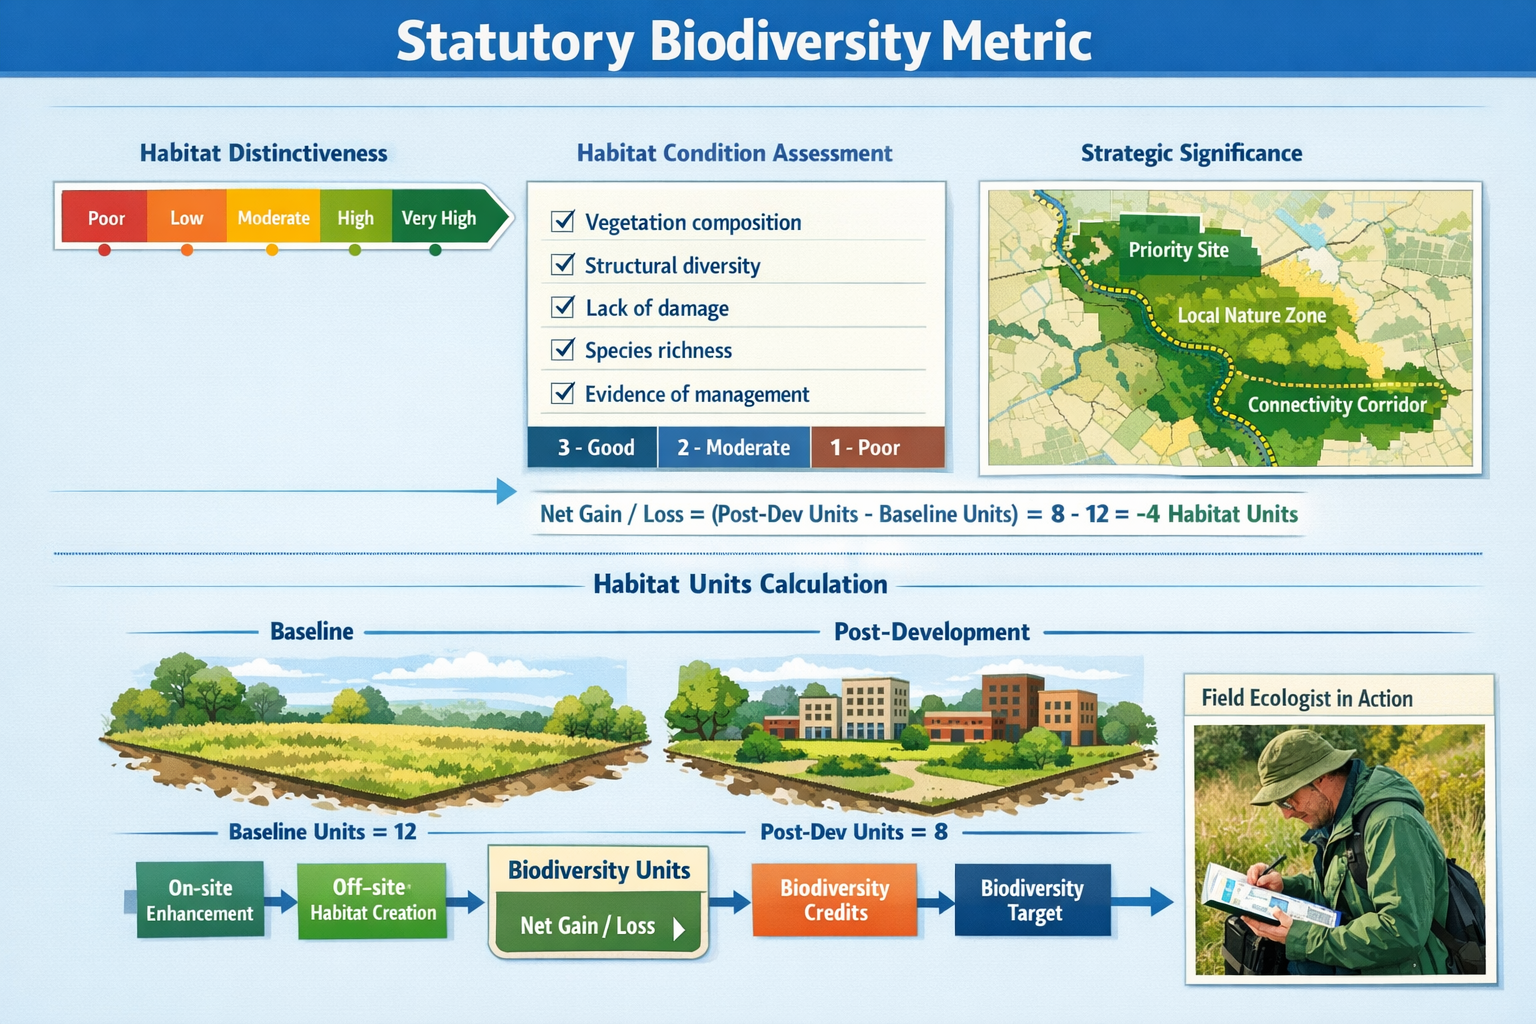
- 🎯 The Statutory Biodiversity Metric remains the primary official tool for calculating biodiversity value, measuring habitat distinctiveness, condition, and strategic significance[1]
- 📊 Modern rewilding measurement extends beyond species counts to include trophic complexity, ecological function metrics, and resilience indicators
- 🔬 Baseline monitoring before interventions is essential for establishing meaningful comparison points against which restoration success can be measured[5]
- 🌍 The Rewilding Monitoring Framework currently in development will provide standardized guidance for measuring rewilding outcomes across diverse project types[5]
- ⚖️ Ecologists apply the mitigation hierarchy (avoid-mitigate-compensate) through the metric framework when designing habitat creation and enhancement measures[2]
Understanding the Statutory Framework for Rewilding Metrics and Measurement in BNG Projects
The Environment Act 2021 established a mandatory framework requiring developments to demonstrate measurable biodiversity improvements. At the heart of this system sits the Statutory Biodiversity Metric—a habitat-based calculation tool that quantifies biodiversity value before development and ensures at least a 10% net gain post-development[1].
The Two-Tier Metric System
As of 2026, two distinct metric tools operate within the BNG framework:
1. The Statutory Biodiversity Metric (Full Version)
This comprehensive tool applies to major developments and provides detailed calculations across multiple habitat types. The metric evaluates three primary components:
- Habitat Distinctiveness: Categorizes habitats from "very low" to "very high" based on their rarity and ecological value
- Habitat Condition: Assesses the quality and functionality of existing habitats using standardized criteria
- Strategic Significance: Considers location-specific factors including connectivity to nature recovery networks and local conservation priorities
2. The Small Sites Metric (SSM)
Introduced specifically for smaller developments, the SSM offers a simplified calculation approach while maintaining the core principles of the full metric[6]. Though it doesn't include an off-site section within the tool itself, projects using the SSM can still purchase off-site biodiversity units when needed[6].
How the Metric Calculates Biodiversity Units
The fundamental calculation follows this formula:
Biodiversity Units = Habitat Area × Distinctiveness × Condition × Strategic Significance
For example, a 2-hectare site containing moderate distinctiveness grassland in good condition within a strategic location might generate:
2 ha × 4 (distinctiveness score) × 2.5 (condition score) × 1.15 (strategic multiplier) = 23 biodiversity units
To achieve 10% net gain, the post-development site must deliver at least 25.3 biodiversity units through habitat retention, enhancement, or creation.
Understanding how to conduct a biodiversity impact assessment is crucial for developers navigating these calculations effectively.
Beyond Habitat Area: Measuring Ecological Function and Trophic Complexity
While the Statutory Biodiversity Metric provides the regulatory foundation, cutting-edge rewilding science recognizes that true ecological restoration extends far beyond simple habitat area calculations. Ecologists increasingly focus on functional metrics that capture how ecosystems actually work.
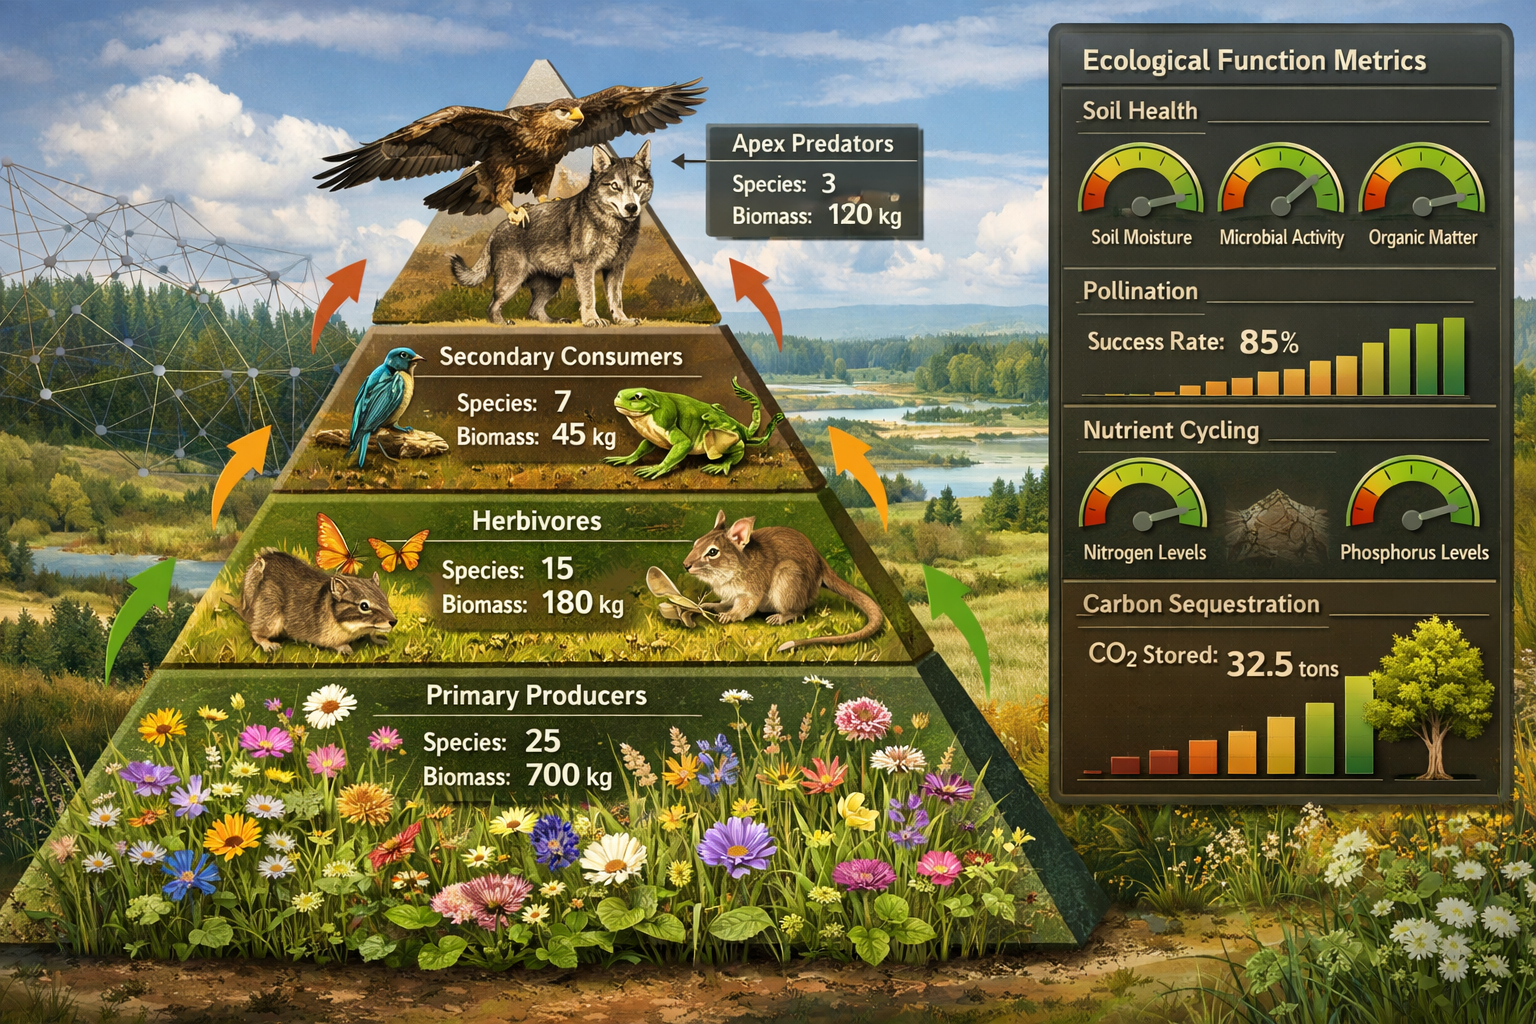
Trophic Complexity Indicators
Trophic complexity refers to the richness and connectivity of food web relationships within an ecosystem. Measuring this aspect reveals whether a restored site supports complete ecological communities rather than just isolated species.
Key trophic metrics include:
Food Chain Length 🔗
- Number of trophic levels present (producers → herbivores → predators → apex predators)
- Presence of apex predators indicates ecosystem maturity
- Longer food chains typically signal greater ecosystem stability
Functional Group Diversity 🦋
- Representation across ecological roles (pollinators, decomposers, seed dispersers, predators)
- Functional redundancy (multiple species performing similar ecological roles)
- Specialist vs. generalist species ratios
Interaction Network Density 🕸️
- Number and strength of species interactions
- Mutualistic relationships (plant-pollinator partnerships)
- Predator-prey dynamics and population regulation
Ecological Function Metrics
Rewilding success depends on restoring ecological processes, not just species presence. Functional metrics assess whether ecosystems are "doing" what healthy systems should do:
| Ecological Function | Measurement Approach | Success Indicators |
|---|---|---|
| Nutrient Cycling | Soil testing, decomposition rates, litter breakdown studies | Increased organic matter, balanced N:P ratios, active decomposer communities |
| Pollination Services | Pollinator visitation rates, fruit set measurements, pollen transfer efficiency | Diverse pollinator assemblages, high pollination success rates |
| Natural Pest Control | Predator-prey ratios, pest population monitoring, biocontrol effectiveness | Balanced herbivore populations, presence of natural enemies |
| Soil Formation | Soil depth measurements, aggregate stability, bioturbation indicators | Increasing soil depth, improved structure, active soil fauna |
| Hydrological Function | Water infiltration rates, surface runoff measurements, groundwater recharge | Enhanced water retention, reduced flooding, cleaner water discharge |
These functional assessments provide evidence that rewilding interventions are creating self-sustaining ecosystems rather than simply establishing plant communities that require ongoing management.
For projects seeking to achieve 10% biodiversity net gain, incorporating functional metrics alongside statutory calculations demonstrates genuine ecological improvement.
Implementing Comprehensive Monitoring Protocols for Rewilding Measurement
Effective measurement requires systematic monitoring protocols that capture change over time. The emerging Rewilding Monitoring Framework being developed by Rewilding Britain provides structured guidance for this essential work[5].
Establishing Baseline Conditions
Before any restoration intervention begins, ecologists must establish comprehensive baseline measurements[5]. This baseline serves as the reference point against which all future changes are measured.
Essential baseline data includes:
- Habitat mapping: Detailed spatial distribution of vegetation communities using UK Hab classification
- Species inventories: Comprehensive surveys across taxonomic groups (plants, invertebrates, birds, mammals)
- Soil assessments: Nutrient levels, pH, organic matter content, compaction, microbial activity
- Hydrological conditions: Water table levels, flow patterns, water quality parameters
- Structural diversity: Vegetation height variation, dead wood volumes, microhabitat availability
Temporal Monitoring Frameworks
Rewilding operates across multiple timescales. Effective monitoring protocols must capture both short-term establishment success and long-term trajectory toward mature ecosystems.
Year 1-3: Establishment Phase 📅
- Quarterly vegetation surveys to track colonization patterns
- Monthly water quality monitoring in aquatic restoration sites
- Seasonal bird breeding surveys
- Annual soil condition assessments
Year 4-10: Development Phase 🌱
- Biannual comprehensive habitat condition assessments
- Annual breeding bird surveys and winter bird counts
- Butterfly and pollinator transects (April-September)
- Every 2-3 years: detailed invertebrate sampling, bat activity surveys, small mammal trapping
Year 10+: Maturation Phase 🌳
- Annual habitat condition monitoring
- Five-year comprehensive biodiversity audits
- Long-term trend analysis for key indicator species
- Functional metric reassessment
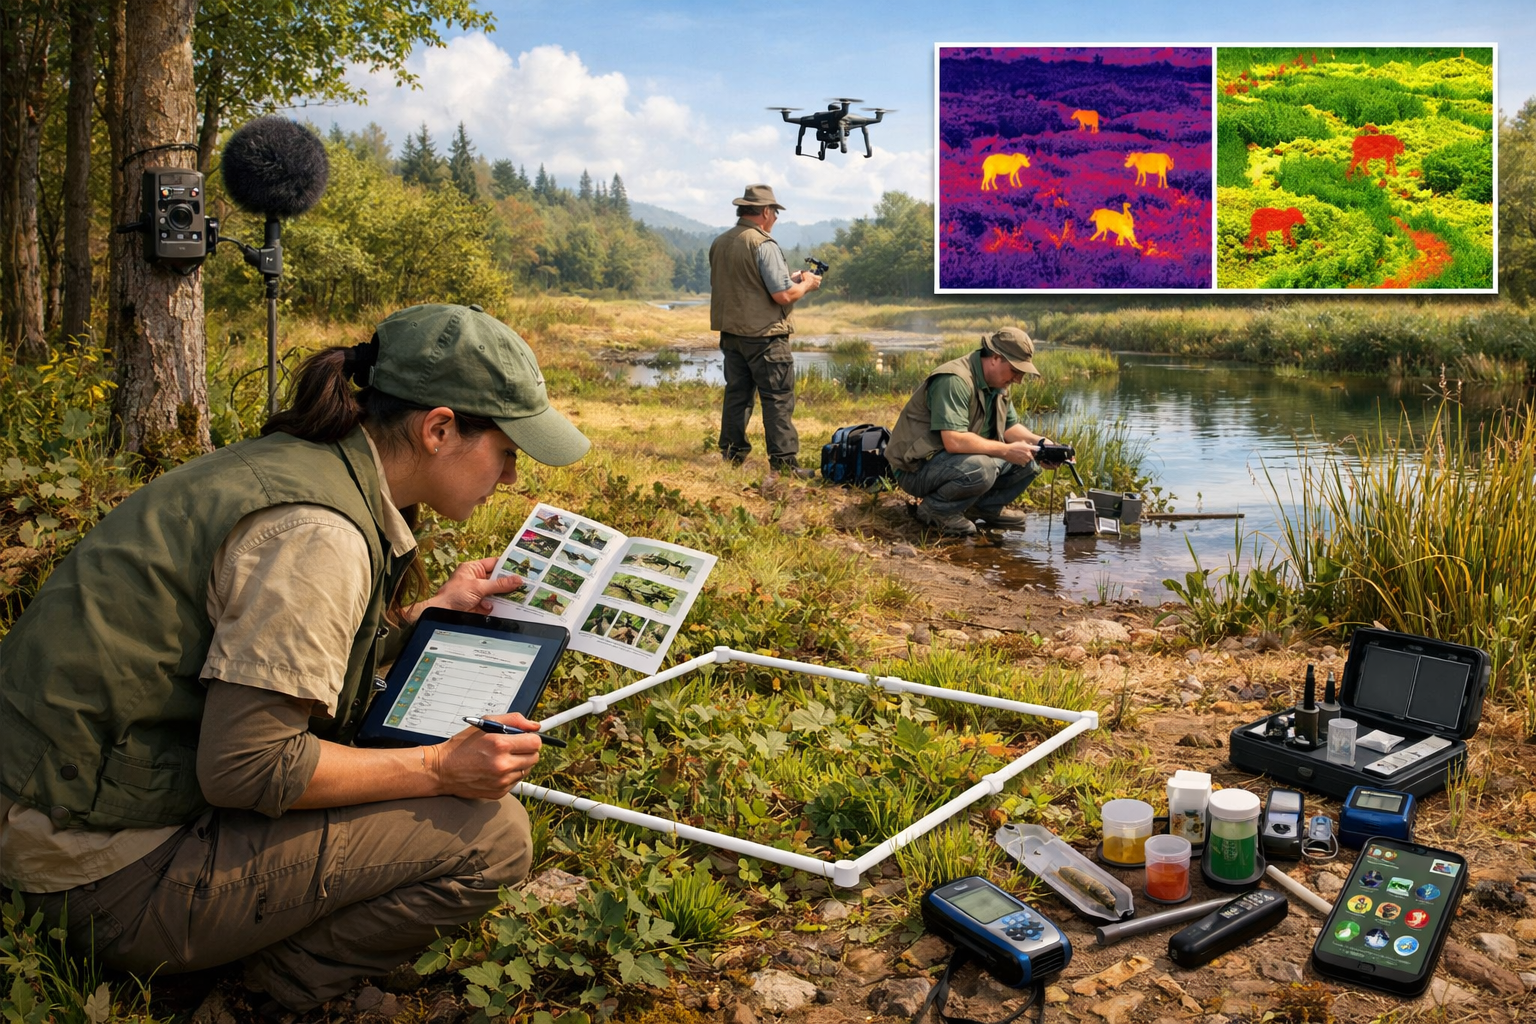
Technology-Enhanced Monitoring Approaches
Modern rewilding measurement increasingly incorporates technological tools that improve data quality while reducing survey effort:
Remote Sensing Technologies 🛰️
- Satellite imagery analysis for vegetation health (NDVI indices)
- Drone-based habitat mapping and structural assessments
- LiDAR for precise topographic and vegetation structure data
- Thermal imaging for mammal detection and population estimation
Automated Recording Systems 📹
- Camera traps for continuous wildlife monitoring
- Acoustic recorders capturing bird song and bat echolocation
- Environmental DNA (eDNA) sampling for aquatic and terrestrial species detection
- Continuous water quality sensors
Data Integration Platforms 💻
- GIS-based spatial analysis combining multiple data layers
- Statistical modeling for population trend analysis
- Machine learning algorithms for species identification from images and sound
- Cloud-based data repositories enabling long-term dataset management
Understanding what is in a biodiversity net gain assessment helps contextualize how these monitoring approaches feed into formal BNG reporting requirements.
Resilience Metrics: Measuring Ecosystem Robustness
Perhaps the most sophisticated aspect of modern rewilding measurement involves assessing ecosystem resilience—the capacity of restored systems to withstand disturbances and maintain functionality.
Key Resilience Indicators
Response Diversity 🎭
Measures whether multiple species within functional groups respond differently to environmental stressors. High response diversity means that if one species declines due to drought, temperature change, or disease, others can maintain ecosystem function.
Connectivity and Spatial Resilience 🗺️
Assesses how well restored sites connect to surrounding habitats, enabling:
- Species movement and genetic exchange
- Recolonization after local extinctions
- Climate change adaptation through range shifts
Ecologists measure connectivity using landscape-scale analysis tools that evaluate:
- Habitat patch size and configuration
- Corridor quality and permeability
- Dispersal distance requirements for key species
Recovery Capacity ⚡
Monitors how quickly ecosystems return to baseline conditions following disturbances such as:
- Extreme weather events (flooding, drought, heatwaves)
- Disease outbreaks
- Herbivore pressure fluctuations
Sites with high recovery capacity demonstrate:
- Rapid vegetation regrowth following disturbance
- Stable species composition despite environmental variation
- Maintained ecosystem services during stress periods
Applying the Mitigation Hierarchy
Within BNG projects, ecologists apply resilience thinking through the mitigation hierarchy—a framework that prioritizes avoiding impacts over compensating for them[2].
The hierarchy operates in this order:
- Avoid: Design developments to prevent biodiversity loss (retaining high-value habitats)
- Minimize: Reduce unavoidable impacts through careful planning (timing works to avoid breeding seasons)
- Restore: Rehabilitate degraded habitats on-site
- Offset: Create or enhance habitats off-site to compensate for residual losses
When designing habitat creation measures aligned to the 10% net gain requirement, ecologists incorporate resilience principles by:
- Creating habitat mosaics rather than monocultures
- Establishing connectivity corridors linking isolated patches
- Using locally-sourced, genetically diverse plant materials
- Designing for climate change adaptation (species selection for future conditions)
For developers working on small development projects, understanding how resilience metrics influence habitat design can significantly improve long-term BNG outcomes.
Challenges and Future Directions in Rewilding Metrics
Despite significant advances, measuring rewilding success faces ongoing challenges that the ecological community continues to address.
Scaling Challenges for Large Infrastructure Projects
The site-based metric approach faces particular difficulties when applied to Nationally Significant Infrastructure Projects (NSIPs) and landscape-scale developments[4]. The introduction of mandatory BNG for NSIPs was delayed from November 2025 to May 2026, partly reflecting these complexities[6].
Challenges include:
- Spatial heterogeneity: Large projects span multiple habitat types requiring extensive survey effort
- Temporal mismatches: Infrastructure timelines may not align with ecological succession rates
- Cumulative impact assessment: Difficulty capturing interactions between multiple developments
- Baseline shifting: Long project timelines mean baseline conditions may change before implementation
Addressing these requires early engagement, flexible approaches, and transparent assumptions about how metrics scale across landscapes[4].
Proposed Metric Simplifications and Concerns
In December 2025, Defra consulted on proposals to exempt minor developments and simplify metrics for medium-sized projects[1]. While intended to reduce administrative burden, these proposals faced criticism from the Leverhulme Centre for Nature Recovery for potentially weakening ecological outcomes[1].
The tension highlights a fundamental challenge: balancing practical feasibility with ecological rigor. Overly complex metrics may discourage participation, while oversimplified approaches risk delivering minimal genuine biodiversity benefit.
Emerging Frameworks and Standardization
The Rewilding Monitoring Framework currently being trialled with members of the Rewilding Network represents an important step toward standardization[5]. This framework aims to provide:
- Consistent measurement protocols across diverse project types
- Guidance on appropriate monitoring intensity for different scales
- Standardized indicators enabling cross-project comparison
- Integration pathways connecting rewilding metrics with statutory BNG requirements
As this framework develops and becomes publicly available, it will likely influence how ecologists approach measurement in both dedicated rewilding projects and BNG-driven restoration.
Practical Implementation: From Metrics to Management
Understanding measurement frameworks is only valuable when translated into actionable management decisions. Successful BNG projects integrate monitoring data into adaptive management cycles.
Adaptive Management Loops
Effective rewilding measurement operates within an adaptive management framework:
- Plan: Set clear, measurable objectives based on baseline conditions
- Implement: Execute restoration interventions according to design
- Monitor: Collect data using standardized protocols
- Evaluate: Compare results against objectives and predictions
- Adapt: Adjust management based on monitoring findings
- Repeat: Continue the cycle with refined approaches
This iterative process allows ecologists to:
- Identify interventions that aren't achieving desired outcomes
- Detect unexpected ecological responses (positive or negative)
- Refine restoration techniques based on empirical evidence
- Demonstrate genuine improvement to regulators and stakeholders
Reporting and Verification
Projects using the Small Sites Metric must submit completed metrics to planning authorities as part of their biodiversity gain plan[6]. For all BNG projects, transparent reporting should include:
Quantitative Data 📊
- Biodiversity unit calculations (baseline, post-development, net change)
- Species richness and abundance trends
- Habitat condition scores over time
- Functional metric measurements
Qualitative Assessment 📝
- Narrative descriptions of ecological change
- Photographic documentation showing habitat development
- Case-specific success stories and challenges
- Expert ecological interpretation of trends
Verification Mechanisms ✅
- Third-party ecological audits
- Compliance with registered BNG commitments
- Integration with local nature recovery strategies
- Long-term monitoring commitments (typically 30 years)
For landowners interested in creating BNG sites, understanding these reporting requirements is essential—explore guidance on selling biodiversity units for detailed information.
Integrating Rewilding Metrics with Broader Conservation Goals
The most successful BNG projects don't operate in isolation but connect to wider conservation priorities and landscape-scale ecological networks.
Alignment with Nature Recovery Networks
England's emerging Nature Recovery Networks provide strategic frameworks for connecting habitats across landscapes. When measuring rewilding success, ecologists increasingly evaluate:
- Contribution to connectivity: Does the site enhance landscape permeability for target species?
- Strategic positioning: Does restoration align with local nature recovery strategies?
- Complementarity: How does the site interact with surrounding conservation areas?
This landscape-scale perspective ensures individual BNG projects contribute to coherent ecological networks rather than creating isolated habitat fragments.
Multi-Benefit Assessment
Modern rewilding measurement recognizes that ecological restoration delivers multiple benefits beyond biodiversity. Comprehensive assessment frameworks increasingly incorporate:
Climate Regulation 🌍
- Carbon sequestration and storage
- Microclimate regulation
- Flood risk reduction
Cultural Services 🎨
- Recreation and access opportunities
- Educational value
- Aesthetic and spiritual benefits
- Cultural heritage connections
Economic Benefits 💷
- Enhanced property values
- Sustainable land-based enterprises (nature tourism, sustainable forestry)
- Reduced management costs through self-sustaining ecosystems
- Pollination services supporting agriculture
Projects that demonstrate these co-benefits alongside biodiversity gains often secure stronger stakeholder support and long-term protection.
Developers seeking comprehensive approaches should review how to create a biodiversity plan that incorporates these multiple dimensions.
Conclusion: The Future of Rewilding Metrics and Measurement in BNG Projects
As England's mandatory BNG framework matures in 2026 and beyond, the science of measuring rewilding success continues to evolve. The 112 off-site projects registered by September 2025 represent just the beginning of what will become a substantial national restoration effort[1].
Key principles for effective measurement include:
✅ Use statutory metrics as the foundation but recognize their limitations in capturing full ecological complexity
✅ Incorporate functional and resilience metrics alongside habitat-based calculations to assess genuine ecosystem recovery
✅ Establish comprehensive baselines before interventions to enable meaningful change detection
✅ Implement adaptive management that uses monitoring data to refine restoration approaches
✅ Connect site-level metrics to landscape-scale conservation priorities and nature recovery networks
✅ Embrace emerging technologies that enhance data quality while reducing survey costs
✅ Maintain long-term commitment recognizing that ecological succession operates across decades
Next Steps for Practitioners
For Developers:
- Engage ecological consultants early in project planning to integrate BNG from the outset
- Review 8 biodiversity net gain points on planning your project for strategic guidance
- Consider on-site and off-site delivery options based on site constraints and opportunities
For Landowners:
- Explore opportunities to create BNG habitat sites that generate long-term income streams
- Understand baseline assessment requirements before committing to habitat creation
- Connect with BNG registers and brokers to access the developing market
For Ecologists:
- Stay current with evolving metric versions and guidance updates
- Develop expertise in functional assessment approaches beyond statutory requirements
- Participate in knowledge-sharing networks to refine best practices
The measurement frameworks described in this guide provide the essential tools for quantifying restoration success. When applied rigorously and combined with ecological expertise, these metrics ensure that BNG projects deliver genuine, lasting improvements to England's natural environment—creating landscapes where both nature and people can thrive.
References
[1] Bng Explainer Final 1 – https://naturerecovery.ox.ac.uk/wp-content/uploads/2025/12/BNG-explainer-final-1.pdf
[2] Bng Case Studies – https://acp-consultants.com/biodiversity-net-gain/bng-case-studies/
[3] The Ultimate Guide To Biodiversity Net Gain A 2025 Perspective – https://www.bng.ai/blog/the-ultimate-guide-to-biodiversity-net-gain-a-2025-perspective/
[4] Challenges Of Biodiversity Net Gain At Landscape Scale – https://www.landuse.co.uk/thoughts/challenges-of-biodiversity-net-gain-at-landscape-scale/
[5] Measuring And Monitoring Rewilding – https://www.rewildingbritain.org.uk/how-to-rewild/rewilding-advice/measuring-and-monitoring-rewilding
[6] Biodiversity Metric Calculate The Biodiversity Net Gain Of A Project Or Development – https://www.gov.uk/guidance/biodiversity-metric-calculate-the-biodiversity-net-gain-of-a-project-or-development
[7] Rewilding Methodology – https://www.mossy.earth/methodologies/rewilding-methodology
