
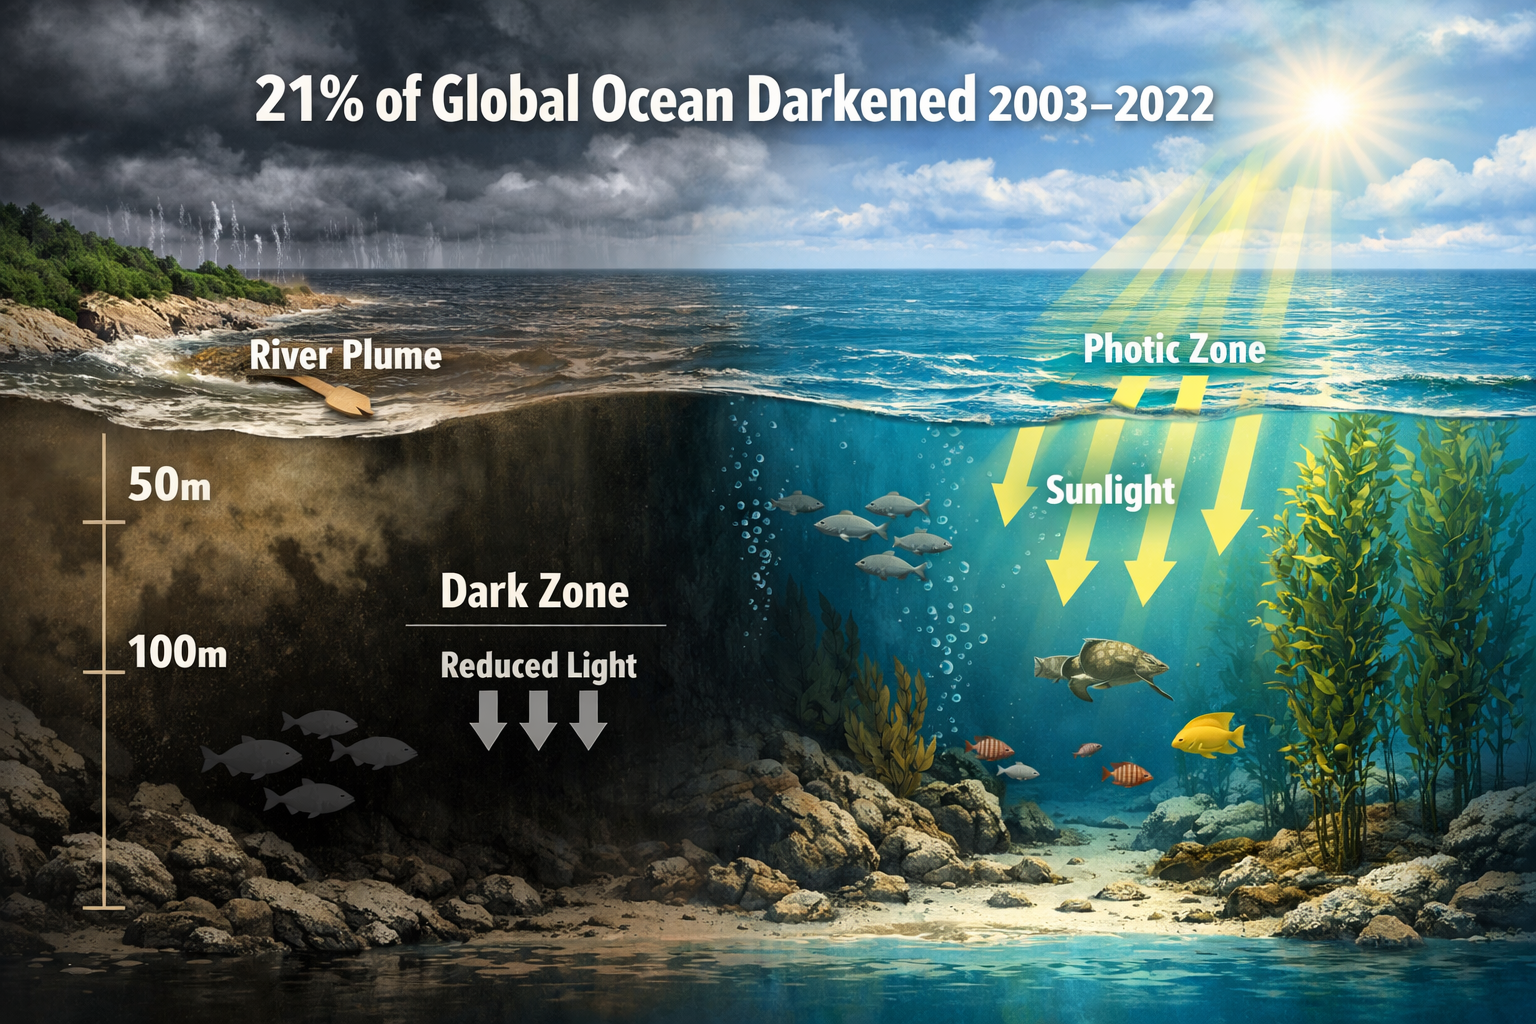
The ocean's depths are growing darker at an alarming rate, and marine ecology surveyors face an unprecedented challenge. Over 21% of the global ocean—exceeding 75 million square kilometers—experienced significant darkening between 2003 and 2022.[1] This phenomenon isn't just a curiosity for scientists; it represents a fundamental shift in marine ecosystems that demands immediate attention from ecology professionals conducting surveys for biodiversity assessments and conservation projects.
Understanding Ocean Darkening Impacts on Marine Surveys: 2026 Protocols for Ecology Surveyors has become essential for professionals working in coastal development, marine conservation, and environmental impact assessments. As underwater light penetration decreases, traditional survey methodologies must adapt to capture accurate baseline data in these changing conditions.
Key Takeaways
- 🌊 Over 21% of global oceans have experienced significant darkening since 2003, with photic zones shrinking by more than 50 meters in areas equivalent to the size of Africa[1]
- 📊 Marine darkwaves—sudden episodes of underwater darkness—can last from days to months, severely impacting photosynthesis in kelp forests, seagrass, and coral ecosystems[2]
- 🔬 New standardized frameworks introduced in 2026 provide ecology surveyors with consistent methods to measure and track extreme reductions in underwater light[2][5]
- 🎯 Updated survey protocols are critical for establishing accurate baseline data in darkening zones to support marine Biodiversity Net Gain (BNG) projects
- ⚡ Rapid response monitoring techniques help surveyors identify when marine ecosystems face acute stress from light threshold crossings[5]
Understanding Ocean Darkening and Marine Darkwaves
What Is Ocean Darkening?
Ocean darkening refers to the reduction in light penetration through marine waters, affecting the photic zone—the sunlit layer crucial for supporting approximately 90% of marine life.[1] This phenomenon occurs through two distinct mechanisms: gradual long-term darkening and sudden acute events called marine darkwaves.
The scale of this environmental change is staggering. In approximately 9% of the ocean (equivalent to the size of Africa), photic zones have shrunk by more than 50 meters.[1][4] Even more dramatically, in 2.6% of the ocean, light penetration has dropped by over 100 meters, representing catastrophic habitat loss for light-dependent species.[1]
Marine darkwaves are sudden, intense episodes of underwater darkness lasting from days to months. These events differ fundamentally from gradual darkening trends. According to research published in Communications Earth & Environment in January 2026, marine darkwaves are caused by:[2][3]
- Storm events that stir up sediment and increase water turbidity
- River-driven sediment plumes following heavy rainfall
- Algal blooms that block light penetration
- Suspended particulate matter from coastal erosion
Monitoring data reveals that up to 80 marine darkwaves have occurred along New Zealand's East Cape coast since 2002, with most linked to storms and sediment discharge.[3]
The Ecological Consequences
François Thoral, lead researcher from the University of Waikato and Earth Sciences New Zealand, emphasized the significance: "Light is a fundamental driver of marine productivity, yet until now we have not had a consistent way to measure extreme reductions in underwater light."[2]
Even brief periods of reduced light can:
- ⚠️ Impair photosynthesis in kelp forests, seagrass meadows, and coral reefs
- 🐟 Alter behavior patterns of fish, sharks, and marine mammals
- 🦐 Disrupt food web dynamics from primary producers to apex predators
- 🌿 Reduce habitat quality for species dependent on visual cues
The 2023 Cyclone Gabrielle demonstrated these impacts dramatically. The storm delivered vast amounts of sediment to coastal waters, creating prolonged underwater darkness over large areas and smothering many reef ecosystems.[3]
For ecology surveyors conducting biodiversity impact assessments, understanding these dynamics is crucial for accurate baseline data collection.
Ocean Darkening Impacts on Marine Surveys: Updated Field Techniques
Adapting Light Penetration Surveys for 2026
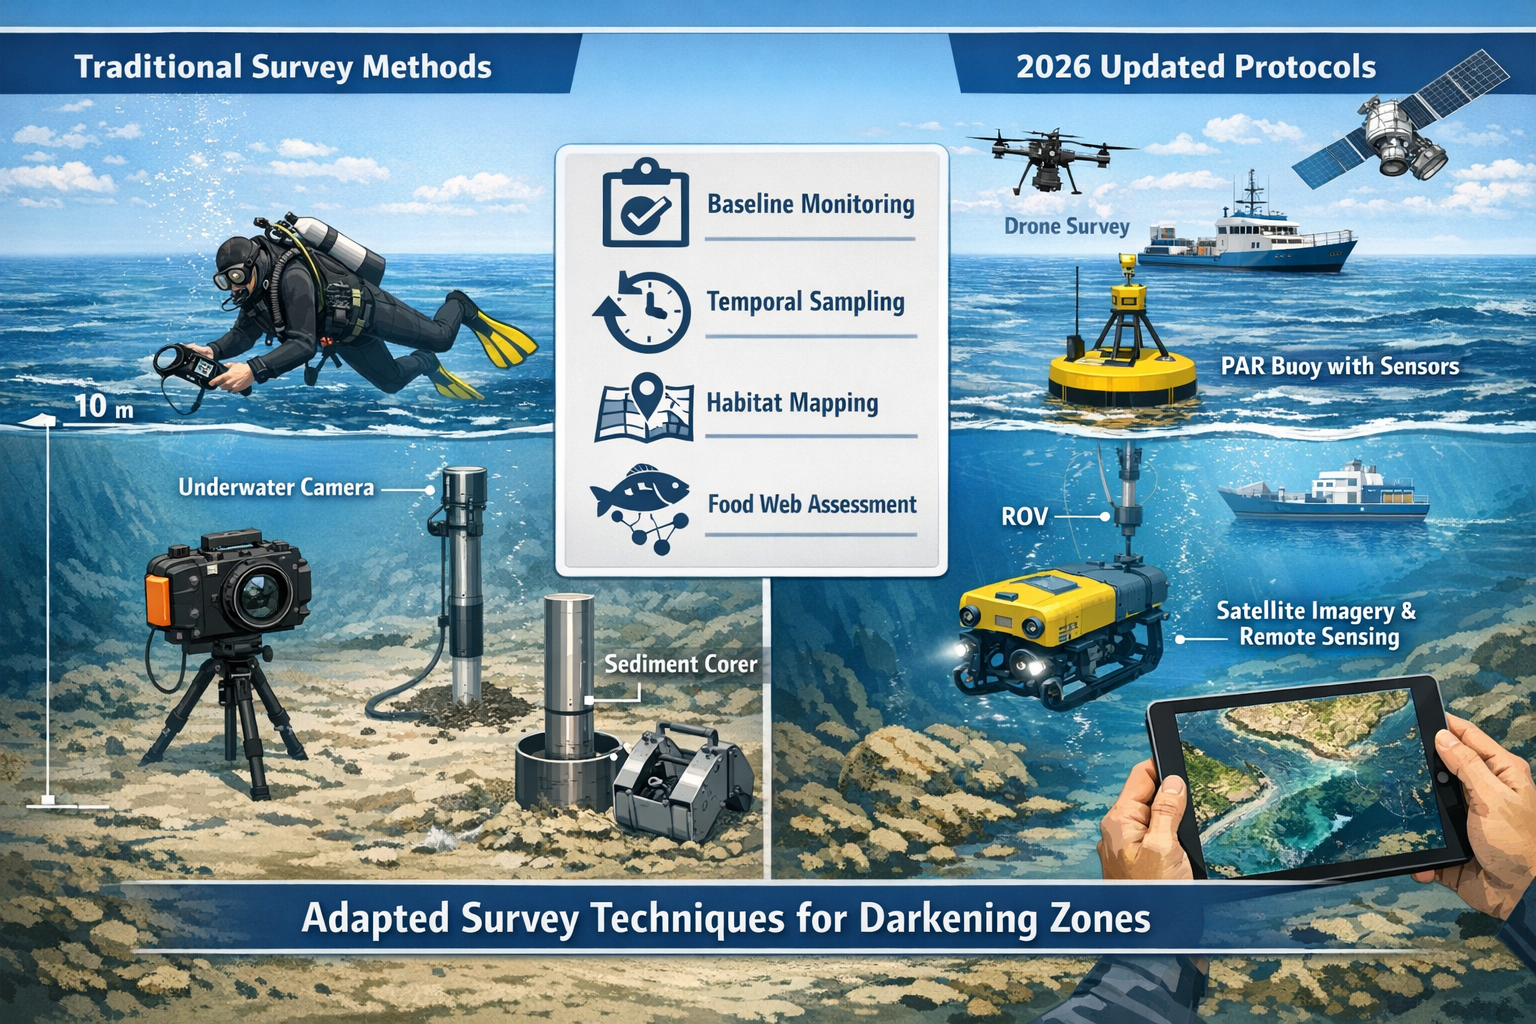
Traditional marine survey protocols were designed for relatively stable light conditions. The emergence of ocean darkening as a widespread phenomenon requires fundamental adaptations to field methodology. The 2026 standardized framework for identifying marine darkwaves provides ecology surveyors with critical tools for measuring underwater light dynamics.[2][5]
Essential Equipment Updates
Modern marine surveys in darkening zones require:
| Equipment Type | Traditional Use | 2026 Enhancement |
|---|---|---|
| PAR Sensors | Single-point measurements | Continuous monitoring arrays with data logging |
| Secchi Disks | Visual depth estimates | Digital imaging with AI-enhanced analysis |
| Turbidity Meters | Spot checks | Real-time multi-depth profiling systems |
| Underwater Cameras | Species documentation | Low-light capable sensors with spectral analysis |
| Satellite Data | Occasional reference | Integrated temporal monitoring for darkwave prediction |
Baseline Data Collection Protocols
Establishing accurate baseline conditions in potentially darkening zones requires temporal resolution that traditional surveys often lack. The new protocols recommend:
- Multi-season sampling: Conduct surveys across at least three seasons to capture natural light variation and identify darkwave events
- Depth-stratified measurements: Record light penetration at 10-meter intervals to precisely map photic zone boundaries
- Weather-corrected data: Document meteorological conditions and adjust measurements for storm-related turbidity
- Historical comparison: Utilize satellite data archives to establish 5-10 year light penetration trends[5]
Monitoring Affected Food Webs
Ocean darkening fundamentally alters marine food webs by reducing primary productivity in the photic zone. Ecology surveyors must now incorporate food web assessment into standard survey protocols to support biodiversity net gain projects.
Primary Producer Assessment
Photosynthetic organisms form the foundation of marine food webs. Survey protocols should include:
- Kelp forest density mapping: Measure canopy coverage, biomass per square meter, and depth distribution changes
- Seagrass meadow health indicators: Document shoot density, blade length, and epiphyte loading
- Phytoplankton sampling: Collect water samples at multiple depths for chlorophyll-a analysis
- Benthic algae surveys: Quantify coverage and species composition on hard substrates
"The framework provides a standardized tool for coastal communities, resource managers, and conservation groups to identify when marine ecosystems face acute stress, enabling discrete periods when light thresholds critical for ecosystem function are crossed."[5]
Secondary and Tertiary Consumer Monitoring
Changes in light penetration cascade through trophic levels. Updated survey techniques include:
- Visual census methods adapted for low-light conditions using enhanced imaging
- Behavioral observation protocols documenting feeding pattern changes
- Gut content analysis of key species to track dietary shifts
- Acoustic monitoring for species that may relocate from darkened zones
Temporal Sampling Strategies
Marine darkwaves can occur suddenly and persist for varying durations. The 2026 protocols emphasize rapid response monitoring capabilities:[2][3]
Pre-Event Baseline Establishment
- Deploy continuous monitoring equipment in high-risk coastal areas
- Establish trigger thresholds for darkwave identification
- Create reference datasets during clear-water conditions
During-Event Documentation
- Implement safety protocols for survey work in storm-affected areas
- Use remote sensing where direct access is limited
- Document spatial extent and intensity of darkening
Post-Event Recovery Tracking
- Monitor photic zone restoration timelines
- Assess ecosystem recovery rates
- Document species recolonization patterns
These approaches align with broader guidance for developers working on coastal projects where marine impacts must be assessed.
Ocean Darkening Impacts on Marine Surveys: Supporting BNG Marine Projects
Integrating Darkening Data into Biodiversity Net Gain Assessments
Marine Biodiversity Net Gain (BNG) projects require accurate baseline assessments and credible impact predictions. Ocean darkening introduces complexity that traditional BNG methodologies may not adequately address. Ecology surveyors must now incorporate light penetration dynamics into their assessment frameworks.
Baseline Condition Assessment in Darkening Zones
Establishing pre-development baseline conditions requires understanding both current light conditions and darkening trends:
Habitat Quality Metrics
- Current photic zone depth and extent
- Historical light penetration trends (5-10 year dataset)
- Frequency and intensity of marine darkwave events
- Recovery rates following darkening episodes
Species Assemblage Documentation
- Light-dependent species presence and abundance
- Depth distribution patterns relative to photic zone boundaries
- Indicator species for ecosystem health under varying light conditions
- Functional diversity metrics affected by light availability
The complexity of these assessments mirrors challenges faced in terrestrial environments, where professionals must conduct comprehensive biodiversity impact assessments accounting for multiple environmental stressors.
Predicting Development Impacts in Context of Ocean Darkening
Coastal development projects may exacerbate ocean darkening through:
- Increased sediment runoff from construction activities
- Altered hydrodynamics affecting sediment transport
- Nutrient loading potentially triggering algal blooms
- Physical disturbance resuspending bottom sediments
Impact Assessment Framework for 2026
| Impact Category | Assessment Method | Darkening Context |
|---|---|---|
| Construction Phase | Sediment plume modeling | Cumulative effects with natural darkwave frequency |
| Operational Phase | Long-term turbidity monitoring | Contribution to regional darkening trends |
| Habitat Loss | Photic zone contraction mapping | Direct + indirect light reduction impacts |
| Species Displacement | Movement tracking studies | Combined stress from development + darkening |
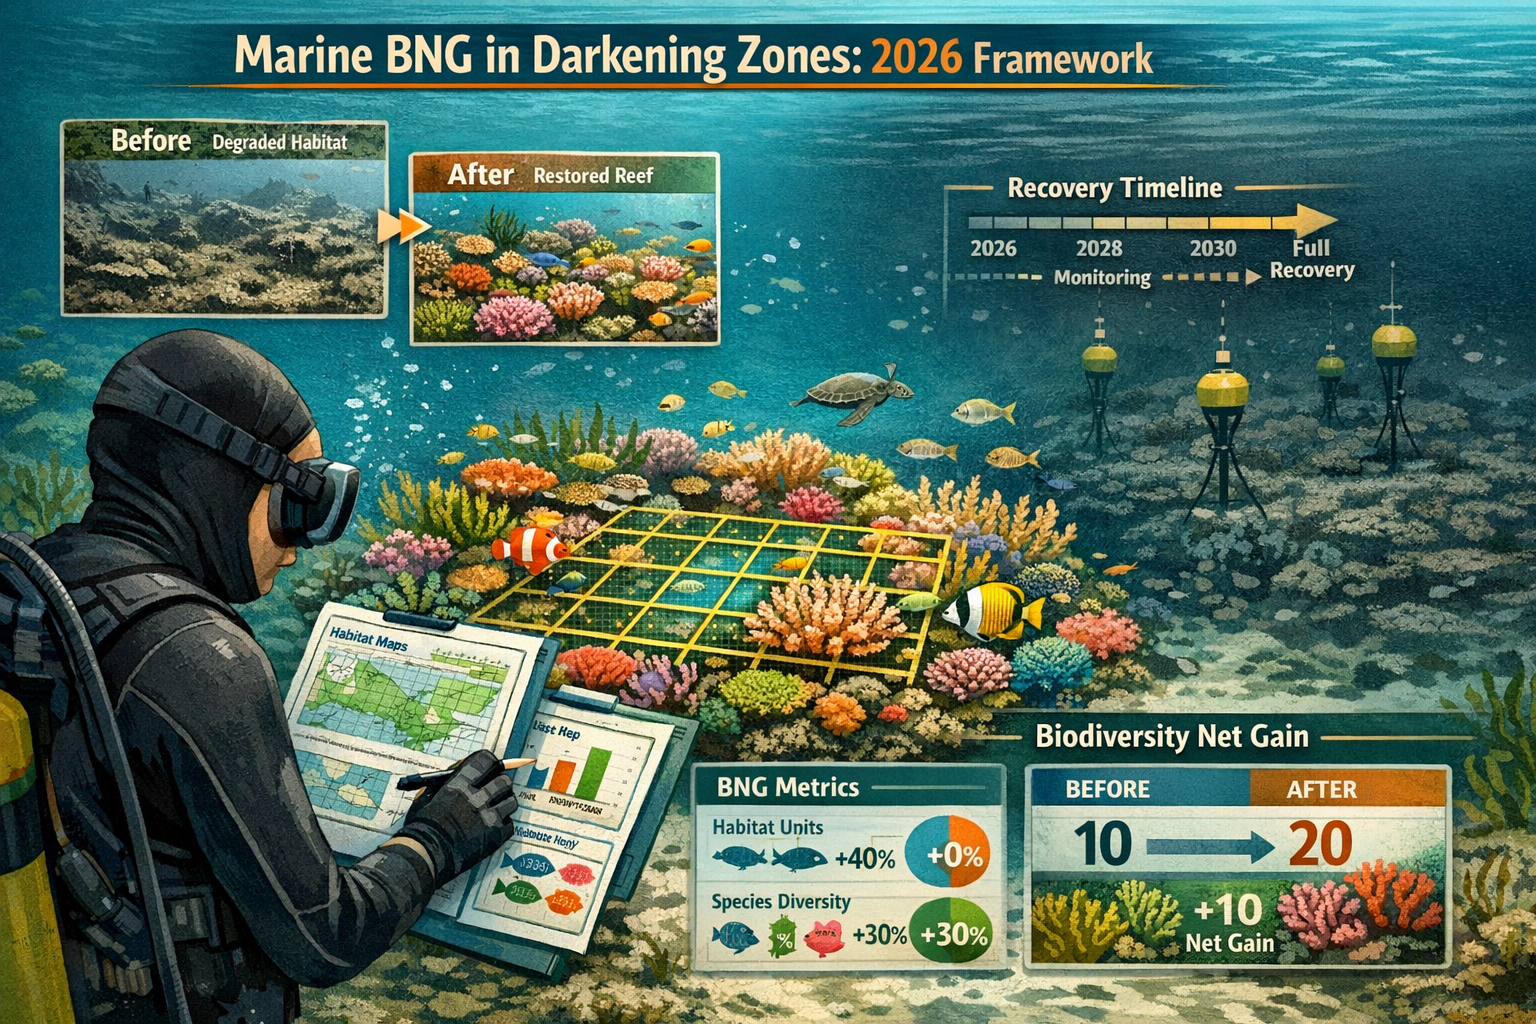
Designing Effective Marine BNG Interventions
Compensatory habitat creation and enhancement must account for ocean darkening dynamics to ensure long-term success. The 2026 protocols recommend:
Site Selection Criteria
- ✅ Areas with stable or improving light penetration trends
- ✅ Locations buffered from major sediment sources
- ✅ Depths within projected future photic zone boundaries
- ✅ Hydrodynamic conditions favoring water clarity
Enhancement Strategies Adapted for Darkening Conditions
- Sediment management: Implement catchment-level erosion control
- Depth optimization: Position habitats higher in water column to maintain light access
- Species selection: Prioritize organisms tolerant of variable light conditions
- Adaptive management triggers: Establish light-based thresholds for intervention
Monitoring and Verification
BNG projects require long-term monitoring to verify success. In darkening-affected areas, this must include:
- Continuous light penetration monitoring at restoration sites
- Photographic documentation of habitat development
- Species colonization tracking relative to light conditions
- Comparative analysis with reference sites in similar light environments
These approaches ensure that marine BNG projects deliver genuine biodiversity gains despite changing ocean conditions, supporting the broader goals of benefitting nature and developers.
Regional Variations and Hotspot Identification
Global Patterns of Ocean Darkening
While over 21% of global oceans have experienced darkening, the phenomenon is not uniform. Approximately 10% of the ocean has actually become lighter, illustrating complex regional variability.[1] Ecology surveyors must understand these patterns to contextualize local observations.
High-Risk Darkening Zones:
- 🌍 Coastal areas with high sediment discharge
- 🌊 Regions experiencing increased storm frequency
- 🏞️ Waters adjacent to deforested or developed catchments
- 🌡️ Areas with warming-induced stratification changes
Stabilizing or Lightening Zones:
- Areas with improved land management reducing erosion
- Regions with declining nutrient inputs
- Waters benefiting from climate-driven circulation changes
Case Study: New Zealand Coastal Waters
New Zealand's East Cape provides valuable insights for developing survey protocols. The region has experienced up to 80 marine darkwaves since 2002, offering extensive data on darkwave characteristics and ecosystem responses.[3]
Key Lessons for Surveyors:
- Storm-driven darkwaves can persist for weeks to months
- Reef ecosystems show varying recovery rates depending on darkwave intensity
- Baseline data collected during clear-water periods may not represent average conditions
- Continuous monitoring reveals darkwave frequency patterns invisible to snapshot surveys
Applying Regional Knowledge to Local Surveys
Ecology surveyors should:
- Research regional darkening trends using satellite data archives and published studies
- Consult local monitoring programs for historical darkwave frequency data
- Engage with coastal communities who may have observed long-term changes
- Integrate climate projections suggesting future storm frequency or rainfall patterns
This regional contextualization strengthens the credibility of survey findings and supports robust biodiversity planning.
Technology and Tools for 2026 Marine Surveys
Remote Sensing Integration
Satellite-based ocean color monitoring provides critical data for identifying and tracking marine darkwaves. The 2026 protocols emphasize integrating remote sensing with in-situ measurements:[5]
Available Satellite Products:
- Chlorophyll-a concentration maps indicating algal bloom darkwaves
- Turbidity indices revealing sediment plume extent
- Diffuse attenuation coefficients quantifying light penetration
- True-color imagery for visual darkwave identification
Integration Workflow:
- Download historical satellite data for survey area (minimum 5-year period)
- Identify darkwave events and calculate frequency metrics
- Correlate satellite observations with weather data
- Plan field surveys to avoid active darkwave periods or specifically target them
- Validate satellite-derived metrics with in-situ measurements
Autonomous Monitoring Systems
Continuous data collection is essential for capturing darkwave dynamics. Emerging technologies include:
- Moored sensor arrays: Multi-parameter platforms measuring light, turbidity, chlorophyll, and physical oceanography
- Autonomous underwater vehicles (AUVs): Programmed transects collecting spatial data
- Gliders: Long-duration platforms for regional-scale monitoring
- Smart buoys: Solar-powered systems with real-time data transmission
Data Management and Analysis
The volume and complexity of data from 2026 protocols require robust management systems:
Essential Capabilities:
- Cloud-based storage for multi-year datasets
- Automated quality control algorithms
- Statistical tools for trend analysis and darkwave detection
- Visualization platforms for stakeholder communication
- Integration with BNG assessment software
Regulatory Considerations and Compliance
Emerging Policy Framework
As ocean darkening gains recognition as a significant environmental stressor, regulatory frameworks are evolving. Ecology surveyors should anticipate:
- Expanded baseline data requirements for coastal development applications
- Light penetration impact assessments as standard components of environmental statements
- Marine darkwave risk assessments for projects in vulnerable areas
- Enhanced monitoring requirements for BNG verification
Documentation Standards
Survey reports addressing ocean darkening should include:
- Methodology section detailing light measurement protocols
- Baseline characterization with temporal context (not single snapshots)
- Darkwave frequency analysis for the survey area
- Impact predictions accounting for cumulative darkening effects
- Monitoring plans with darkwave-specific triggers and responses
These standards align with broader biodiversity assessment requirements while addressing marine-specific considerations.
Training and Professional Development
Essential Competencies for 2026
Ecology surveyors working in marine environments should develop expertise in:
- Underwater light physics: Understanding PAR, spectral quality, and attenuation
- Oceanographic processes: Sediment dynamics, water column structure, and circulation
- Remote sensing interpretation: Satellite data analysis and validation
- Statistical analysis: Time-series methods for trend detection
- Climate science: Projecting future darkening scenarios
Professional Resources
Organizations and resources supporting skill development include:
- International Ocean-Colour Coordinating Group (IOCCG) training materials
- Marine biological association workshops on light ecology
- Remote sensing platforms offering free training (NASA ARSET, ESA training)
- Peer-reviewed literature on marine darkwaves and ocean darkening[2][5][7]
Practical Implementation Guide
Step-by-Step Protocol for Darkening-Aware Surveys
Phase 1: Pre-Survey Planning (4-8 weeks before fieldwork)
- Acquire 5-10 years of satellite ocean color data for survey area
- Analyze historical darkwave frequency and seasonal patterns
- Consult weather forecasts and plan fieldwork during stable conditions
- Prepare equipment checklist including continuous monitoring sensors
- Develop sampling design with adequate temporal and spatial resolution
Phase 2: Baseline Data Collection (Duration varies by project scale)
- Deploy continuous monitoring equipment at representative locations
- Conduct depth-stratified light penetration measurements
- Document habitat distribution relative to current photic zone
- Survey species assemblages with emphasis on light-dependent taxa
- Collect water samples for laboratory analysis of turbidity and chlorophyll
- Photograph survey sites for visual documentation
Phase 3: Data Analysis and Interpretation
- Process light penetration data to define photic zone boundaries
- Calculate darkwave frequency metrics from continuous monitoring
- Analyze habitat quality in context of light availability
- Compare current conditions to historical satellite-derived trends
- Identify potential future darkening scenarios based on regional patterns
Phase 4: Reporting and Recommendations
- Present baseline conditions with temporal context
- Assess project impacts considering cumulative darkening effects
- Propose BNG interventions adapted for darkening conditions
- Design monitoring programs with darkwave-specific protocols
- Provide adaptive management recommendations
Common Challenges and Solutions
| Challenge | Solution |
|---|---|
| Limited historical data | Use satellite archives and regional studies as proxies |
| Budget constraints for continuous monitoring | Partner with research institutions or use lower-cost sensors |
| Darkwave events during survey period | Document event characteristics; return for clear-water surveys |
| Uncertainty in future darkening trends | Develop multiple scenarios; design robust interventions |
| Stakeholder unfamiliarity with darkening | Provide educational materials; use visualizations |
Future Outlook and Research Needs
Emerging Research Priorities
The scientific community continues to refine understanding of ocean darkening. Priority research areas include:
- Ecosystem threshold identification: Determining critical light levels for key species and habitats
- Recovery dynamics: Quantifying ecosystem resilience following darkwave events
- Climate change interactions: Understanding how warming, acidification, and darkening combine
- Socioeconomic impacts: Assessing effects on fisheries, tourism, and coastal communities[6]
Implications for Long-Term Monitoring
BNG projects initiated in 2026 will require monitoring for 30+ years. Ecology surveyors should consider:
- Technological evolution: Plan for sensor upgrades and data continuity
- Climate change scenarios: Anticipate shifting baseline conditions
- Adaptive management frameworks: Build flexibility into monitoring protocols
- Data legacy: Ensure long-term data accessibility for future analysis
For professionals seeking to stay current, biodiversity surveying resources provide ongoing updates on best practices and regulatory developments.
Conclusion
Ocean darkening represents a fundamental environmental change with profound implications for marine ecology surveys. The Ocean Darkening Impacts on Marine Surveys: 2026 Protocols for Ecology Surveyors framework provides essential tools for adapting field methodologies to this new reality.
With over 21% of global oceans experiencing significant darkening and marine darkwaves occurring with increasing frequency, traditional survey approaches are no longer sufficient. Ecology surveyors must embrace:
- Temporal monitoring that captures darkwave dynamics rather than single snapshots
- Technology integration combining in-situ sensors with satellite remote sensing
- Food web assessment understanding cascading impacts from primary producers to apex predators
- Adaptive BNG design accounting for changing light conditions in restoration planning
Actionable Next Steps
For ecology surveyors preparing for marine projects in 2026 and beyond:
- ✅ Acquire training in underwater light measurement and remote sensing interpretation
- ✅ Update equipment inventory with continuous monitoring sensors and low-light imaging systems
- ✅ Review satellite data for your project areas to establish darkening trends
- ✅ Engage with clients early about ocean darkening considerations in project planning
- ✅ Develop partnerships with oceanographic institutions for technical support
- ✅ Contribute data to regional monitoring programs to build collective knowledge
The standardized framework introduced in 2026 provides the foundation, but successful implementation requires professional commitment to continuous learning and methodological innovation. As François Thoral emphasized, we now have consistent tools to measure extreme reductions in underwater light—the responsibility lies with ecology professionals to apply these tools effectively in service of marine conservation and sustainable development.
For additional guidance on conducting comprehensive environmental assessments and implementing biodiversity net gain strategies, contact experienced biodiversity surveyors who can provide project-specific advice tailored to your marine survey needs.
References
[1] Global ocean faces unprecedented darkening – https://www.techexplorist.com/global-ocean-faces-unprecedented-darkening/99772/
[2] Scientists Create System Tracking Underwater Blackouts – https://www.sciencedaily.com/releases/2026/01/260114084115.htm
[3] Threat Marine Darkwaves Ocean Life – https://phys.org/news/2026-01-threat-marine-darkwaves-ocean-life.html
[4] Oceans Are Getting Darker And Marine Life Is Under Threat – https://newatlas.com/environment/oceans-are-getting-darker-and-marine-life-is-under-threat/
[5] Scientists Create System Tracking Underwater Blackouts – https://news.ucsb.edu/2026/022326/scientists-create-system-tracking-underwater-blackouts
[6] The Ocean Is Getting Darker What Could That Mean For Global Fisheries – https://www.globalseafood.org/advocate/the-ocean-is-getting-darker-what-could-that-mean-for-global-fisheries/
[7] Ocean darkening research – https://onlinelibrary.wiley.com/doi/10.1111/gcb.70227
