
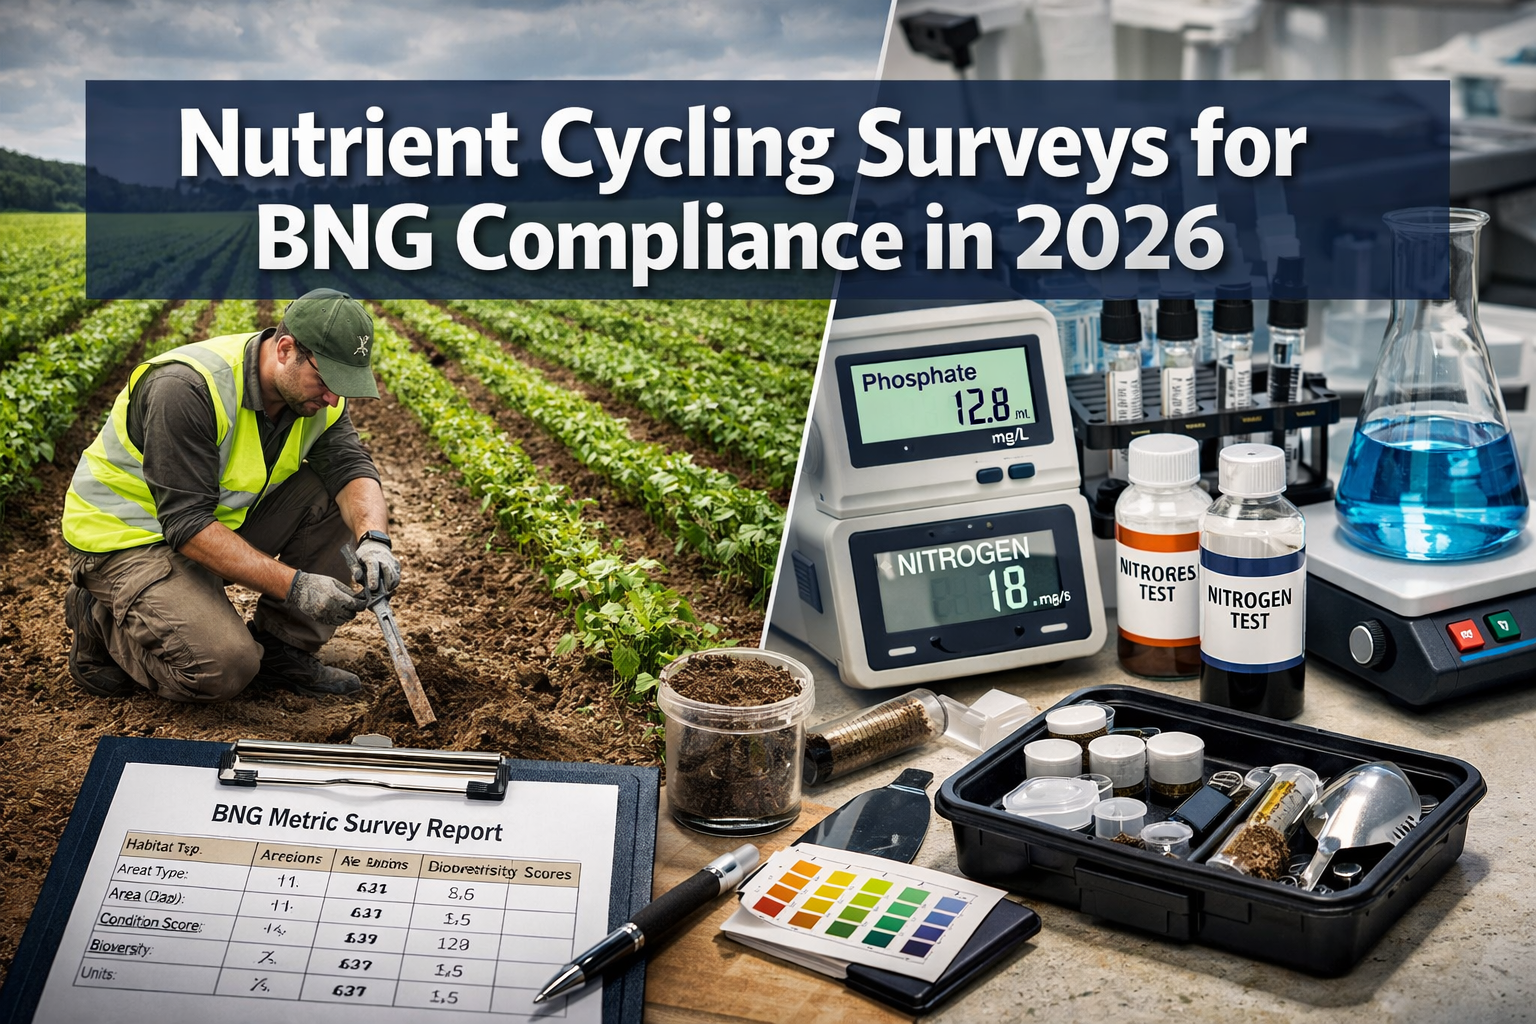
Altered nutrient cycles in agricultural landscapes now pose one of the most significant threats to achieving Biodiversity Net Gain (BNG) targets. Research shows that excess phosphorus and nitrogen can reduce habitat condition scores by up to 30%, directly undermining the mandatory 10% biodiversity uplift required since February 2024[1]. As development pressure intensifies on agricultural land in 2026, ecologists face a critical challenge: how to accurately measure and document nutrient cycling baselines that will determine whether BNG compliance succeeds or fails over the next three decades.
Nutrient Cycling Surveys for BNG Compliance: Ecologist Strategies Tracking Phosphorus and Nitrogen in 2026 Agro-Ecosystem Baselines have emerged as essential tools for developers, landowners, and environmental consultants navigating the complex intersection of agricultural land management and biodiversity regulation. This comprehensive approach combines traditional ecological surveying with advanced soil science techniques to create robust baseline data that stands up to regulatory scrutiny.
Key Takeaways
- Integrated nutrient surveys combining soil cores, isotope analysis, and habitat assessments provide defensible baseline data for BNG compliance on agricultural sites
- Phosphorus and nitrogen loading directly impacts habitat condition scores in DEFRA's Statutory BNG Metric, affecting unit calculations by 20-30%
- Seasonal timing of nutrient cycling surveys must align with optimal habitat assessment periods (spring-summer) for accurate baseline characterization[1]
- Long-term monitoring protocols tracking nutrient dynamics over 30-year management periods are now essential for demonstrating sustained biodiversity gains
- Cross-disciplinary expertise integrating soil science, agricultural ecology, and BNG regulatory knowledge delivers superior compliance outcomes
Understanding the BNG-Nutrient Cycling Connection
The mandatory BNG framework introduced across England requires developments to deliver a minimum 10% increase in biodiversity value, calculated using DEFRA's Statutory BNG Metric[1][3]. However, many developers and their ecological consultants initially overlooked a critical factor: nutrient enrichment fundamentally alters habitat condition assessments.
Why Nutrient Cycles Matter for BNG Calculations
Agricultural landscapes typically exhibit elevated phosphorus and nitrogen levels from decades of fertilizer application, livestock management, and atmospheric deposition. These altered nutrient cycles create cascading effects:
- Reduced plant diversity as competitive species outcompete rare wildflowers
- Changed soil microbial communities affecting decomposition and nutrient availability
- Modified habitat structure with rank vegetation replacing diverse sward compositions
- Lower condition scores in the BNG Metric's habitat assessment criteria
When ecologists conduct biodiversity impact assessments without quantifying nutrient status, they risk overestimating baseline habitat condition. This creates compliance risks downstream when restoration targets cannot be achieved due to persistent nutrient enrichment.
The 2026 Regulatory Landscape
As BNG implementation matures in 2026, planning authorities increasingly scrutinize baseline assessments. Recent sentiment surveys indicate that 68% of developers report challenges with habitat condition assessments[7], with nutrient-related issues featuring prominently in rejected applications.
The European Environment Agency's February 2026 biodiversity progress report emphasized that agricultural nutrient management remains a critical factor in achieving nature restoration targets[4]. This international context reinforces the UK's focus on integrating nutrient considerations into BNG compliance strategies.
Ecologist Strategies for Nutrient Cycling Surveys in Agro-Ecosystems
Professional ecologists have developed sophisticated protocols for Nutrient Cycling Surveys for BNG Compliance: Ecologist Strategies Tracking Phosphorus and Nitrogen in 2026 Agro-Ecosystem Baselines that go far beyond basic soil testing.
Comprehensive Baseline Assessment Protocols
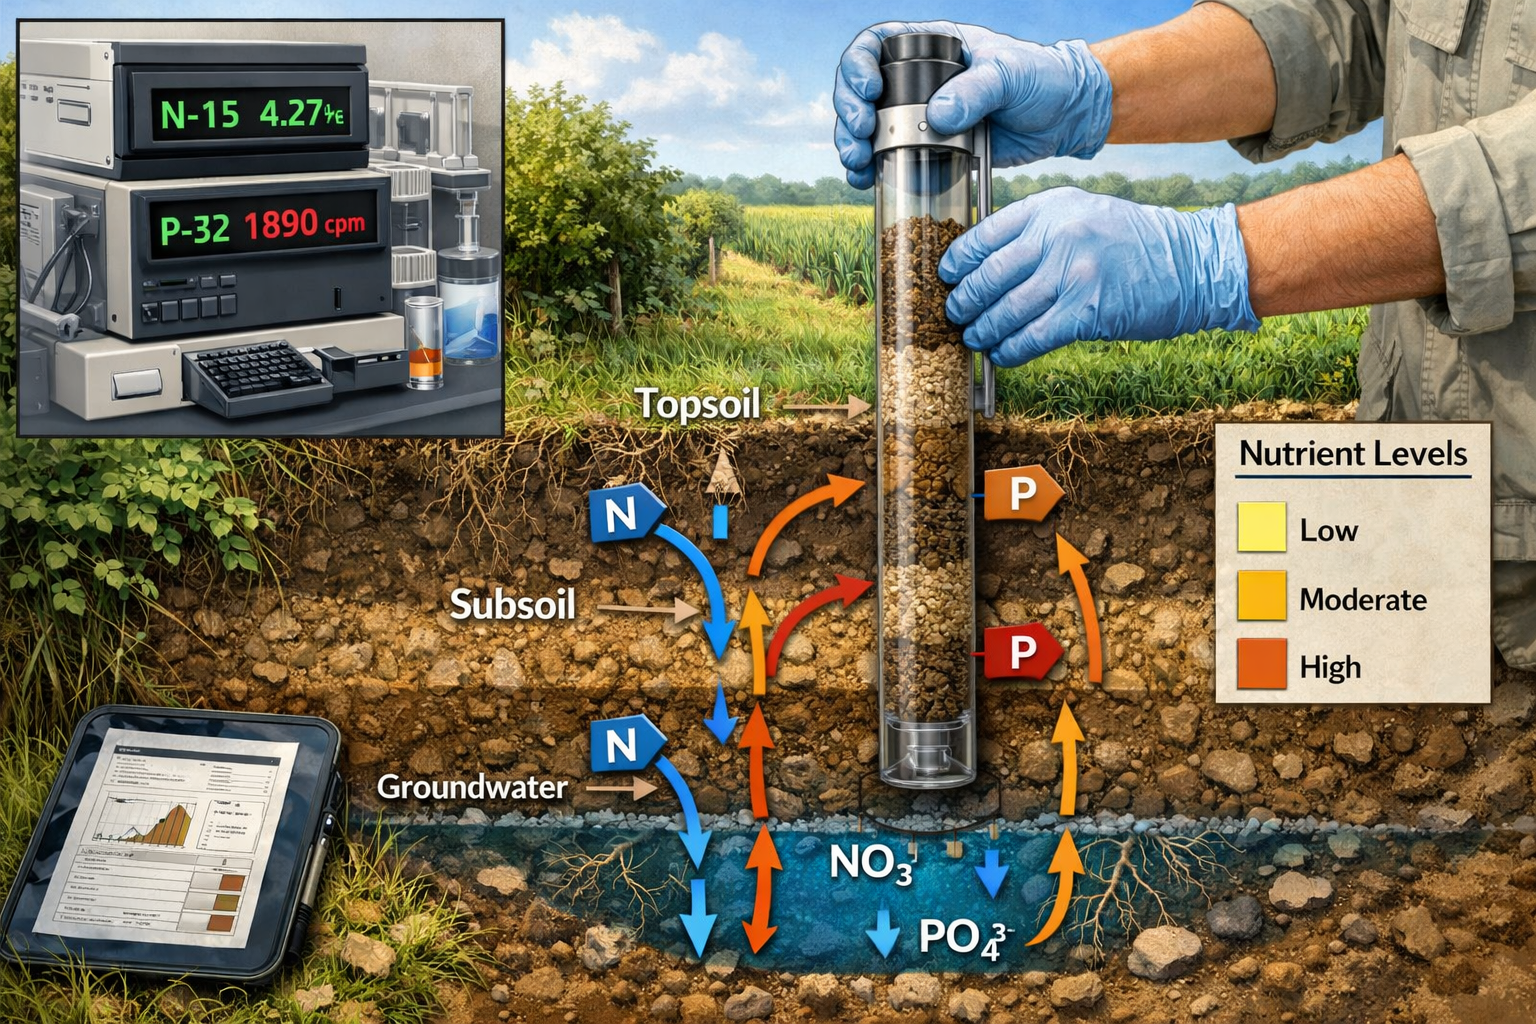
1. Stratified Soil Core Sampling 🌱
Modern nutrient cycling surveys employ systematic soil core extraction across development sites:
- Grid-based sampling at 50-100m intervals depending on site heterogeneity
- Depth-stratified cores (0-15cm, 15-30cm, 30-60cm) revealing nutrient distribution profiles
- Seasonal replication capturing temporal variation in nutrient availability
- Georeferenced sample locations enabling precise long-term monitoring
This approach provides spatial resolution that single composite samples cannot deliver, revealing nutrient hotspots and gradients critical for habitat restoration planning.
2. Phosphorus Characterization Techniques
Phosphorus assessment requires multiple analytical approaches:
| Analysis Type | Purpose | BNG Application |
|---|---|---|
| Olsen P | Plant-available phosphorus | Habitat condition scoring |
| Total P | Long-term nutrient budget | 30-year management planning |
| P fractionation | Bioavailability assessment | Restoration feasibility |
| Isotope analysis (P-32) | Cycling rate determination | Intervention effectiveness |
Total phosphorus concentrations exceeding 50 mg/kg typically indicate enrichment that will suppress target plant communities, directly affecting achievable habitat condition scores.
3. Nitrogen Dynamics Assessment
Nitrogen's high mobility demands different survey strategies:
- Total nitrogen and organic matter content establishing baseline stocks
- Mineral nitrogen (nitrate + ammonium) indicating current availability
- N-15 isotope tracing revealing nitrogen sources (atmospheric vs. agricultural)
- Potential mineralization assays predicting future nitrogen release
These measurements inform whether nitrogen limitation can be restored through management interventions, or whether elevated nitrogen will permanently constrain biodiversity outcomes.
Integrating Nutrient Data with Habitat Assessments
The critical innovation in Nutrient Cycling Surveys for BNG Compliance: Ecologist Strategies Tracking Phosphorus and Nitrogen in 2026 Agro-Ecosystem Baselines lies in integration with standard ecological surveying.
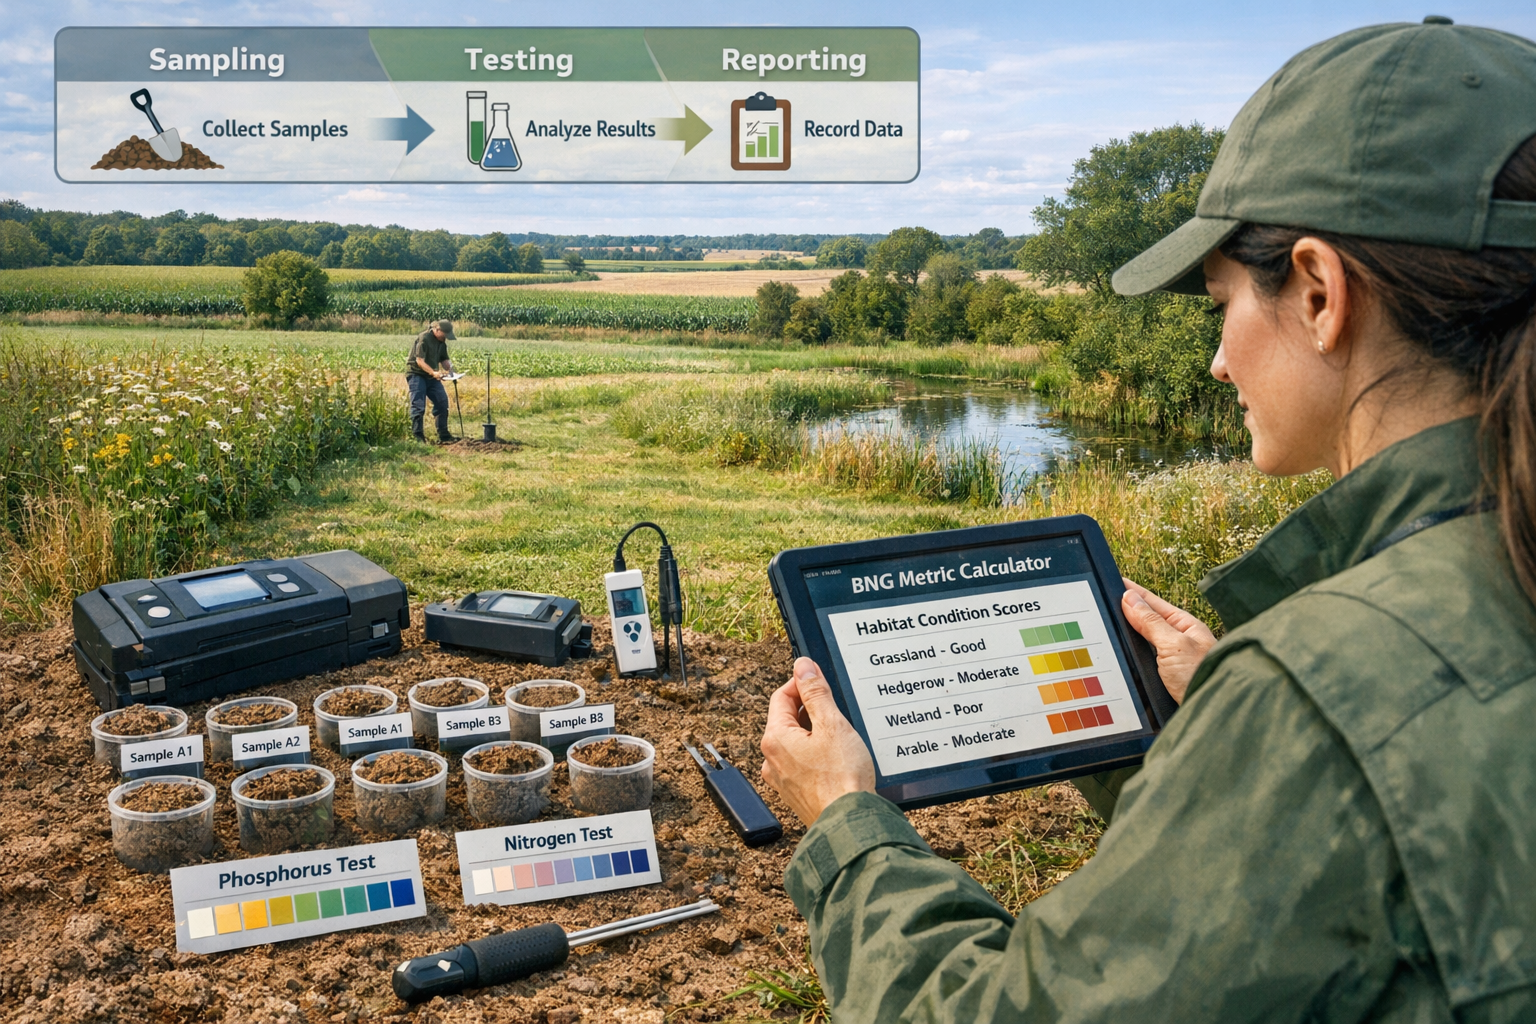
Optimal Survey Timing Coordination
Habitat surveys require completion during optimal months, typically spring and summer when vegetation is identifiable[1]. Nutrient cycling surveys must align with this timing:
- Spring sampling (April-May) captures peak nutrient availability during plant growth
- Vegetation surveys (May-August) document species composition under current nutrient regimes
- Soil sampling conducted simultaneously with botanical surveys maximizes efficiency
- Autumn resampling (September-October) reveals post-growing season nutrient depletion
This coordinated approach ensures nutrient data directly corresponds to observed habitat condition, strengthening the evidential basis for baseline assessments submitted with BNG reports.
Translating Nutrient Data to Condition Scores
Ecologists now employ decision frameworks linking nutrient measurements to habitat condition criteria:
For grassland habitats:
- Olsen P >25 mg/kg → Condition assessment "moderate" maximum
- Olsen P >40 mg/kg → Condition assessment "poor" likely
- Total N >0.4% → Competitive species dominance expected
For wetland habitats:
- Total P >100 mg/kg → Eutrophication impacts inevitable
- Nitrate-N >10 mg/kg → Target bryophyte communities excluded
These thresholds, derived from ecological research and field experience, provide objective criteria for condition scoring that withstand regulatory scrutiny.
Advanced Analytical Techniques Gaining Adoption
Leading ecological consultancies now incorporate cutting-edge methods into nutrient cycling surveys:
Stable Isotope Analysis 🔬
Nitrogen-15 and oxygen-18 isotope ratios in soil and plant tissue reveal:
- Nitrogen sources (synthetic fertilizer vs. atmospheric deposition vs. biological fixation)
- Nutrient cycling pathways distinguishing recent inputs from legacy pools
- Denitrification rates indicating nitrogen loss mechanisms
This forensic approach proves particularly valuable when planning authorities question whether observed enrichment results from current land management or historical practices.
Microbial Community Profiling
DNA sequencing of soil microbial communities provides insights into:
- Nutrient cycling functional capacity of soil ecosystems
- Restoration potential based on microbial diversity metrics
- Degradation indicators showing ecosystem stress from nutrient imbalance
While not yet standard practice, microbial profiling offers early warning of nutrient-related habitat degradation before vegetation changes become apparent.
Implementing Nutrient Cycling Surveys for BNG Compliance
Successful implementation of Nutrient Cycling Surveys for BNG Compliance: Ecologist Strategies Tracking Phosphorus and Nitrogen in 2026 Agro-Ecosystem Baselines requires careful planning and execution.
Pre-Survey Planning Considerations
Site History Investigation
Before fieldwork begins, ecologists compile comprehensive site histories:
- Agricultural records documenting fertilizer application rates and timing
- Livestock stocking densities and manure management practices
- Crop rotation patterns affecting nutrient demand and residues
- Previous land use revealing legacy contamination or enrichment
This historical context helps interpret analytical results and predict spatial variation in nutrient status. Sites with intensive poultry or pig production history typically require more extensive sampling due to phosphorus accumulation.
Defining Survey Extent and Intensity
Survey design must balance statistical rigor with practical constraints:
For small development projects (<1 hectare):
- Minimum 5-8 sampling points
- Focus on areas proposed for habitat creation or enhancement
- Reference sampling in adjacent unaffected habitats
For larger sites (>5 hectares):
- Grid-based systematic sampling at 50m intervals
- Additional targeted sampling in visually distinct zones
- Increased replication near watercourses (phosphorus transfer risk)
Small development projects may employ simplified protocols, but must still demonstrate adequate baseline characterization for BNG compliance.
Field Survey Execution
Equipment and Materials Checklist ✅
Professional nutrient cycling surveys require:
- Soil coring equipment (Dutch auger, gouge auger, or mechanical corer)
- GPS unit with sub-meter accuracy for sample georeferencing
- Sample containers (acid-washed for phosphorus, sterile for microbial work)
- Field meters (pH, electrical conductivity, soil moisture)
- Chain of custody documentation ensuring sample integrity
- Personal protective equipment appropriate for agricultural sites
Quality Assurance Protocols
Maintaining data quality requires rigorous protocols:
- Field blanks (10% of samples) detecting contamination
- Duplicate samples (10% of samples) assessing analytical precision
- Photographic documentation of sampling locations and soil profiles
- Real-time data entry minimizing transcription errors
- Secure sample transport maintaining cold chain for labile nutrients
These quality measures ensure nutrient data meets the evidential standards required for regulatory submissions.
Laboratory Analysis and Interpretation
Selecting Accredited Laboratories
Nutrient analysis must employ UKAS-accredited laboratories using standardized methods:
- Olsen phosphorus (BS 7755-3.6)
- Total nitrogen (ISO 13878)
- Soil organic matter (loss on ignition, BS 7755-3.8)
- pH (ISO 10390)
Accreditation provides confidence that analytical results will withstand regulatory scrutiny if challenged during planning processes.
Data Analysis and Reporting
Comprehensive nutrient cycling reports integrate multiple data streams:
Spatial analysis:
- Interpolated maps showing phosphorus and nitrogen distribution
- Hotspot identification requiring targeted management interventions
- Correlation analysis with habitat condition scores
Temporal analysis:
- Seasonal variation in nutrient availability
- Comparison with regional reference data
- Trend assessment if historical data exists
Risk assessment:
- Nutrient loading calculations for watercourses
- Leaching potential based on soil texture and drainage
- Restoration feasibility evaluation
This analysis directly informs biodiversity plans by identifying constraints and opportunities for habitat creation and enhancement.
Integrating Nutrient Data into BNG Metric Calculations
The Statutory BNG Metric incorporates habitat condition through detailed assessment criteria[1][3]. Nutrient cycling data strengthens condition assessments by:
Providing Objective Evidence
Rather than subjective judgments about vegetation structure, nutrient data offers quantitative support:
"Soil phosphorus concentrations of 45 mg/kg Olsen P exceed thresholds for species-rich grassland, supporting the 'moderate' condition assessment despite current botanical diversity."
This evidence-based approach reduces disputes with planning authorities and provides clear targets for habitat management.
Informing Realistic Enhancement Trajectories
Nutrient enrichment affects achievable condition improvements over the 30-year BNG accounting period. Sites with severe phosphorus accumulation may require:
- Extended timescales (15-20 years) for nutrient depletion through biomass removal
- Active interventions (topsoil stripping, phosphorus-binding amendments)
- Modified target habitats selecting communities tolerant of moderate enrichment
Understanding these constraints upfront prevents BNG strategies that promise unachievable outcomes.
Supporting Off-Site Delivery Decisions
When on-site BNG delivery faces nutrient-related constraints, developers may need to purchase biodiversity units from off-site providers. Nutrient cycling surveys provide the technical justification for this decision, demonstrating that on-site enhancement cannot achieve required gains within reasonable timescales.
Long-Term Monitoring and Adaptive Management
BNG compliance extends 30 years beyond development completion, requiring sustained monitoring of nutrient dynamics and biodiversity outcomes.
Establishing Monitoring Protocols
Effective long-term monitoring builds on baseline nutrient cycling surveys:
Monitoring Frequency
Years 1-5 (establishment phase):
- Annual nutrient sampling at fixed monitoring points
- Quarterly vegetation assessments during growing season
- Immediate intervention if nutrient targets exceeded
Years 6-15 (maturation phase):
- Biennial nutrient sampling
- Annual vegetation surveys
- Condition assessment every 3 years
Years 16-30 (maintenance phase):
- Nutrient sampling every 5 years
- Condition assessment every 5 years
- Event-driven sampling after management interventions
This tiered approach balances monitoring costs against the need to detect problems early when corrective action remains feasible.
Adaptive Management Triggers
Monitoring data should trigger management responses when:
- Phosphorus increases >10% from baseline indicating nutrient accumulation
- Nitrogen availability rises beyond target ranges for habitat type
- Condition scores decline below predicted trajectories
- Target species fail to establish despite appropriate habitat structure
Adaptive management provisions must be written into legal agreements securing BNG delivery, ensuring resources exist to address nutrient-related problems as they emerge.
Emerging Technologies for Continuous Monitoring
Innovation in environmental sensing offers new possibilities for nutrient tracking:
Remote Sensing Applications
Satellite and drone imagery can now detect:
- Vegetation nutrient status through spectral indices (NDVI, chlorophyll content)
- Biomass accumulation indicating excessive productivity from enrichment
- Species composition shifts toward nitrophilous communities
While not replacing soil sampling, remote sensing enables cost-effective surveillance between intensive monitoring campaigns.
In-Situ Sensor Networks
Buried sensors measuring soil moisture, temperature, and nutrient concentrations provide continuous data streams. Although currently expensive for routine BNG monitoring, costs are declining rapidly, making sensor networks increasingly viable for large or high-value developments.
Case Study Applications and Lessons Learned
Early adopters of comprehensive Nutrient Cycling Surveys for BNG Compliance: Ecologist Strategies Tracking Phosphorus and Nitrogen in 2026 Agro-Ecosystem Baselines have generated valuable insights.
Agricultural Conversion Developments
A 15-hectare residential development on former arable land in Oxfordshire conducted detailed nutrient cycling surveys revealing:
- Phosphorus hotspots (60-80 mg/kg Olsen P) along field margins from fertilizer spreader overlap
- Uniform nitrogen depletion following crop harvest (baseline sampling timing critical)
- Spatial variation requiring zone-specific habitat creation strategies
The nutrient data enabled architects and planners to optimize site layout, locating phosphorus-tolerant habitat types (woodland, scrub) in enriched zones while reserving areas with lower nutrient levels for species-rich grassland creation.
Livestock Farm Diversification
A dairy farm in Devon seeking planning permission for barn conversions faced significant nutrient challenges:
- Extreme phosphorus accumulation (>150 mg/kg) in former cattle yards
- Nitrogen enrichment extending 50m from field gates and water troughs
- Degraded habitat condition limiting baseline biodiversity value
Comprehensive nutrient surveys demonstrated that achieving 10% BNG on-site would require topsoil stripping across 40% of the site—economically unviable. The nutrient data provided robust justification for off-site unit purchase, which planning authorities accepted based on the technical evidence presented.
Lessons for Practitioners
These cases highlight critical success factors:
✅ Early survey timing – Nutrient assessments conducted during feasibility stages inform site selection and layout optimization
✅ Spatial resolution – Grid-based sampling reveals variation that composite samples miss, enabling targeted interventions
✅ Integration with design – Nutrient data shared with design teams early influences habitat placement and target selection
✅ Transparent reporting – Clearly presenting nutrient constraints builds credibility with planning authorities even when requesting off-site delivery
Cost-Benefit Considerations
Comprehensive nutrient cycling surveys represent additional upfront investment in BNG compliance, but deliver significant value.
Survey Cost Factors
Typical costs for professional nutrient cycling surveys include:
Small sites (<1 hectare):
- Field survey: £800-1,200
- Laboratory analysis: £400-600
- Data analysis and reporting: £600-1,000
- Total: £1,800-2,800
Medium sites (1-5 hectares):
- Field survey: £1,500-2,500
- Laboratory analysis: £800-1,500
- Data analysis and reporting: £1,200-2,000
- Total: £3,500-6,000
Large sites (>5 hectares):
- Field survey: £3,000-5,000
- Laboratory analysis: £1,500-3,000
- Data analysis and reporting: £2,000-3,500
- Total: £6,500-11,500
Advanced techniques (isotope analysis, microbial profiling) add £1,000-3,000 depending on sample numbers.
Return on Investment
These costs deliver value through:
- Reduced compliance risk – Robust baseline data withstands regulatory scrutiny, avoiding costly planning delays
- Optimized habitat design – Nutrient-informed habitat placement increases success rates, reducing long-term management costs
- Justified off-site delivery – Technical evidence supporting off-site unit purchase prevents protracted planning negotiations
- Lower unit costs – Accurate baseline assessments may reveal higher existing biodiversity value than assumed, reducing required uplift
For context, statutory biodiversity unit costs currently exceed £42,000 per unit. If nutrient surveys enable even a 0.1 unit reduction in required off-site delivery, the investment pays for itself.
Regulatory Compliance and Future Directions
The integration of nutrient cycling assessments into BNG compliance reflects broader shifts in environmental regulation.
Current Regulatory Position
DEFRA's BNG guidance emphasizes habitat condition assessment but does not explicitly mandate nutrient analysis[1][3]. However, the condition criteria include indicators directly affected by nutrient status:
- Sward height and structure (influenced by productivity)
- Indicator species presence (many sensitive to enrichment)
- Physical damage indicators (including eutrophication effects)
Competent ecologists recognize that nutrient data provides essential context for defensible condition assessments, even if not explicitly required.
Anticipated Policy Developments
Several trends suggest nutrient cycling surveys will become increasingly important:
Nutrient Neutrality Expansion
Some planning authorities already require nutrient neutrality for phosphorus and nitrogen in catchments with protected waterbodies. This regulatory framework may expand beyond current designated areas, making nutrient baseline characterization mandatory for wider development contexts.
Enhanced Condition Assessment Criteria
Future revisions of the BNG Metric may incorporate quantitative nutrient thresholds into condition assessment criteria, formalizing the link between soil chemistry and habitat quality that ecologists already recognize.
Integration with Environmental Land Management
The Sustainable Farming Incentive and other Environmental Land Management schemes increasingly emphasize nutrient management. Developments on agricultural land may need to demonstrate alignment with these broader policy objectives, requiring comprehensive nutrient baseline data.
Professional Standards and Competency
As nutrient cycling surveys become standard practice for BNG compliance, professional competency requirements are evolving:
Essential skills for 2026 ecologists:
- Soil science fundamentals (nutrient chemistry, soil processes)
- Sampling design and statistical analysis
- Laboratory method selection and quality assurance
- Integration of chemical and biological data
- Communication of technical findings to non-specialists
Professional development programs and specialized training courses addressing these competencies are expanding rapidly across the ecological consultancy sector.
Conclusion
Nutrient Cycling Surveys for BNG Compliance: Ecologist Strategies Tracking Phosphorus and Nitrogen in 2026 Agro-Ecosystem Baselines represent a critical evolution in ecological surveying practice. As altered nutrient cycles increasingly threaten biodiversity outcomes on agricultural land, the integration of soil science with traditional habitat assessment has transitioned from optional enhancement to essential compliance strategy.
The evidence is compelling: phosphorus and nitrogen enrichment directly impacts habitat condition scores, affecting BNG unit calculations by 20-30%. Developments that fail to characterize nutrient baselines risk overestimating existing biodiversity value, underestimating enhancement challenges, and ultimately failing to deliver the mandatory 10% biodiversity uplift over 30-year timescales.
Key Implementation Steps for Practitioners
For developers, landowners, and ecological consultants navigating BNG compliance in 2026:
-
Commission nutrient cycling surveys early during feasibility and site selection phases when findings can inform layout and design decisions
-
Employ stratified sampling protocols with adequate spatial resolution to reveal nutrient gradients and hotspots across development sites
-
Coordinate survey timing with optimal habitat assessment periods (spring-summer) ensuring nutrient data corresponds to observed vegetation condition[1]
-
Integrate nutrient findings into habitat condition assessments, using quantitative data to support scoring decisions and enhance evidential basis
-
Plan for long-term monitoring with adaptive management provisions addressing nutrient dynamics over the full 30-year BNG accounting period
-
Engage specialists with cross-disciplinary expertise in soil science, agricultural ecology, and BNG regulatory frameworks
Moving Forward
The convergence of biodiversity regulation with agricultural nutrient management challenges represents both complexity and opportunity. Developments that embrace comprehensive nutrient cycling assessments gain competitive advantages through:
- Faster planning approvals based on robust, defensible baseline assessments
- Optimized habitat designs aligned with site-specific nutrient constraints and opportunities
- Reduced long-term risks from unanticipated nutrient-related habitat degradation
- Enhanced environmental outcomes delivering genuine biodiversity gains rather than paper compliance
For those seeking expert guidance on integrating nutrient cycling surveys into BNG compliance strategies, professional ecological consultancies offer specialized services combining field survey expertise with analytical capabilities and regulatory knowledge.
The transformation of BNG from regulatory burden to strategic opportunity begins with understanding the fundamental ecological processes—including nutrient cycling—that determine whether habitat creation and enhancement succeed or fail. In 2026 and beyond, developments that invest in comprehensive baseline characterization will lead the way in delivering measurable, lasting biodiversity gains.
Ready to ensure your development achieves BNG compliance with confidence? Contact ecological specialists experienced in nutrient cycling assessments to discuss your project requirements and develop a tailored survey strategy that delivers robust baseline data for long-term success.
References
[1] Biodiversity Net Gain FAQ – https://www.biodiversity-net-gain.co.uk/FAQ.html
[2] Indiana State Nutrient Reduction Strategy – https://www.in.gov/isda/files/Compressed-Indiana-State-Nutrient-Reduction-Strategy-Version-7_Final-compressed.pdf
[3] Biodiversity Net Gain Regulations Opportunities And Challenges – https://www.ipf.org.uk/resourceLibrary/biodiversity-net-gain-regulations—opportunities-and-challenges–january-2026-.html
[4] European Environment Agency Biodiversity Progress Report – https://environment.ec.europa.eu/news/progress-made-biodiversity-swifter-action-needed-2026-02-12_en
[5] Geology And Biodiversity Work Together – https://arbtech.co.uk/geology-and-biodiversity-work-together/
[6] Carbon Pulse Biodiversity Markets – https://carbon-pulse.com/487123/
[7] Biodiversity Net Gain Sentiment Survey 2026 – https://www.hbf.co.uk/news/biodiversity-net-gain-sentiment-survey-2026/
