
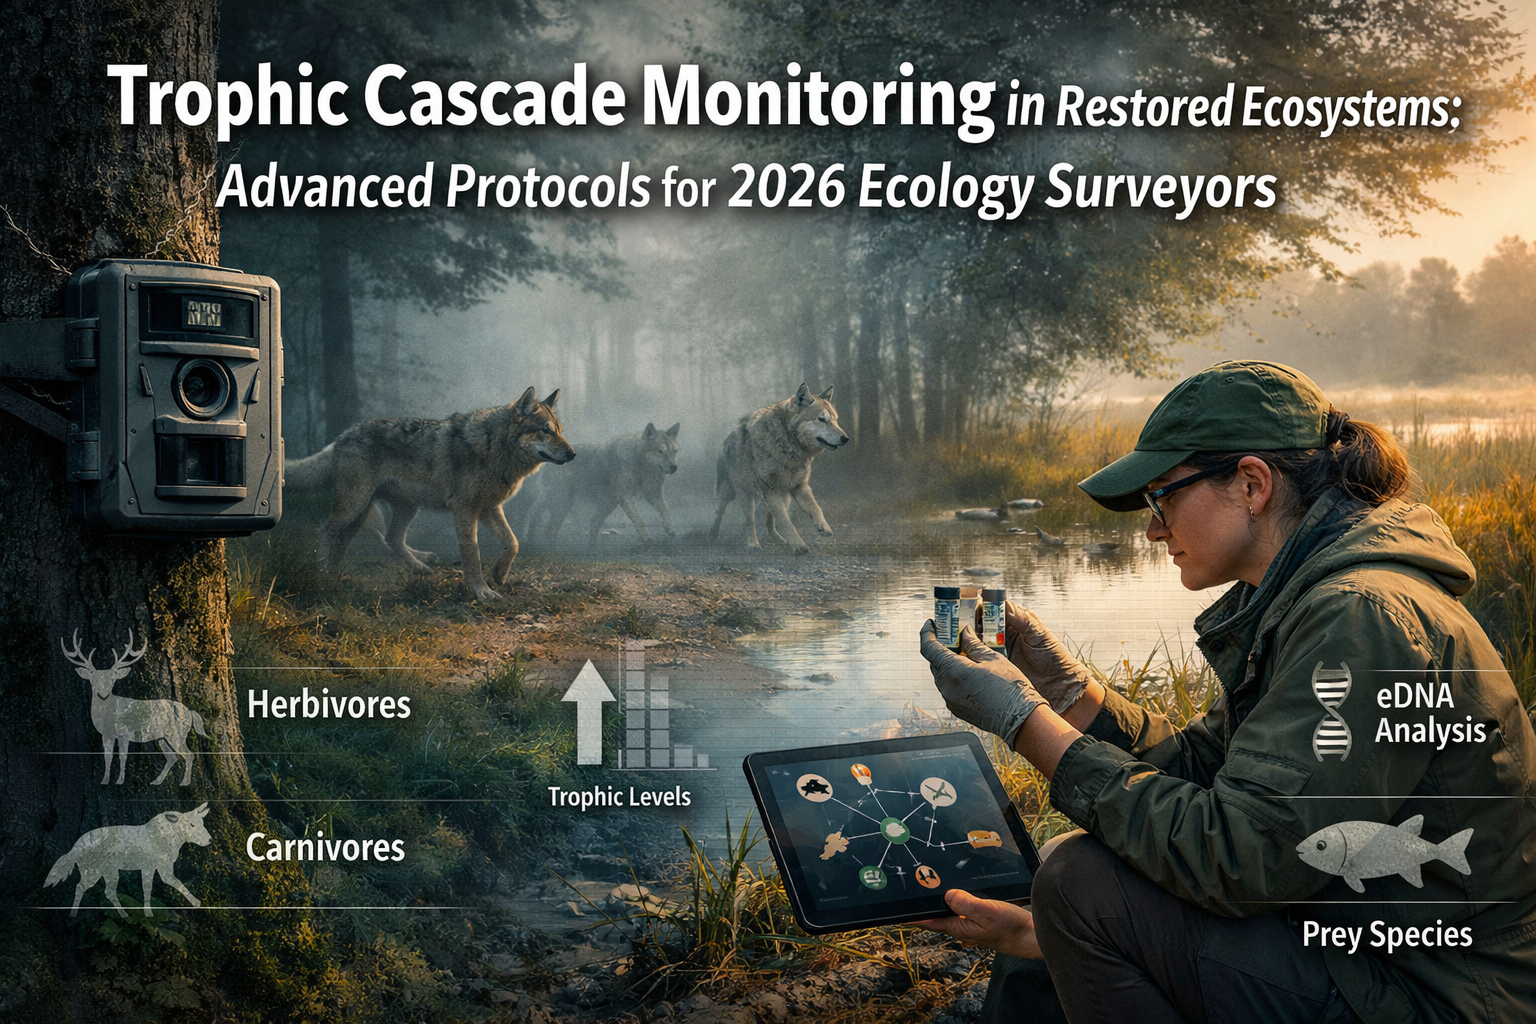
Recent research reveals that 73% of ecosystem restoration projects fail to track predator-prey dynamics beyond the first year, leaving critical gaps in understanding whether restored habitats truly function as self-sustaining ecosystems. As global restoration targets accelerate toward the 2030 deadline, ecology surveyors face unprecedented pressure to demonstrate measurable ecological recovery through Trophic Cascade Monitoring in Restored Ecosystems: Advanced Protocols for 2026 Ecology Surveyors—a comprehensive approach that combines cutting-edge technology with traditional field methods.
The Kunming-Montreal Global Biodiversity Framework demands that 30% of degraded ecosystems be under effective restoration by 2030 [3]. This ambitious target requires surveyors to move beyond simple species counts and vegetation surveys. Understanding how energy flows through food webs—from apex predators down to primary producers—provides the clearest indicator of ecosystem health and restoration success.
Key Takeaways
- Modern monitoring protocols combine camera traps, eDNA sampling, and biomarker analysis to track predator-prey interactions with unprecedented accuracy
- Global standardization efforts through the Framework for Ecosystem Restoration Monitoring (FERM) establish consistent reporting methods across restoration projects
- Multi-species approaches that monitor facilitation cascades deliver more comprehensive ecosystem health data than single-species tracking
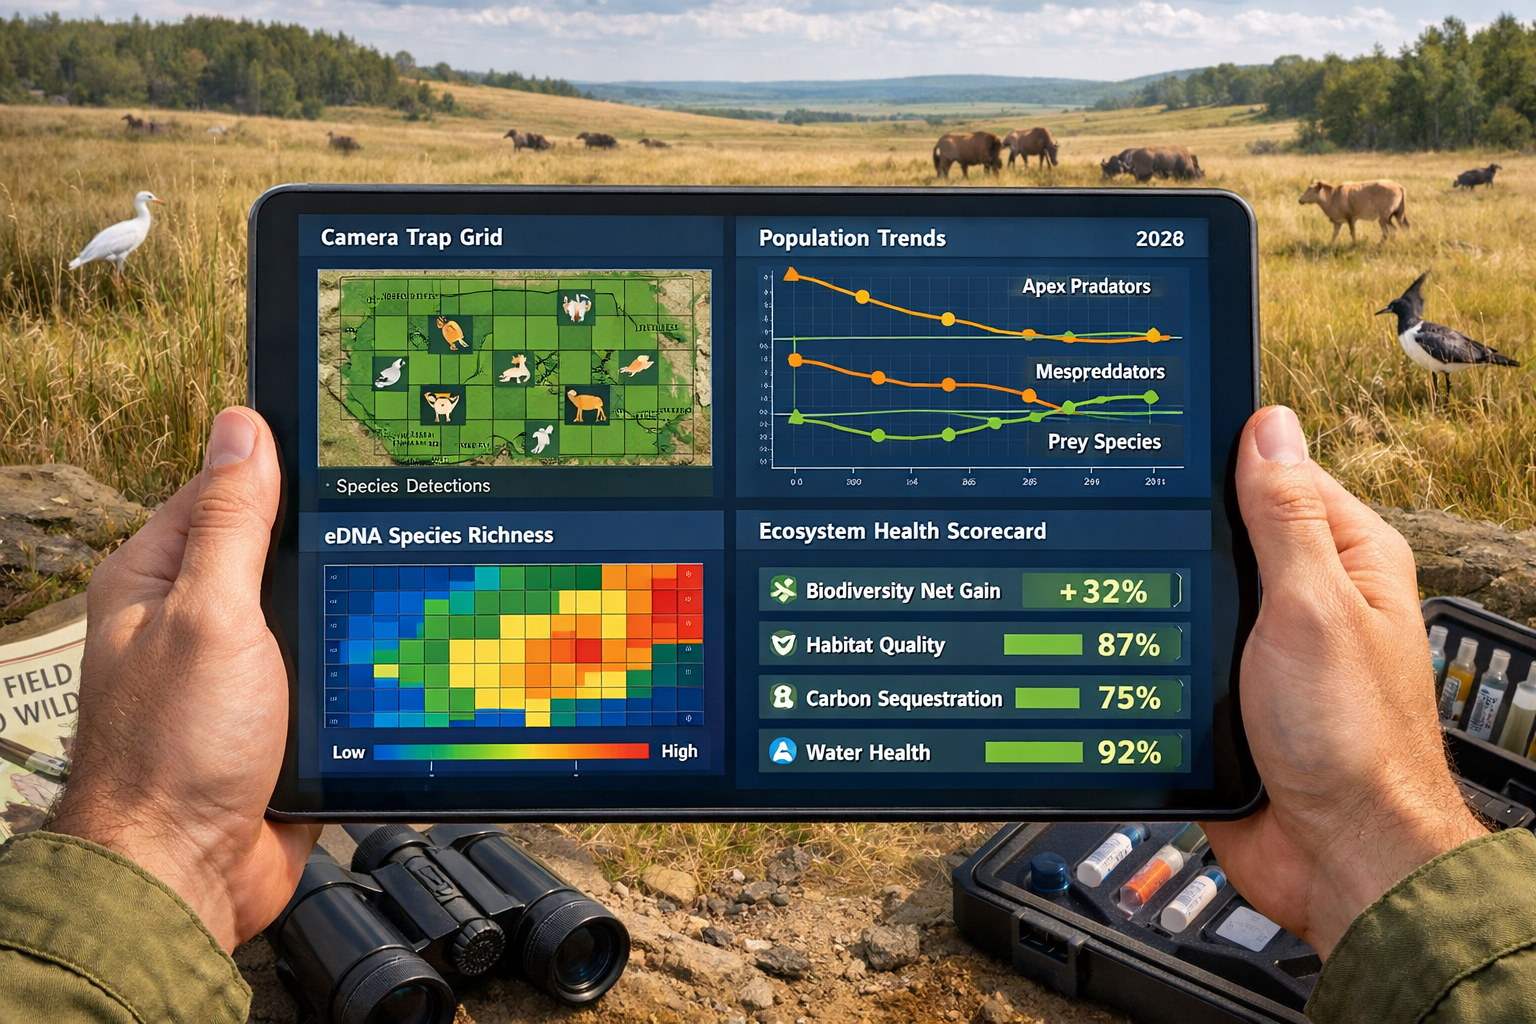
- Biodiversity Net Gain verification depends on robust trophic cascade monitoring to demonstrate functional ecosystem recovery
- Regional technical support centers now provide coordinated guidance for implementing advanced monitoring protocols across territories
Understanding Trophic Cascades in Restoration Context
What Are Trophic Cascades?
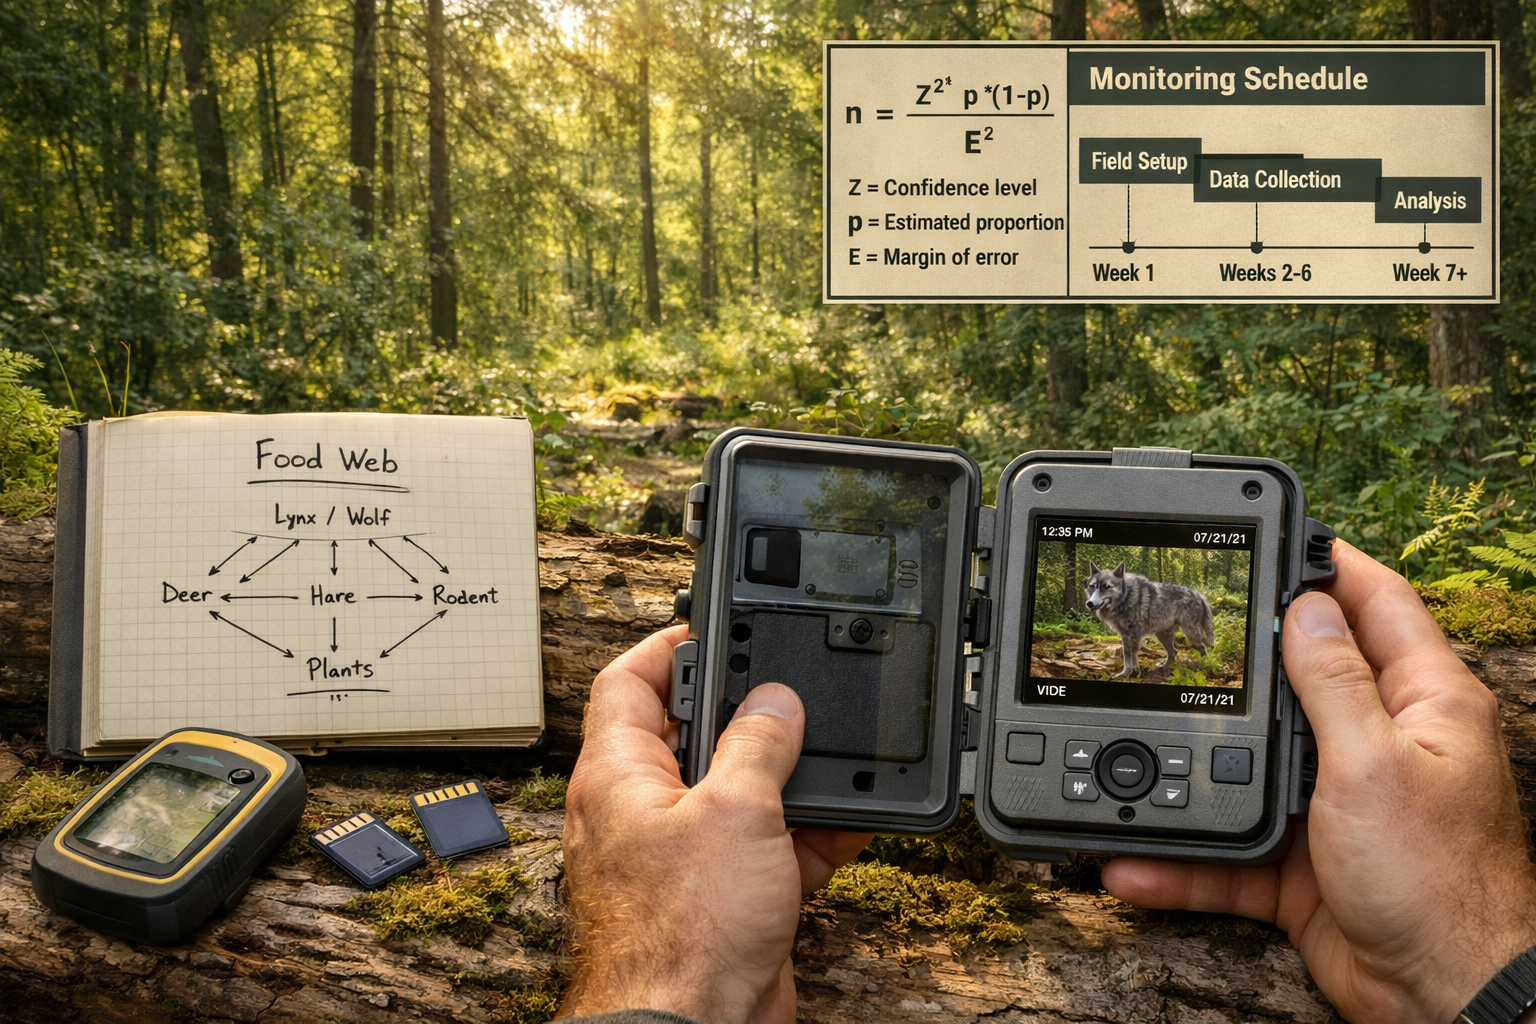
Trophic cascades occur when predators at the top of the food web influence the abundance and behavior of species multiple levels below them. When wolves return to a restored landscape, they don't just reduce deer populations—they change where deer graze, allowing vegetation to recover, which stabilizes riverbanks, creates habitat for songbirds, and supports insect populations. This ripple effect demonstrates ecosystem functionality.
Key cascade indicators include:
- 🐺 Apex predator presence and population density
- 🦌 Herbivore distribution patterns and behavior changes
- 🌳 Vegetation recovery in previously over-browsed areas
- 🐛 Invertebrate community diversity and abundance
- 💧 Water quality improvements from vegetation stabilization
Why Traditional Surveys Miss the Picture
Standard biodiversity surveys often count species without understanding their interactions. A restored woodland might host deer, foxes, and rabbits—but without monitoring their behavioral relationships, surveyors cannot determine if the ecosystem functions naturally. Are deer avoiding certain areas due to predator presence? Are mesopredators like foxes suppressed by larger carnivores, allowing ground-nesting bird populations to recover?
Research shows that monitoring facilitation cascades—interactions between multiple foundation species—provides more accurate restoration assessments than single-species focus [2]. For example, tracking both oysters and hooked mussels in reef restoration reveals that secondary foundation species can potentially double habitat filtration capacity.
Advanced Camera Trap Protocols for Predator-Prey Dynamics
Strategic Camera Placement for Cascade Detection
Trophic Cascade Monitoring in Restored Ecosystems: Advanced Protocols for 2026 Ecology Surveyors emphasizes systematic camera trap deployment that captures multi-species interactions rather than random wildlife photography. Surveyors should establish grids that cover:
- Predator travel corridors – Game trails, ridgelines, and habitat edges where apex predators move
- Resource concentration points – Water sources, salt licks, and feeding areas where prey species gather
- Refuge habitats – Dense vegetation or terrain features where prey avoid predation
- Comparison zones – Similar habitats outside the restoration area for baseline data
Optimal camera density: Research suggests 1 camera per 2-3 hectares for forest ecosystems, with higher density (1 per hectare) in fragmented or edge habitats where predator-prey interactions concentrate.
Data Collection Standards
Modern protocols require:
- 24/7 operation with infrared night capability
- Burst mode (3-5 images per trigger) to capture behavior sequences
- Video clips (10-30 seconds) for interaction documentation
- Metadata logging including temperature, moon phase, and weather conditions
- GPS coordinates for spatial analysis of species distribution
Field teams should check cameras every 2-4 weeks, replacing batteries and SD cards while minimizing disturbance. Data organization follows standardized naming conventions that facilitate analysis across multiple sites and seasons.
Analyzing Temporal and Spatial Patterns
Advanced analysis reveals predator-prey dynamics through:
Temporal segregation: Do prey species shift activity patterns to avoid predators? Comparing activity timestamps between predator and prey photos identifies behavioral cascades. If deer become primarily nocturnal in areas where wolves are active during daylight, this demonstrates functional predation pressure.
Spatial avoidance: Heat mapping species detections across camera grids shows whether prey avoid high-risk areas. Successful restoration creates "landscapes of fear" where herbivore distribution reflects natural predation risk.
Co-occurrence analysis: Statistical models determine whether species appear at the same locations more or less than random chance would predict. Negative co-occurrence between predators and prey indicates functional cascade effects.
For developers working on biodiversity net gain projects, camera trap data provides quantifiable evidence that restored habitats support natural predator-prey dynamics—a critical component of demonstrating ecological functionality beyond simple species presence.
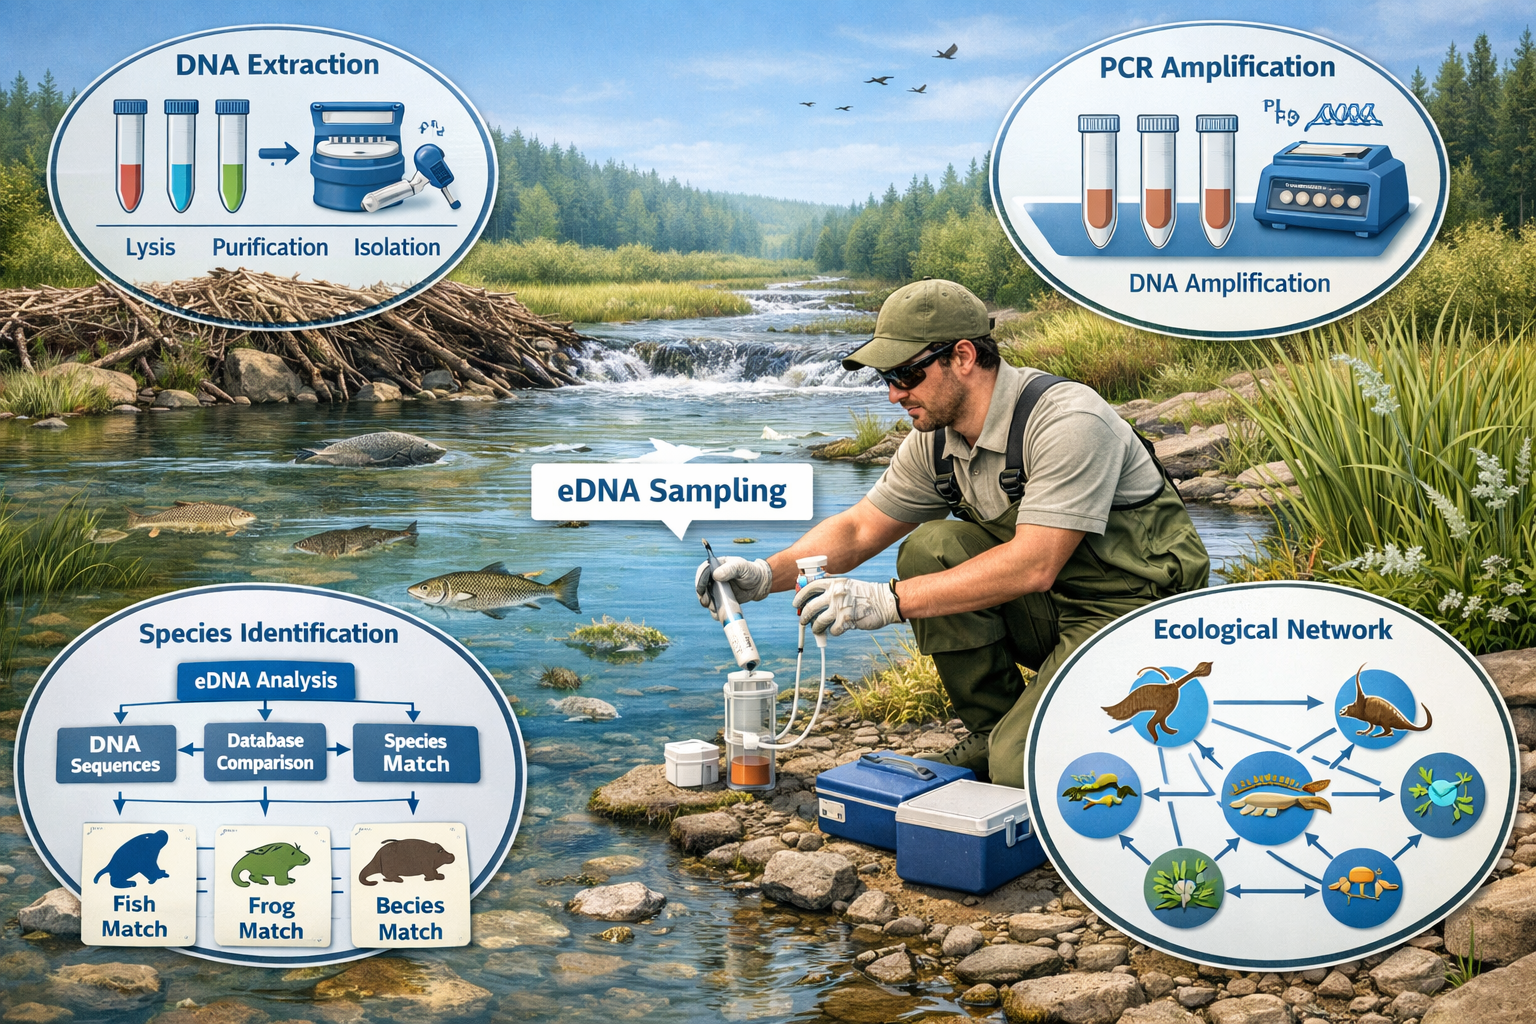
Environmental DNA (eDNA) Sampling for Comprehensive Species Detection
The eDNA Revolution in Trophic Monitoring
Environmental DNA sampling detects species through genetic material shed into water, soil, or air—eliminating the need to physically capture or observe organisms. For Trophic Cascade Monitoring in Restored Ecosystems: Advanced Protocols for 2026 Ecology Surveyors, eDNA provides several advantages:
✅ Detects cryptic species that avoid camera traps
✅ Identifies aquatic predators like otters, mink, and fish
✅ Reveals dietary relationships through gut content DNA in scat samples
✅ Monitors microbial communities that support food web foundations
✅ Provides early warning of invasive species arrivals
Recent advances in fatty acid biomarkers offer scalable tools for detecting early trophic recovery and identifying high-leverage intervention points [5]. These biochemical signatures reveal food web structure even when direct observation proves difficult.
Field Collection Protocols
Water sampling for aquatic cascades:
- Collect 1-2 liters from multiple depths and locations
- Filter through 0.45-micron membranes within 24 hours
- Preserve filters in ethanol or freezing
- Document water chemistry (pH, temperature, conductivity)
- Record GPS coordinates and habitat characteristics
Soil sampling for terrestrial cascades:
- Collect 50-100g samples from top 10cm of soil
- Sample near prey activity areas (burrows, feeding sites)
- Include predator scat when available for dietary analysis
- Store at -20°C until DNA extraction
- Maintain sterile technique to prevent contamination
Laboratory Analysis and Interpretation
Modern eDNA analysis uses metabarcoding—sequencing specific DNA regions that identify multiple species simultaneously. The COI (cytochrome oxidase I) gene works well for invertebrates, while 12S and 16S ribosomal RNA genes identify vertebrates.
Key metrics for cascade assessment:
- Species richness across trophic levels (predators, prey, producers)
- Relative abundance through DNA sequence read counts
- Beta diversity comparing restored sites to reference ecosystems
- Dietary breadth of predators through scat eDNA analysis
Surveyors should partner with accredited laboratories that follow standardized protocols. Results typically return within 2-4 weeks, providing rapid feedback on restoration progress.
The Framework for Ecosystem Restoration Monitoring launched in January 2026 emphasizes harmonized methodologies that enable data comparison across projects and regions [3]. eDNA protocols align with these international standards, ensuring restoration monitoring contributes to global biodiversity tracking.
Integrated Monitoring Frameworks for 2026 Standards
The FERM Framework and Regional Implementation
The Framework for Ecosystem Restoration Monitoring (FERM) provides standardized guidance for tracking restoration progress toward global targets. Launched at a regional workshop in Nairobi in January 2026, FERM addresses critical challenges including incomplete baselines and incompatible data collection methods [3].
Core FERM principles for trophic monitoring:
| Principle | Application to Cascade Monitoring |
|---|---|
| Standardized indicators | Use consistent metrics (predator:prey ratios, interaction rates) across sites |
| Reference system comparison | Match species composition and trophic structure to natural ecosystems |
| Multi-scale assessment | Track individual interactions, population dynamics, and community structure |
| Temporal consistency | Maintain monitoring through seasonal cycles and multi-year periods |
| Data interoperability | Format data for integration with national and international databases |
Regional technical centers now support implementation. The Regional Centre for Mapping of Resources for Development (RCMRD) officially launched as Sub-Regional Technical and Scientific Cooperation Support Centre for Eastern and Southern Africa in January 2026, establishing steering committees for technical guidance [3].
Combining Multiple Data Sources
Trophic Cascade Monitoring in Restored Ecosystems: Advanced Protocols for 2026 Ecology Surveyors requires integration of:
1. Direct observation data
- Camera trap images and videos
- Visual surveys during field visits
- Acoustic monitoring for vocal species
- Track and sign documentation
2. Molecular data
- eDNA species detection
- Dietary analysis from scat samples
- Biomarker indicators of trophic position
- Genetic connectivity between populations
3. Remote sensing data
- Satellite imagery showing vegetation recovery
- Drone surveys mapping habitat structure
- LiDAR data revealing three-dimensional complexity
- Thermal imaging detecting animal activity patterns
4. Ecosystem function measurements
- Vegetation browsing intensity
- Seed dispersal rates
- Nutrient cycling indicators
- Water quality parameters
The Rewilding Scale Approach
Researchers developed a "rewilding scale" to assess increases in ecosystem naturalness rather than targeting specific metrics [1]. This approach evaluates:
- Trophic complexity – Number of functional groups and interaction pathways
- Self-regulation – Ecosystem's ability to maintain balance without human intervention
- Structural diversity – Habitat heterogeneity created by species interactions
- Resilience indicators – Recovery capacity after disturbance events
For developers and landowners working on restoration projects, this scale provides flexible assessment criteria that recognize diverse restoration pathways while maintaining scientific rigor.
Addressing Common Monitoring Challenges
Challenge 1: Incomplete Baseline Data
Solution: Establish reference ecosystems in similar habitats that retain natural trophic structure. Compare restored sites to these references rather than attempting to recreate historical conditions that may no longer be achievable due to climate change or landscape fragmentation.
Challenge 2: Seasonal Variation
Solution: Maintain monitoring across complete annual cycles. Predator-prey dynamics shift dramatically between seasons—winter tracking reveals different patterns than summer observations. Minimum monitoring periods should span 2-3 years to capture inter-annual variation.
Challenge 3: Data Management and Analysis
Solution: Implement database systems that handle large image libraries and DNA sequence datasets. Cloud-based platforms enable collaborative analysis and automated species identification through AI image recognition. Training in statistical software (R, Python) becomes essential for modern surveyors.
Challenge 4: Cost Constraints
Solution: Prioritize monitoring effort based on restoration goals. Not every project requires full eDNA metabarcoding—strategic sampling of key indicator species may suffice. Camera trap networks can be rotated through sites rather than maintaining permanent coverage everywhere.
The cost-benefit analysis for comprehensive monitoring shows that upfront investment in robust protocols reduces long-term uncertainty and demonstrates restoration success for regulatory compliance.
Practical Implementation for Surveyors
Equipment Checklist for 2026 Protocols
Field equipment:
- 📷 Wildlife cameras (minimum 20MP, 1080p video, 0.3s trigger speed)
- 🧪 eDNA sampling kits (filters, preservatives, sterile containers)
- 📱 GPS units or smartphone apps with offline mapping
- 📓 Waterproof field notebooks and data sheets
- 🔋 Spare batteries and solar charging systems
- 🎒 Field safety equipment (first aid, communication devices)
Laboratory partnerships:
- Establish relationships with accredited eDNA analysis facilities
- Verify laboratory follows standardized metabarcoding protocols
- Confirm turnaround times meet project reporting deadlines
- Negotiate bulk pricing for multi-site monitoring programs
Data management systems:
- Cloud storage with automated backup (minimum 1TB capacity)
- Image management software with AI species identification
- Statistical analysis platforms (R Studio, Python with ecological packages)
- GIS software for spatial analysis (QGIS, ArcGIS)
- Database systems compatible with national reporting frameworks
Training and Certification
Modern surveyors need skills beyond traditional field biology:
- Camera trap deployment and maintenance – Understanding trigger sensitivity, placement strategy, and weatherproofing
- eDNA sampling technique – Maintaining sterile protocols and proper sample preservation
- Statistical analysis – Occupancy modeling, co-occurrence analysis, and community ecology metrics
- Data visualization – Creating compelling graphics that communicate cascade dynamics to stakeholders
- Report writing – Documenting methods and results according to Biodiversity Net Gain requirements
Professional development opportunities include workshops offered by regional technical centers, online courses in conservation technology, and peer learning through restoration monitoring networks.
Reporting and Verification
Trophic Cascade Monitoring in Restored Ecosystems: Advanced Protocols for 2026 Ecology Surveyors must produce documentation that satisfies regulatory requirements while advancing scientific understanding. Reports should include:
Executive summary:
- Clear statement of restoration objectives
- Key findings on trophic cascade establishment
- Comparison to reference ecosystems
- Recommendations for adaptive management
Methods section:
- Detailed protocols enabling replication
- Equipment specifications and settings
- Sampling design and statistical power analysis
- Quality control procedures
Results presentation:
- Species detection lists across trophic levels
- Temporal and spatial activity patterns
- Statistical analysis of predator-prey relationships
- Photographic and video documentation
- Comparison to baseline and reference data
Ecological interpretation:
- Assessment of cascade functionality
- Identification of missing trophic links
- Evaluation of ecosystem self-regulation
- Projection of restoration trajectory
For architects and planners integrating restoration into development projects, these reports provide evidence that ecological compensation delivers genuine biodiversity gains rather than superficial habitat creation.
Future Directions in Cascade Monitoring
Emerging Technologies
Artificial intelligence and machine learning are revolutionizing image analysis. Modern algorithms identify species, count individuals, and classify behaviors automatically—reducing analysis time from weeks to hours. AI systems trained on millions of camera trap images now achieve 95%+ accuracy for common species.
Passive acoustic monitoring complements visual detection by recording vocalizations continuously. Automated species identification from audio files reveals presence of vocal predators (owls, canids) and prey (songbirds, frogs) that camera traps miss.
Drone-based thermal imaging detects animal activity across large areas, mapping predator hunting patterns and prey distribution without ground disturbance. Integration with camera trap data provides three-dimensional understanding of cascade dynamics.
Stable isotope analysis of tissues reveals trophic position and dietary sources with precision impossible through observation alone. Hair, feathers, and tissue samples collected non-invasively provide biochemical evidence of food web structure.
Integration with Climate Monitoring
Trophic cascades respond to climate variables—temperature affects predator hunting efficiency, precipitation influences prey habitat selection, and seasonal timing shifts alter predator-prey synchrony. Modern protocols integrate climate sensors with biological monitoring to understand how restoration sites will function under changing conditions.
Contribution to Global Biodiversity Tracking
Data from individual restoration projects feeds into national and international biodiversity databases. The Target 2 Road Map uses regional technical centers to compile and validate restoration monitoring data, creating unprecedented visibility into global ecosystem recovery [3].
Surveyors following standardized protocols contribute to scientific understanding while meeting regulatory requirements—their field observations become part of humanity's collective effort to reverse biodiversity decline.
Conclusion
Trophic Cascade Monitoring in Restored Ecosystems: Advanced Protocols for 2026 Ecology Surveyors represents the convergence of cutting-edge technology with fundamental ecological principles. Camera traps and eDNA sampling provide unprecedented ability to track predator-prey dynamics, while standardized frameworks ensure data contributes to global restoration targets.
The path forward requires surveyors to embrace new tools while maintaining rigorous field methodology. Success depends on understanding that restoration extends beyond planting trees or reintroducing species—it means rebuilding the complex interactions that make ecosystems self-sustaining and resilient.
Actionable Next Steps
For ecology surveyors:
- Invest in camera trap equipment and eDNA sampling supplies
- Establish partnerships with accredited molecular laboratories
- Develop skills in statistical analysis and data visualization
- Connect with regional technical support centers for protocol guidance
- Begin baseline monitoring in reference ecosystems for comparison
For project managers:
- Allocate sufficient budget for multi-year monitoring programs
- Integrate trophic cascade assessment into Biodiversity Net Gain plans
- Establish data management systems before field work begins
- Schedule regular reporting aligned with regulatory deadlines
- Plan adaptive management responses based on monitoring results
For landowners and developers:
- Understand that functional ecosystem restoration requires trophic complexity
- Engage qualified surveyors early in project planning
- Recognize monitoring as investment in demonstrating restoration success
- Support long-term tracking beyond minimum compliance periods
- Share results to advance collective restoration knowledge
The 2030 deadline for global restoration targets approaches rapidly. Ecology surveyors equipped with advanced monitoring protocols will determine whether restored ecosystems truly function as living, self-regulating systems—or remain ecological facades that fail to support biodiversity recovery. The tools exist. The frameworks are established. The challenge now lies in implementation.
References
[1] Impact Of Rewilding On Ecosystem Resilience – https://rewilding.academy/impact-of-rewilding-on-ecosystem-resilience/
[2] academic.oup – https://academic.oup.com/bioscience/article/76/1/21/8261311
[5] 1365 2664 – https://besjournals.onlinelibrary.wiley.com/doi/10.1111/1365-2664.70355
