
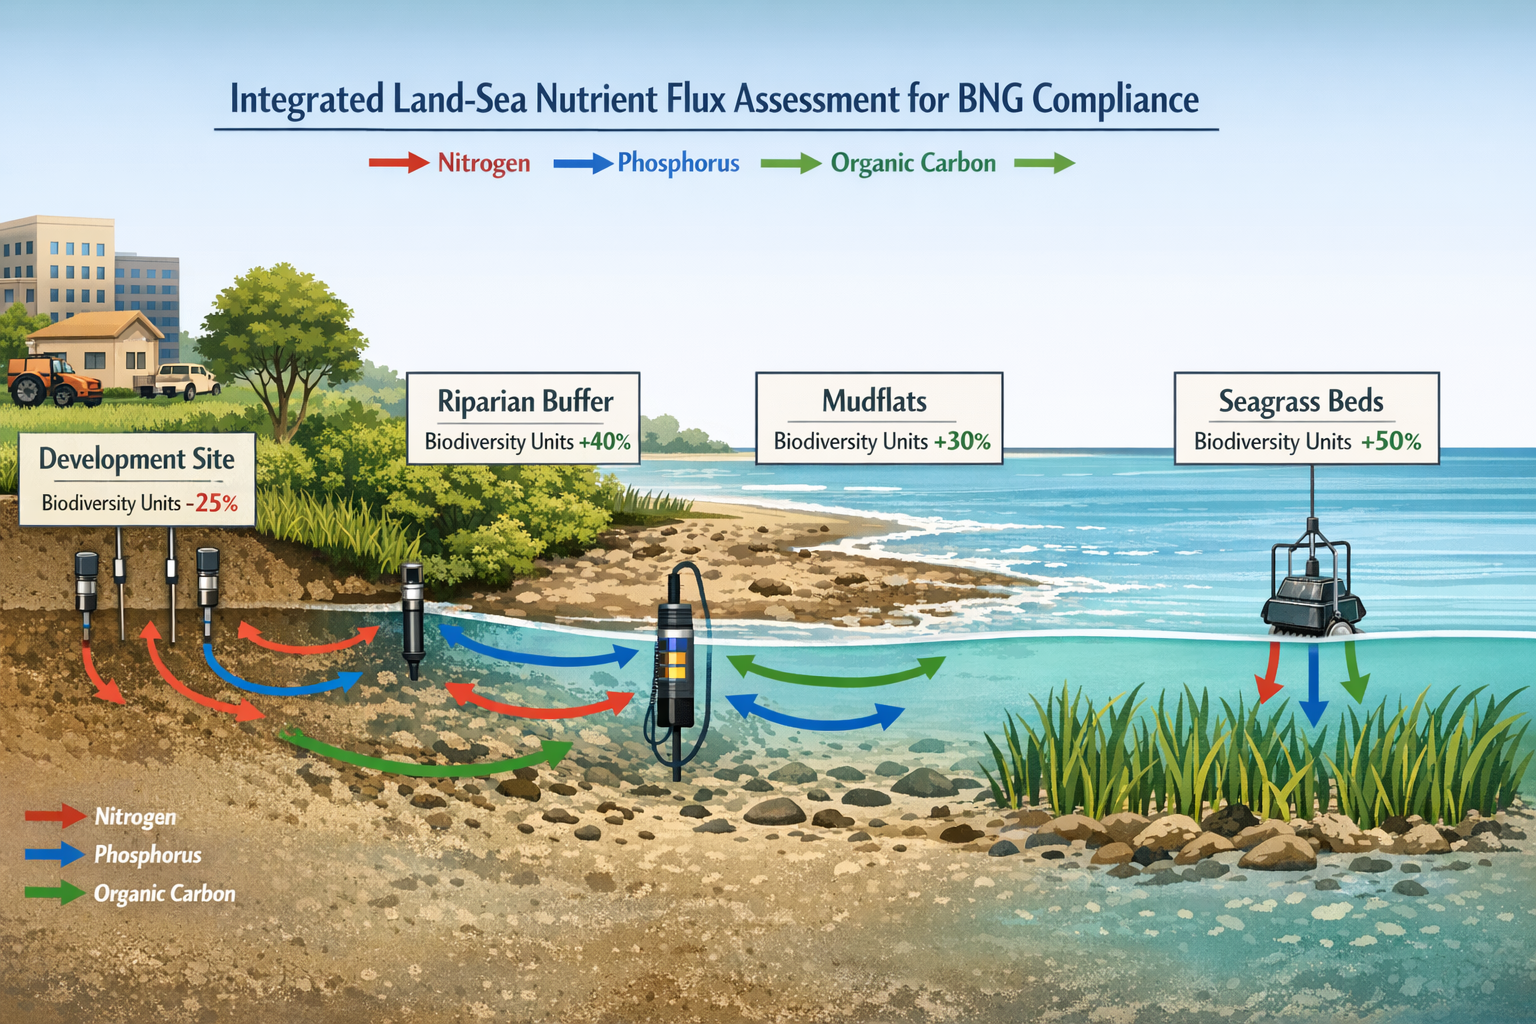
Coastal ecosystems process more than 80% of global nutrient runoff before it reaches the open ocean, yet traditional Biodiversity Net Gain (BNG) assessments often treat terrestrial and marine habitats as separate entities. This disconnect creates critical gaps in understanding how development projects truly impact estuarine biodiversity. In 2026, ecologists are bridging this divide with integrated Land-Sea Interaction Surveys for Coastal BNG: Ecologist Protocols for Measuring Nutrient Fluxes in 2026 Estuarine Biodiversity Assessments that combine environmental DNA (eDNA) sampling with remote sensing technology to capture the complete picture of nutrient cycling at the land-water interface.
The implementation of Biodiversity Net Gain requirements has exposed a fundamental challenge: coastal developments affect both terrestrial and marine ecosystems simultaneously, but standard assessment protocols rarely account for the dynamic nutrient exchanges that determine biodiversity outcomes. As the UK government advances its Marine Net Gain (MNG) framework[4], ecologists need practical field methodologies that quantify these hidden connections.
Key Takeaways
✅ Integrated approach required: Coastal BNG assessments must measure nutrient fluxes across land-sea boundaries to accurately calculate biodiversity impacts in estuarine zones
✅ Combined methodology: Modern 2026 protocols merge eDNA sampling, remote sensing, and traditional water chemistry to establish comprehensive baseline conditions
✅ Marine Net Gain evolution: UK frameworks now recognize that pooled marine contributions require robust nutrient flux data to validate habitat restoration effectiveness[4]
✅ Regulatory compliance: Land-Sea Interaction Surveys for Coastal BNG provide the evidence base needed for planning applications affecting transitional waters
✅ Technology integration: Autonomous sensors and multispectral imaging reduce survey costs while improving temporal resolution of nutrient monitoring
Understanding the Land-Sea Interaction Challenge in Coastal BNG
Why Traditional BNG Assessments Fall Short at Coastlines
Standard biodiversity impact assessments typically evaluate terrestrial habitats using the Defra metric, which calculates biodiversity units based on habitat type, condition, and strategic significance. However, this approach encounters significant limitations in coastal zones where:
🌊 Tidal dynamics create constantly shifting habitat boundaries
🔄 Nutrient cycling links terrestrial runoff directly to marine productivity
🦐 Estuarine species depend on both aquatic and terrestrial food sources
⚡ Salinity gradients produce unique transitional habitats not captured in standard classifications
The Center for Coastal Studies emphasizes that "physical processes responsible for coastal evolution"[3] fundamentally depend on land-sea interactions, yet most BNG protocols measure these environments separately. This creates artificial divisions in ecosystems that function as integrated units.
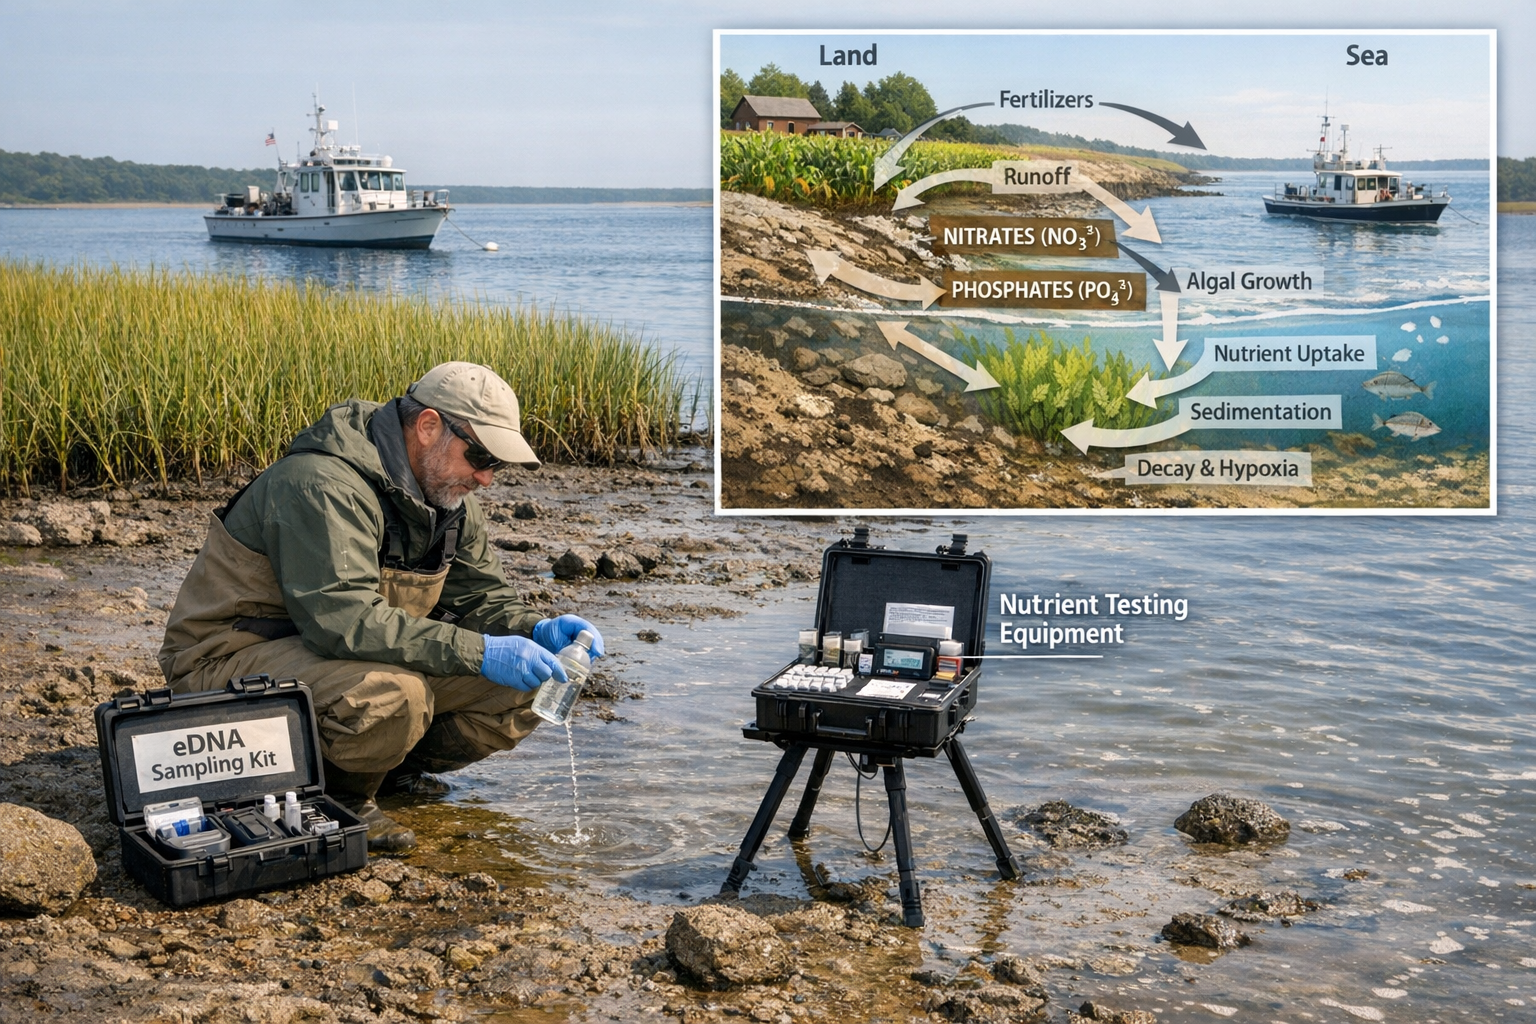
The Nutrient Flux Connection to Biodiversity Outcomes
Nutrient fluxes—particularly nitrogen and phosphorus movements between land and sea—directly determine the carrying capacity and species composition of estuarine habitats. When development projects alter drainage patterns, vegetation cover, or soil structure in coastal watersheds, the downstream effects cascade through:
- Phytoplankton productivity changes affecting the entire food web
- Dissolved oxygen levels impacting fish and invertebrate survival
- Macroalgae growth potentially smothering seagrass beds
- Sediment chemistry altering benthic community structure
Without measuring these nutrient pathways, biodiversity assessments cannot accurately predict whether proposed mitigation measures will achieve genuine net gain in transitional waters.
Core Components of Land-Sea Interaction Surveys for Coastal BNG
Establishing Survey Boundaries and Sampling Zones
Effective Land-Sea Interaction Surveys for Coastal BNG: Ecologist Protocols for Measuring Nutrient Fluxes in 2026 Estuarine Biodiversity Assessments begin with defining appropriate spatial boundaries. Unlike terrestrial surveys with clear property lines, coastal assessments must account for:
Hydrological catchment areas 💧
- Identify all freshwater inputs to the estuary within the zone of influence
- Map groundwater discharge points and spring lines
- Delineate surface runoff pathways from development sites
Tidal prism zones 🌊
- Calculate the volume of water exchanged during tidal cycles
- Determine residence time of nutrients in different estuary sections
- Establish mixing zones where land-derived nutrients interact with marine waters
Habitat transition gradients 🌿
- Survey from supratidal vegetation through intertidal zones to subtidal habitats
- Document salt marsh, mudflat, and seagrass bed extents
- Identify critical spawning and nursery areas for estuarine species
The Estuarine & Coastal Sciences Association's 2026 conference in Brussels (24-27 August) aims to "connect marine scientists and policy-makers to respond to the triple planetary crisis"[6], highlighting the urgency of developing standardized approaches for these complex environments.
Field Protocols for Nutrient Flux Measurement
Water Chemistry Sampling Strategies
Comprehensive nutrient flux assessment requires temporal and spatial sampling that captures variability across tidal cycles, seasons, and weather conditions:
| Parameter | Sampling Frequency | Method | Purpose |
|---|---|---|---|
| Dissolved nitrogen (NH₄⁺, NO₃⁻, NO₂⁻) | Biweekly, 3 tidal stages | Colorimetric analysis | Track reactive nitrogen availability |
| Dissolved phosphorus (PO₄³⁻) | Biweekly, 3 tidal stages | Molybdate blue method | Assess limiting nutrient status |
| Total suspended solids | Weekly | Gravimetric filtration | Quantify sediment-bound nutrients |
| Dissolved oxygen | Continuous (sensors) | Optical/electrochemical | Identify eutrophication risk |
| Salinity | Continuous (sensors) | Conductivity | Map mixing zones and stratification |
| Chlorophyll-a | Biweekly | Fluorometric analysis | Measure phytoplankton response |
Best practice tip: Install automated water quality sondes at strategic locations to capture high-frequency data during storm events when nutrient pulses are greatest.
Sediment Nutrient Pool Assessment
Estuarine sediments act as both nutrient sinks and sources depending on redox conditions. Protocols should include:
- Sediment core collection at 5-10 locations across the gradient (0-20cm depth)
- Porewater extraction to measure dissolved nutrients in interstitial water
- Organic matter content via loss-on-ignition (proxy for nutrient storage capacity)
- Grain size analysis to correlate with nutrient retention potential
- Benthic flux chambers to directly measure sediment-water nutrient exchange rates
Integrating eDNA Technology for Biodiversity Baselines
Environmental DNA sampling has revolutionized biodiversity monitoring by detecting species presence without direct observation. For Land-Sea Interaction Surveys for Coastal BNG: Ecologist Protocols for Measuring Nutrient Fluxes in 2026 Estuarine Biodiversity Assessments, eDNA provides:
Comprehensive species inventories 📊
- Water samples (1-2L) filtered through 0.45μm membranes capture DNA from all organisms
- Metabarcoding identifies fish, invertebrates, algae, and microbial communities
- Detects rare or cryptic species missed by traditional surveys
Functional diversity assessment 🔬
- Microbial community composition indicates nutrient cycling capacity
- Presence of nitrogen-fixing and denitrifying bacteria reveals ecosystem function
- Algal diversity patterns correlate with nutrient enrichment gradients
Cost-effective temporal monitoring 💰
- Single technician can collect samples across multiple sites in one day
- Laboratory analysis provides standardized, reproducible results
- Repeat sampling tracks biodiversity changes through development phases
When combined with nutrient flux data, eDNA results reveal cause-and-effect relationships between nutrient loading and community composition—essential evidence for demonstrating BNG compliance.
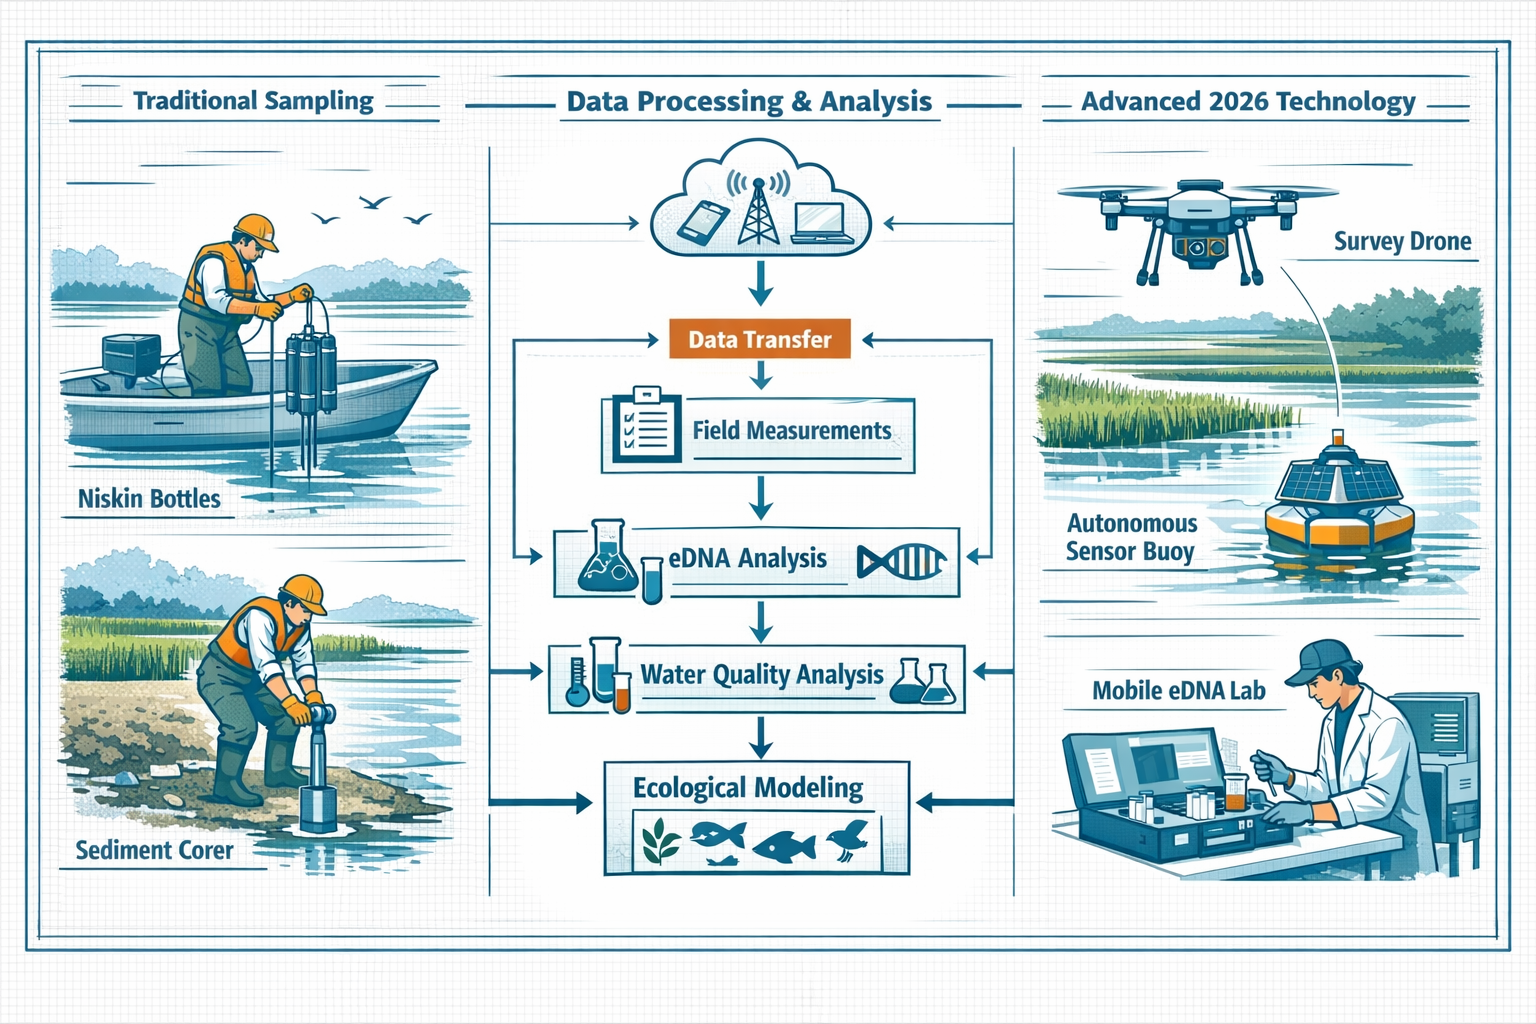
Remote Sensing and Spatial Analysis Tools
Modern 2026 technology enables ecologists to extend point measurements across entire estuaries:
Multispectral and hyperspectral imaging 🛰️
- Drone-mounted sensors map chlorophyll concentration, turbidity, and suspended sediments
- Satellite imagery tracks seasonal changes in primary productivity
- Thermal imaging identifies groundwater discharge zones and thermal pollution
LiDAR and bathymetric surveys 📡
- High-resolution topography defines intertidal habitat extent and elevation gradients
- Bathymetric data models tidal flow patterns and residence times
- Change detection quantifies erosion and accretion affecting habitat area
GIS integration for nutrient modeling 🗺️
- Watershed analysis tools calculate nutrient loading from land use patterns
- Hydrodynamic models predict nutrient transport pathways
- Spatial statistics identify hotspots of biodiversity-nutrient relationships
These technologies transform Land-Sea Interaction Surveys from labor-intensive field campaigns into efficient, data-rich assessments that support robust biodiversity plans.
Applying Survey Results to BNG Calculations and Marine Net Gain
Translating Nutrient Flux Data into Biodiversity Metrics
The critical question for developers and planners is: How do nutrient measurements convert to biodiversity units? While the UK's Marine Net Gain framework acknowledges that "more work [is] needed in the delivery and metric"[4], emerging approaches include:
Condition assessment refinement ⭐
- Nutrient enrichment indicators (N:P ratios, chlorophyll levels) adjust habitat condition scores
- Eutrophic conditions downgrade estuarine habitat quality in metric calculations
- Oligotrophic reference conditions establish baseline for net gain targets
Functional connectivity scoring 🔗
- Nutrient flux pathways that maintain natural productivity patterns increase strategic significance multipliers
- Disrupted nutrient cycling reduces connectivity scores
- Restored natural flow regimes generate biodiversity unit credits
Temporal persistence factors ⏱️
- Stable nutrient regimes support higher confidence in long-term biodiversity outcomes
- Seasonal flux variability incorporated into risk assessments
- Monitoring requirements scaled to nutrient loading uncertainty
Case Study Framework: Coastal Development Scenario
Consider a proposed residential development adjacent to a salt marsh estuary:
Baseline survey findings:
- Current dissolved inorganic nitrogen (DIN): 15-25 μM (moderate enrichment)
- eDNA detects 47 fish species including protected European eel
- Salt marsh extent: 3.2 hectares in "moderate" condition
- Sediment nutrient pools indicate historical eutrophication
Predicted impacts:
- Increased stormwater runoff could raise DIN to 35-50 μM (high enrichment)
- Altered salinity gradients may shift species composition
- Potential loss of 0.4 hectares salt marsh to development footprint
Mitigation through nutrient flux management:
- Constructed wetland treatment system to reduce DIN by 60%
- Restored tidal connectivity to adjacent degraded marsh (1.8 hectares)
- Enhanced riparian buffer with native vegetation (0.6 hectares)
BNG outcome calculation:
- Habitat creation and enhancement generates +4.2 biodiversity units
- Improved nutrient conditions upgrade marsh condition from "moderate" to "good"
- Functional connectivity restoration adds strategic significance multiplier
- Net result: 10% biodiversity net gain achieved
This approach demonstrates how Land-Sea Interaction Surveys for Coastal BNG: Ecologist Protocols for Measuring Nutrient Fluxes in 2026 Estuarine Biodiversity Assessments provide the quantitative foundation for defensible BNG claims in coastal settings.
Marine Net Gain and Pooled Contributions
The UK government's Marine Net Gain framework proposes "pooled developer contributions for large-scale marine projects (seagrass restoration, kelp forests, salt marshes)"[4] rather than site-by-site mitigation. This approach requires:
Standardized nutrient baseline data 📋
- Regional nutrient flux surveys establish reference conditions
- Developers contribute to shared monitoring programs
- Pooled funds support strategic restoration at optimal locations
Outcome-based verification ✅
- Nutrient flux improvements demonstrate restoration success
- eDNA monitoring confirms biodiversity gains
- Adaptive management adjusts interventions based on measured results
Equivalency calculations ⚖️
- Nutrient reduction credits quantify development impact offsets
- Habitat banking mechanisms link nutrient improvements to biodiversity units
- Trading platforms enable efficient matching of impacts and offsets
For developers evaluating off-site versus on-site BNG delivery, understanding nutrient flux implications helps determine the most cost-effective compliance pathway.
Practical Implementation Guidance for Ecologists and Developers
Survey Timing and Seasonal Considerations
Estuarine ecosystems exhibit dramatic seasonal variability that must be captured in baseline assessments:
Spring surveys (March-May) 🌸
- Peak freshwater discharge and nutrient loading
- Spring phytoplankton bloom conditions
- Migratory fish species arrival and spawning
Summer surveys (June-August) ☀️
- Maximum primary productivity and oxygen demand
- Lowest dissolved oxygen levels (hypoxia risk)
- Peak recreational use and anthropogenic pressure
Autumn surveys (September-November) 🍂
- Storm event sampling captures episodic nutrient pulses
- Senescent vegetation releases stored nutrients
- Juvenile fish outmigration patterns
Winter surveys (December-February) ❄️
- Baseline low-productivity conditions
- Storm-driven sediment resuspension
- Reduced biological nutrient uptake
Minimum recommendation: Four seasonal survey campaigns over 12-18 months to capture inter-annual variability and establish robust baseline conditions for biodiversity net gain reporting.
Quality Assurance and Data Management
Rigorous QA/QC protocols ensure survey results withstand regulatory scrutiny:
Field protocols 📝
- Standard operating procedures for sample collection and preservation
- Chain-of-custody documentation for laboratory submissions
- Field duplicate samples (10% of total) to assess sampling variability
- Equipment calibration logs and maintenance records
Laboratory analysis 🔬
- UKAS-accredited laboratories for nutrient analysis
- Method detection limits appropriate for estuarine concentrations
- Certified reference materials to verify accuracy
- Blind duplicate analysis to assess precision
Data validation 💻
- Automated range checks flag outliers for review
- Ion balance calculations verify water chemistry consistency
- Spatial and temporal pattern analysis identifies anomalies
- Independent peer review before submission to planning authorities
Cost Considerations and Budget Planning
Land-Sea Interaction Surveys for Coastal BNG represent additional investment beyond standard terrestrial assessments. Typical cost components include:
| Survey Component | Estimated Cost Range | Frequency |
|---|---|---|
| Water chemistry analysis | £150-300 per sample set | 8-12 events |
| Sediment nutrient analysis | £400-600 per location | 5-10 sites |
| eDNA metabarcoding | £800-1,200 per sample | 4-8 samples |
| Remote sensing (drone) | £1,500-3,000 per campaign | 2-4 campaigns |
| Autonomous sensor deployment | £8,000-15,000 (equipment + maintenance) | Continuous 12 months |
| Data analysis and reporting | £5,000-12,000 | One-time |
| Total project cost | £25,000-50,000 | 12-18 months |
While significant, these investments provide defensible evidence for achieving biodiversity net gain without risk of planning delays or enforcement action. For large coastal developments, survey costs typically represent less than 0.5% of total project value.
Regulatory Compliance and Stakeholder Engagement
Successful implementation requires early engagement with:
Local Planning Authorities 🏛️
- Confirm survey scope meets pre-application requirements
- Clarify expectations for Marine Net Gain contributions
- Establish monitoring and reporting schedules
Environment Agency 🌊
- Coordinate with Water Framework Directive assessments
- Align with catchment management plans
- Ensure compliance with environmental permits
Natural England 🦋
- Address implications for designated sites (SSSIs, SACs, SPAs)
- Incorporate protected species considerations
- Align with national habitat network priorities
Local communities and stakeholders 👥
- Communicate survey findings and mitigation approaches
- Address concerns about water quality and ecosystem health
- Build support for restoration initiatives
The Estuarine & Coastal Sciences Association conference[2] and similar professional forums provide valuable networking opportunities to stay current with evolving best practices and regulatory expectations.
Future Directions: Advancing Coastal BNG Science in 2026 and Beyond
Emerging Technologies and Methodologies
The field of Land-Sea Interaction Surveys for Coastal BNG continues to evolve rapidly:
Artificial intelligence and machine learning 🤖
- Automated species identification from eDNA sequences
- Predictive models linking nutrient loads to biodiversity outcomes
- Real-time anomaly detection in sensor networks
Biogeochemical sensors 🔬
- In-situ nutrient analyzers providing continuous data streams
- Isotope analyzers tracing nutrient sources and cycling pathways
- Optical sensors measuring dissolved organic matter quality
Citizen science integration 👨🔬
- Mobile apps for community-based water quality monitoring
- Crowdsourced observations of indicator species
- Public engagement building support for coastal conservation
Policy Development and Standardization
As Marine Net Gain frameworks mature, expect:
Standardized protocols 📖
- Defra guidance documents for coastal BNG assessments
- Accreditation schemes for survey practitioners
- Quality standards for nutrient flux monitoring
Metric refinement 📊
- Explicit nutrient flux parameters in biodiversity calculations
- Functional connectivity scores incorporating biogeochemical processes
- Risk-adjusted condition assessments for estuarine habitats
Market mechanisms 💷
- Nutrient credit trading platforms linked to biodiversity units
- Biodiversity unit markets expanded to coastal zones
- Standardized pricing for marine habitat restoration
Research Priorities
Critical knowledge gaps requiring further investigation include:
- Quantitative relationships between nutrient flux changes and biodiversity unit calculations
- Optimal spatial and temporal sampling designs for different estuary types
- Cost-benefit analysis of different survey technology combinations
- Long-term effectiveness of nutrient-based mitigation measures
- Integration of climate change projections into baseline assessments
Academic conferences like the 2026 ECSA meeting in Brussels[1][6] provide forums for sharing research findings and advancing the science underlying coastal BNG practice.
Conclusion: Implementing Robust Coastal BNG Through Integrated Nutrient Monitoring
Land-Sea Interaction Surveys for Coastal BNG: Ecologist Protocols for Measuring Nutrient Fluxes in 2026 Estuarine Biodiversity Assessments represent a fundamental shift in how development impacts are evaluated in coastal zones. By bridging the artificial divide between terrestrial and marine environments, these integrated approaches reveal the hidden nutrient cycles that determine biodiversity outcomes in transitional waters.
The combination of traditional water chemistry, cutting-edge eDNA technology, and remote sensing provides ecologists with powerful tools to establish comprehensive baselines and predict development impacts with unprecedented accuracy. As the UK's Marine Net Gain framework evolves[4], these methodologies will become essential for demonstrating compliance and achieving genuine environmental improvements.
Actionable Next Steps for Stakeholders
For developers planning coastal projects:
- Commission preliminary nutrient flux assessments during site selection to identify constraints
- Budget adequately for 12-18 month baseline surveys in project timelines
- Engage specialist ecologists with estuarine expertise early in design phases
- Explore off-site biodiversity unit options if on-site mitigation proves challenging
For ecologists conducting surveys:
- Invest in training for eDNA sampling and remote sensing technologies
- Establish partnerships with accredited analytical laboratories
- Develop standardized protocols aligned with emerging regulatory guidance
- Participate in professional networks to share best practices
For planning authorities:
- Develop clear expectations for coastal BNG assessments in pre-application guidance
- Build internal capacity to evaluate nutrient flux data in planning decisions
- Coordinate with Environment Agency and Natural England on complex applications
- Support pilot projects testing innovative monitoring approaches
For landowners considering habitat banking:
- Assess potential for nutrient reduction credits on coastal properties
- Investigate opportunities to sell biodiversity units from restoration projects
- Engage with emerging Marine Net Gain pooled contribution schemes
- Establish baseline monitoring to document improvement over time
The transition to comprehensive coastal BNG assessments presents challenges, but also opportunities to deliver development that genuinely enhances rather than degrades precious estuarine ecosystems. By measuring the nutrient fluxes that drive biodiversity, ecologists provide the evidence base for sustainable coastal development in 2026 and beyond.
References
[1] Ecsa 61 Bridging Gap Between Science And Policy Estuarine And Coastal Marine Biodiversity – https://ecsa.international/event/2026/ecsa-61-bridging-gap-between-science-and-policy-estuarine-and-coastal-marine-biodiversity
[2] estuarinecoastalconference – https://www.estuarinecoastalconference.com
[3] Land Sea Interaction – https://coastalstudies.org/our-work/marine-geology/land-sea-interaction/
[4] Marine Biodiversity Net Gain Explained – https://gaiacompany.io/marine-biodiversity-net-gain-explained/
[6] Diversea News Estuarine Coastal Sciences Association Meeting 2026 – https://www.ntnu.edu/diversea/diversea-news-estuarine-coastal-sciences-association-meeting-2026
