

Across England, the average woodland patch has shrunk by more than 40% since 1930, yet the number of isolated fragments has multiplied, a pattern that exposes a critical weakness in how biodiversity value is measured at the baseline stage of development appraisal. Applying habitat fragmentation metrics for BNG baselines and advanced survey techniques for fragmented landscapes is no longer an optional refinement; it is fast becoming a professional standard, particularly as the statutory biodiversity net gain (BNG) framework extends to nationally significant infrastructure projects (NSIPs) and local planning authorities demand finer-grained evidence of pre-development ecological condition.
This article sets out the scientific basis for fragmentation metrics, explains how they interact with the statutory metric, and equips practitioners with the advanced survey methods needed to build defensible, high-resolution baselines on fragmented sites.
Key Takeaways
- The statutory BNG metric does not fully capture connectivity or spatial arrangement, making supplementary fragmentation indices essential for defensible baselines on complex sites.
- DEFRA's June 2026 NSIP guidance confirms that only habitats negatively impacted by development need to be included in the baseline, increasing the relative importance of accurately characterising small, high-value fragments [2].
- Scientific evidence shows that habitat loss and fragmentation have distinct effects; BNG surveys must distinguish between the two to target mitigation effectively [13, see research notes].
- Advanced techniques, drone mapping, GIS-derived patch metrics, and environmental DNA (eDNA), provide the spatial resolution needed to quantify fragmentation at baseline without disproportionate cost.
- A 10% net gain requirement applies per habitat type in many local authority areas, driving more detailed mapping of hedgerows, tree lines, and waterbodies as connective features [7].
Why the Statutory Metric Alone Is Not Enough for Fragmented Sites
The statutory biodiversity metric calculates biodiversity units as the product of habitat area, condition, distinctiveness, strategic significance, and, in earlier iterations, connectivity. Professional analysis has highlighted that connectivity has effectively been removed from the current statutory metric, raising legitimate concern that fragmentation is under-represented in baseline calculations [6]. For a uniform block of semi-improved grassland, this gap may be minor. For a site threaded with ancient hedgerows, veteran trees, and remnant calcareous grassland patches separated by arable land, the omission can be significant.
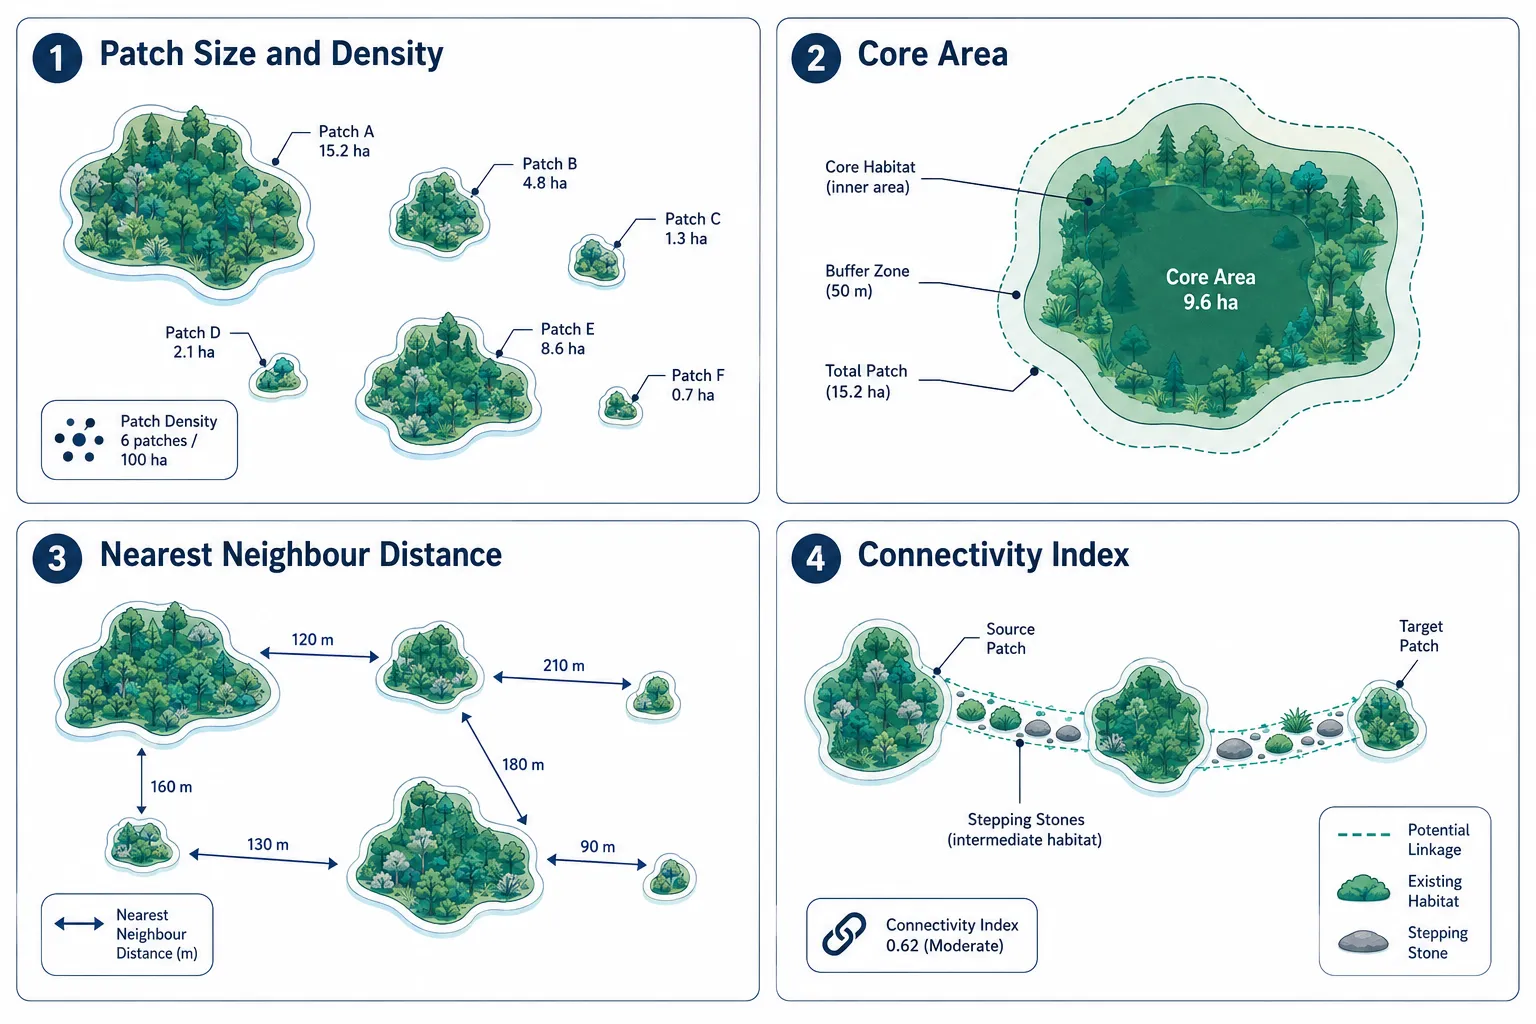
Scientific classification of landscape metrics, as set out in CBD Technical Series No. 32, groups fragmentation indicators into five categories: composition, patch size and density, patch shape, configuration, and route networks [1]. Each category captures a different dimension of how habitats are arranged across a landscape:
| Metric Category | Key Indicators | BNG Relevance |
|---|---|---|
| Composition | Habitat type proportions, richness | Baseline habitat mapping |
| Patch size and density | Mean patch size, patch density | Identifies fragmentation severity |
| Patch shape | Perimeter-to-area ratio, shape index | Edge effect assessment |
| Configuration | Nearest neighbour distance, core area | Functional connectivity |
| Route networks | Corridor width, stepping-stone spacing | Mitigation design |
A widely cited ecological synthesis concludes that habitat loss typically has stronger negative effects on biodiversity than fragmentation per se, and that fragmentation effects can be weak or even positive in certain contexts. This evidence implies that BNG baselines must distinguish between sheer habitat quantity loss and changes in spatial pattern, focusing mitigation resources on cases where fragmentation genuinely reduces functional connectivity for target species.
Pull quote: "Fragmentation metrics are not an academic luxury, they are the evidence base that separates a defensible BNG baseline from a liability."
For practitioners working on biodiversity net gain assessments, this distinction is operationally important. A site that has lost 30% of its woodland area through agricultural clearance presents a very different ecological baseline from one where the same area remains but has been subdivided into ten isolated patches. The statutory metric may return similar unit values; the fragmentation metrics will not.
Core Fragmentation Metrics for BNG Baselines: Advanced Survey Techniques for Fragmented Landscapes
Selecting the right metrics for a given site requires matching the ecological question to the available data and the likely impact pathway. The following indicators are most commonly applied in professional BNG practice on fragmented sites.
Patch Size and Core Area
Mean patch size and patch density are the most accessible entry-level fragmentation metrics. They are derivable from standard Phase 1 habitat survey data combined with GIS analysis. However, patch size alone overstates functional habitat value because it includes edge-affected zones. Core area, the inner portion of a patch beyond a defined edge-effect buffer, is a more ecologically meaningful measure for species sensitive to edge disturbance, such as ground-nesting birds and woodland invertebrates.
For BNG baselines, calculating core area requires:
- Defining a species-appropriate edge-effect buffer (typically 30-100 m depending on the target assemblage).
- Subtracting the buffer zone from total patch area in GIS.
- Recording core area alongside total area in the baseline habitat register.
Nearest Neighbour Distance and Patch Density
Nearest neighbour distance (NND) quantifies isolation by measuring the gap between a focal patch and its closest habitat equivalent. High NND values indicate that species requiring inter-patch movement face significant barriers. Patch density, the number of patches per unit landscape area, provides a complementary measure of how finely the landscape has been subdivided [1].
These metrics are particularly valuable for linear infrastructure projects. DEFRA's June 2026 NSIP guidance confirms that all habitats within the order limits that will be negatively impacted must be included in the baseline, including those subject to permanent or temporary loss, deterioration due to shading, or disturbance [2]. For a pipeline or transmission line crossing a fragmented landscape, NND analysis identifies which habitat patches are functionally connected and therefore at risk of cumulative fragmentation impact from the works.
Connectivity Indices
Connectivity indices, such as the Integral Index of Connectivity (IIC) and the Probability of Connectivity (PC), quantify how well a network of habitat patches facilitates species movement. They are calculated using graph-theoretic approaches in GIS platforms such as Conefor Sensinode or QGIS plugins. While not yet required by statutory BNG guidance, connectivity indices are increasingly used by practitioners to:
- Identify which patches are disproportionately important to landscape-scale connectivity (high dPC values).
- Prioritise those patches for avoidance or enhanced mitigation in project design.
- Justify the strategic significance score applied in the statutory metric.
For developers exploring off-site BNG delivery options, connectivity indices also help identify receptor sites that would genuinely enhance landscape-scale function rather than simply adding area in an isolated location.
Advanced Survey Techniques for Fragmented Landscapes
Capturing the configuration and connectivity of habitats at baseline requires techniques that go beyond traditional walkover survey. Practitioners working on fragmented landscapes increasingly combine high-resolution remote sensing with targeted field verification and molecular tools.

Drone-Based Habitat Mapping
Unmanned aerial vehicles (UAVs) equipped with multispectral or RGB cameras can produce sub-10 cm resolution orthomosaics of entire development corridors in a single flight campaign. The practical advantages for BNG baselines on fragmented sites are considerable:
- Spatial completeness: Drone surveys capture the full extent of the order limits, including inaccessible field corners, riparian margins, and road verges that are frequently omitted from ground-based surveys.
- Repeatability: Orthorectified imagery provides a permanent, auditable record of pre-development habitat configuration that can be compared with post-development monitoring data.
- Patch metric derivation: Classified raster outputs can be imported directly into GIS for automated calculation of patch size, core area, NND, and shape indices.
Under the NSIP framework, where a reasonable worst-case approach may be used when the precise construction corridor is not yet fixed, drone-derived habitat maps across the full order limits provide the evidence base needed to identify the highest-habitat-value corridor for baseline and BNG calculations [8].
GIS-Derived Patch Analysis
GIS analysis transforms classified habitat maps into quantitative fragmentation metrics. A standard workflow for BNG baseline purposes includes:
- Habitat classification, assign UKHab or Phase 1 categories to mapped polygons.
- Patch delineation, dissolve adjacent same-type polygons; separate non-contiguous patches.
- Metric calculation, compute area, perimeter, shape index, core area, and NND for each patch using FRAGSTATS, QGIS, or ArcGIS landscape ecology toolboxes.
- Connectivity modelling, run least-cost path or circuit theory models to identify functional linkages.
- Baseline register, compile patch metrics alongside statutory metric inputs in a structured spreadsheet.
This workflow supports the emerging local planning authority practice of requiring a 10% gain for each habitat type present on site, terrestrial habitats, hedgerows, trees, and water, rather than a single blended percentage [7]. Fine-scale GIS mapping is essential for capturing hedgerows and tree lines, which often form the critical connective tissue in fragmented agricultural landscapes.
Environmental DNA and Genetic Connectivity Tools
Environmental DNA (eDNA) sampling from waterbodies and soil provides species-presence data that complements habitat mapping by revealing whether fragmented patches are actually being used by target species. For BNG baselines, eDNA is most cost-effective when:
- The site contains waterbodies or wet habitats where great crested newt, white-clawed crayfish, or water vole presence would materially affect baseline unit values.
- Fragmentation has created uncertainty about whether isolated terrestrial patches retain viable populations of woodland or grassland invertebrates detectable through soil eDNA.
Genetic connectivity analysis, using population genetics to infer historical gene flow between patches, is a more specialised tool but is increasingly accessible through commercial laboratory services. It provides direct evidence of whether fragmentation has already reduced functional connectivity to the point of genetic isolation, which has direct implications for the condition assessment and strategic significance scoring in the statutory metric.
For developers seeking to understand how these techniques affect the overall biodiversity impact assessment process, integrating eDNA and genetic data at the baseline stage produces a more robust evidence base and reduces the risk of post-consent challenge.
Applying Habitat Fragmentation Metrics for BNG Baselines: Advanced Survey Techniques for Fragmented Landscapes in the NSIP Context
The June 2026 DEFRA guidance for NSIPs has sharpened the practical relevance of fragmentation metrics in two ways. First, it confirms that the baseline must include all habitats within the order limits that will be negatively impacted, including those subject to temporary loss or deterioration due to shading or disturbance [2]. This means even small, isolated high-value fragments along a route corridor must be surveyed and included wherever there is a reasonable likelihood of impact [3].
Second, it confirms that unimpacted habitats do not need to be included in the baseline [2]. For infrastructure delivered above or below existing habitats, tunnels or viaducts avoiding direct disturbance, this exclusion can simplify the baseline considerably. However, where there is a reasonable likelihood that works may affect higher-value habitat, the baseline must assume impact unless robust controls clearly secure a no-impact outcome [3].
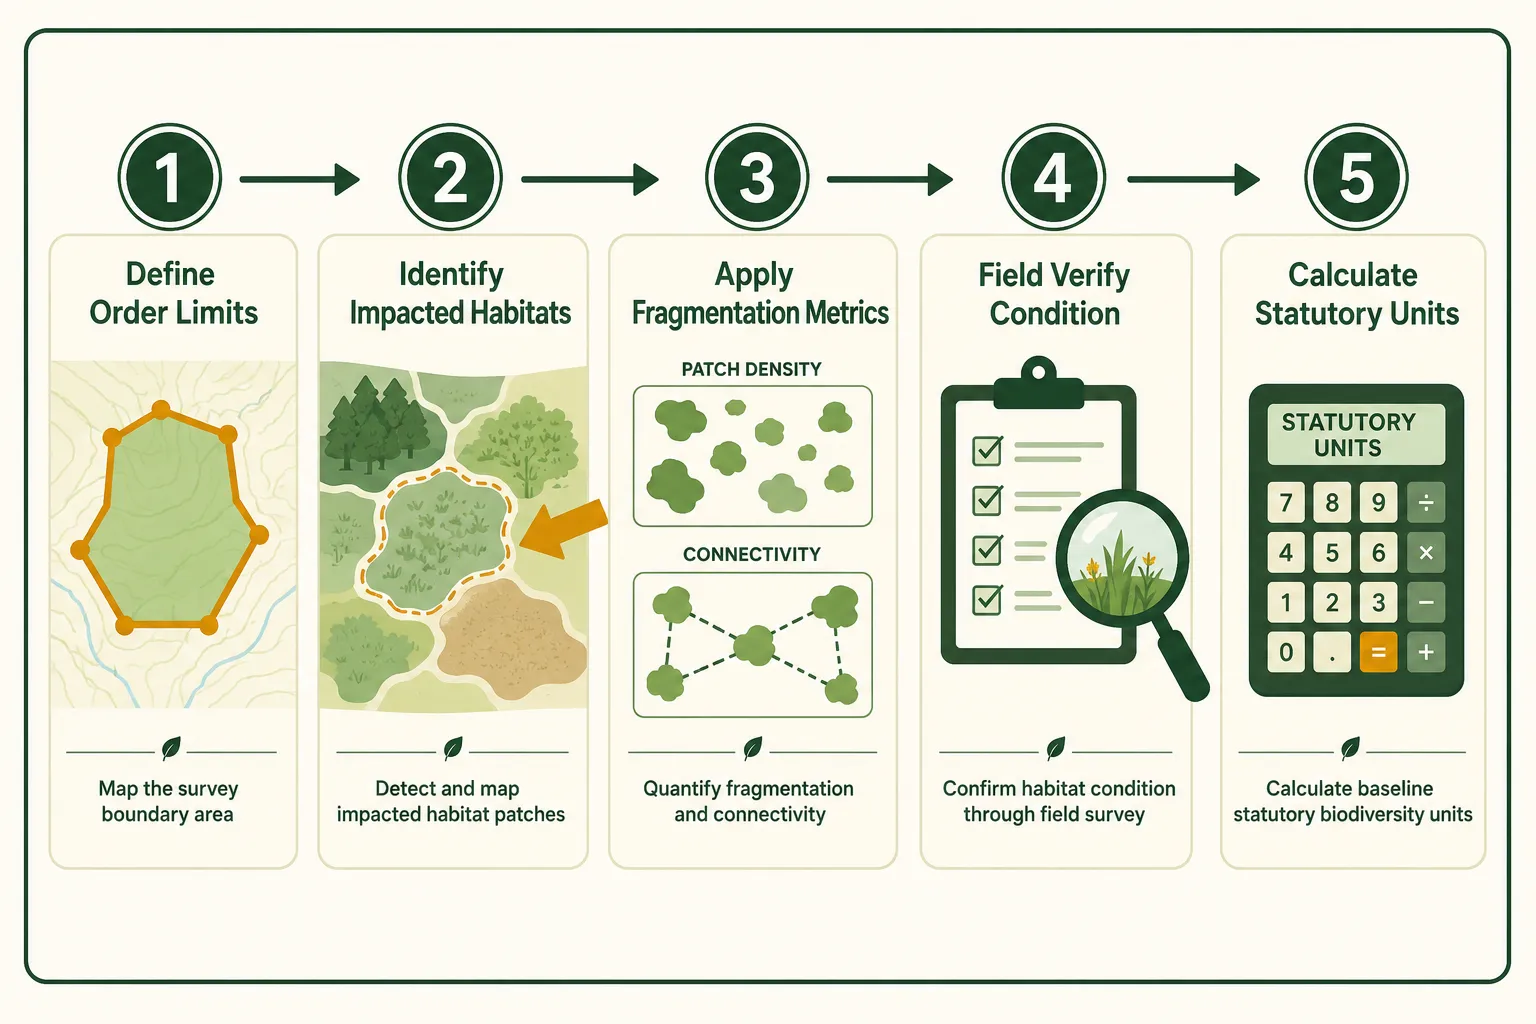
The practical consequence is this: excluding unimpacted habitats narrows the area to which the 10% objective applies, but simultaneously increases the relative importance of the high-value, impacted fragments that remain in scope [9]. A single ancient hedgerow or species-rich grassland strip within the order limits can carry a disproportionate share of the baseline biodiversity units. Accurate fragmentation metrics, particularly core area and connectivity indices, are therefore essential to avoid underestimating the baseline value of these features and, consequently, underestimating the gain required.
The Secretary of State may not consent to NSIP development unless satisfied that the biodiversity value attributable to the development exceeds the pre-development biodiversity value of on-site habitat by at least 10% [6]. For large linear schemes, this calculation depends entirely on the quality of the baseline survey. Practitioners should refer to the secondary BNG legislation summary for the current regulatory framework governing these calculations.
Reasonable Worst-Case Approach and Fragmentation Data
For NSIPs where the precise construction corridor is not yet fixed, a reasonable worst-case approach uses the highest-habitat-value corridor within the known order limits for baseline and BNG calculations [8]. This approach relies on having habitat information across the whole order limits and tends to focus attention on fragmented high-value strips and nodes when determining worst-case impacts [8]. Drone-based mapping and GIS patch analysis are ideally suited to this task because they provide comprehensive spatial coverage without the time and cost of full-corridor walkover survey.
Integrating Fragmentation Evidence into BNG Strategy
Fragmentation metrics are most valuable when they inform design decisions, not just baseline documentation. The following principles guide their integration into BNG strategy:
Avoidance first: Connectivity index analysis identifies which patches are disproportionately important to landscape-scale movement. Design teams should use this evidence to route infrastructure away from high-dPC patches before considering mitigation or compensation.
Buffer placement: Core area analysis identifies the minimum buffer needed to protect interior habitat conditions. Buffer placement informed by core area metrics is more ecologically defensible than standard setback distances applied uniformly.
Stepping-stone creation: Where fragmentation cannot be avoided, stepping-stone habitat creation, small patches placed at intervals within dispersal range of target species, can restore connectivity. NND analysis identifies the optimal spacing and location for these features.
Off-site receptor selection: When on-site gains are insufficient, BNG off-site land banking and habitat banking options should be evaluated using connectivity indices to ensure receptor sites genuinely enhance landscape-scale function. Landowners interested in providing receptor sites can find relevant guidance on selling biodiversity units.
Monitoring alignment: Fragmentation metrics established at baseline provide quantitative targets for post-development monitoring. Patch density, NND, and core area can be re-measured from repeat drone surveys to demonstrate whether habitat management is achieving the intended connectivity outcomes.
For developers working on smaller schemes, the same principles apply at a proportionate scale. The BNG guidance for small development projects sets out how baseline requirements are scaled to project complexity, but even small sites in fragmented landscapes benefit from patch-level analysis of hedgerows and boundary features.
Conclusion
Habitat fragmentation metrics for BNG baselines and advanced survey techniques for fragmented landscapes represent the frontier of professional practice in 2026. The statutory biodiversity metric provides the regulatory foundation, but it was not designed to capture the full ecological cost of spatial isolation. Connectivity indices, core area analysis, and nearest neighbour distance metrics fill that gap, and the June 2026 NSIP guidance has made their application more urgent by focusing baseline obligations on impacted habitat fragments, however small.
Actionable next steps for practitioners:
- Audit current baseline workflows to identify whether patch-level fragmentation metrics are being recorded alongside statutory metric inputs.
- Commission drone-based habitat mapping for all sites with complex or linear configurations to ensure spatial completeness.
- Integrate GIS patch analysis, including core area, NND, and connectivity indices, as standard outputs of the baseline habitat register.
- Use connectivity index results to inform design team decisions on routing, buffering, and stepping-stone creation before the statutory metric is finalised.
- For NSIP schemes, apply the reasonable worst-case approach using drone-derived habitat maps across the full order limits to identify high-value corridor sections.
- Engage with planning authorities early to agree whether per-habitat-type gain targets will be applied, as this drives the level of mapping detail required for hedgerows, trees, and waterbodies.
Investing in advanced survey techniques at the baseline stage reduces regulatory risk, supports more ecologically meaningful mitigation design, and produces the defensible evidence base that planning authorities and statutory consultees increasingly expect. For further guidance on how these principles apply to your specific project, contact a specialist biodiversity surveyor with experience in fragmented landscape assessment.
References
[1] Ts32 Chap 10 – cbd.int
[2] What To Include In Biodiversity Net Gain Baselines For Nsips – gov.uk
[3] Bng For Nsips Defra Guidance And Biodiversity Gain Statements – burges-salmon.com
[4] Biodiversity Net Gain For Nsips Gain Statements Laid And Guidance Published – defraenvironment.blog.gov.uk
[5] Biodiversity Net Gain Nationally Significant Infrastructure Projects – gov.uk
[6] Understanding Biodiversity Net Gain – gov.uk
[7] Bng Advisory Note V1.2 Accessible Version – blackburn-darwen.org.uk
[8] Infrastructure Planning Blog 53 Biodiversity Net Gain For Nationally Significant Infrastructure Projects And More – tlt.com
[9] Biodiversity Net Gain (bng) Update – twobirds.com