
Recent studies reveal a striking finding: two grassland sites with identical species counts can differ by 300% in ecosystem functioning. This disparity stems from differences in functional trait diversity—the physical and physiological characteristics that determine how organisms interact with their environment. As UK Biodiversity Net Gain (BNG) regulations mature in 2026, ecological surveyors are discovering that traditional species inventories fail to capture the ecological resilience that functional trait diversity in BNG assessments demands.
The shift toward Functional Trait Diversity in BNG Assessments: Survey Protocols Beyond Species Counts for 2026 represents more than methodological refinement—it fundamentally changes how ecologists measure genuine ecological improvement. Research demonstrates that functional diversity, rather than species numbers, strongly determines ecosystem functioning, making it essential for BNG assessments that aim to measure genuine ecological improvement[1].
Key Takeaways
- Functional traits predict ecosystem performance better than species counts, with characteristics like leaf thickness, root depth, and seed size determining habitat resilience
- Multi-dimensional assessment protocols require measuring three orthogonal trait axes—two root dimensions and one leaf economic spectrum—rather than single-spectrum models
- Critical management thresholds exist at 80 kg N ha⁻¹ yr⁻¹ fertilization, beyond which grasslands become functionally poor regardless of species diversity
- Field survey kits and standardized protocols now enable practical trait-based assessments during baseline and post-intervention monitoring phases
- Scale-dependent relationships between above-ground and below-ground traits require context-aware survey approaches for accurate BNG evaluation
Understanding Functional Trait Diversity in Modern BNG Frameworks
What Makes Functional Traits Different from Species Lists?
Traditional biodiversity surveys count species presence and abundance. A site might record 45 plant species and receive a corresponding biodiversity score. However, this approach misses critical information about how those species function within the ecosystem.
Functional traits are measurable characteristics that influence organism performance and ecosystem processes. These include:
- 🌿 Leaf traits: Specific leaf area (SLA), leaf thickness, nitrogen content, photosynthetic capacity
- 🌱 Root traits: Root depth, diameter, branching patterns, mycorrhizal associations
- 🌾 Reproductive traits: Seed size, dispersal mechanisms, flowering phenology
- 📏 Structural traits: Plant height, growth form, wood density
A landmark 2024 perspective published in Biological Diversity presents a comprehensive international framework integrating decades of trait-based ecology to show how these physical and physiological characteristics influence biodiversity assessment across different scales[2].
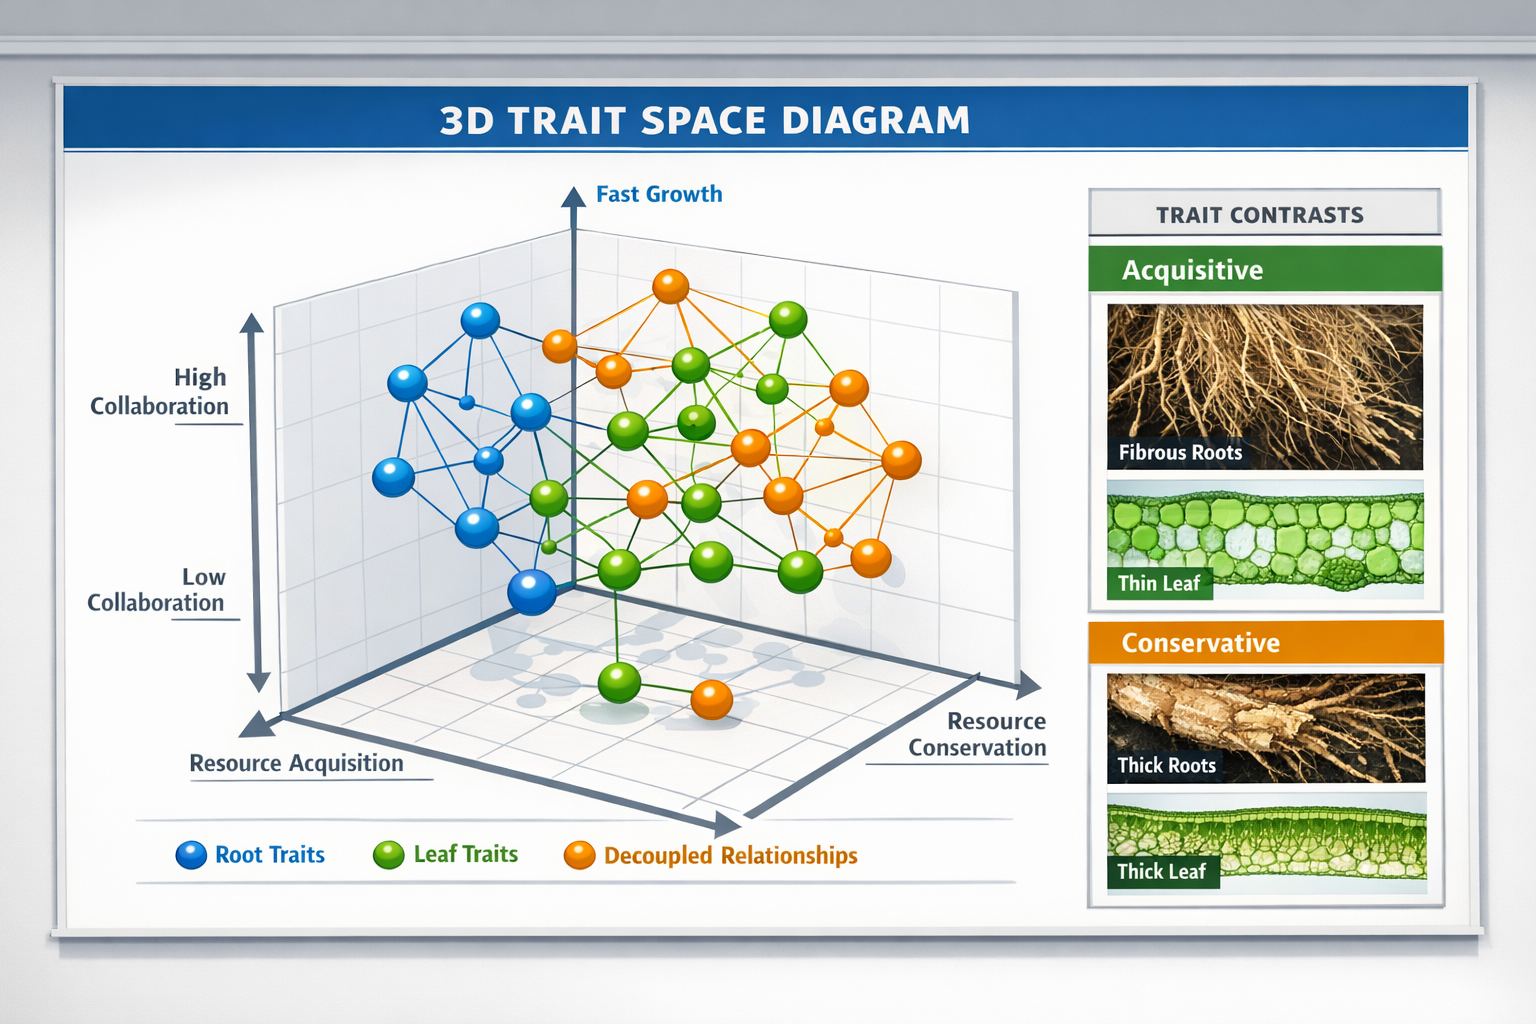
The Three-Dimensional Nature of Trait Space
Recent research fundamentally challenges simplified trait assessment models. Field studies reveal that trait space is best described by three orthogonal axes—two root axes (collaboration and conservation) and one leaf economic axis—meaning functional diversity cannot be simplified into a single measurement[5].
This discovery has profound implications for conducting biodiversity impact assessments. Surveyors must now consider:
| Trait Dimension | What It Measures | Survey Implications |
|---|---|---|
| Leaf Economic Spectrum | Resource acquisition vs. conservation strategies | Requires leaf tissue sampling and laboratory analysis |
| Root Collaboration Axis | Mycorrhizal associations and nutrient partnerships | Demands root excavation and microscopy protocols |
| Root Conservation Axis | Resource storage vs. rapid uptake strategies | Needs root diameter and tissue density measurements |
Above-Ground and Below-Ground Functional Decoupling
One of the most significant findings for survey protocol development: at local community scales, the relationship between leaf and root traits was much weaker or even absent. Species exhibiting acquisitive leaf traits (fast growth, high nutrient content) do not necessarily have acquisitive root traits[5].
This decoupling means that comprehensive BNG surveys cannot infer below-ground functional diversity from above-ground observations alone. Protocols must include both components to accurately assess ecosystem functioning potential.
Field Survey Protocols for Functional Trait Diversity in BNG Assessments: Survey Protocols Beyond Species Counts for 2026
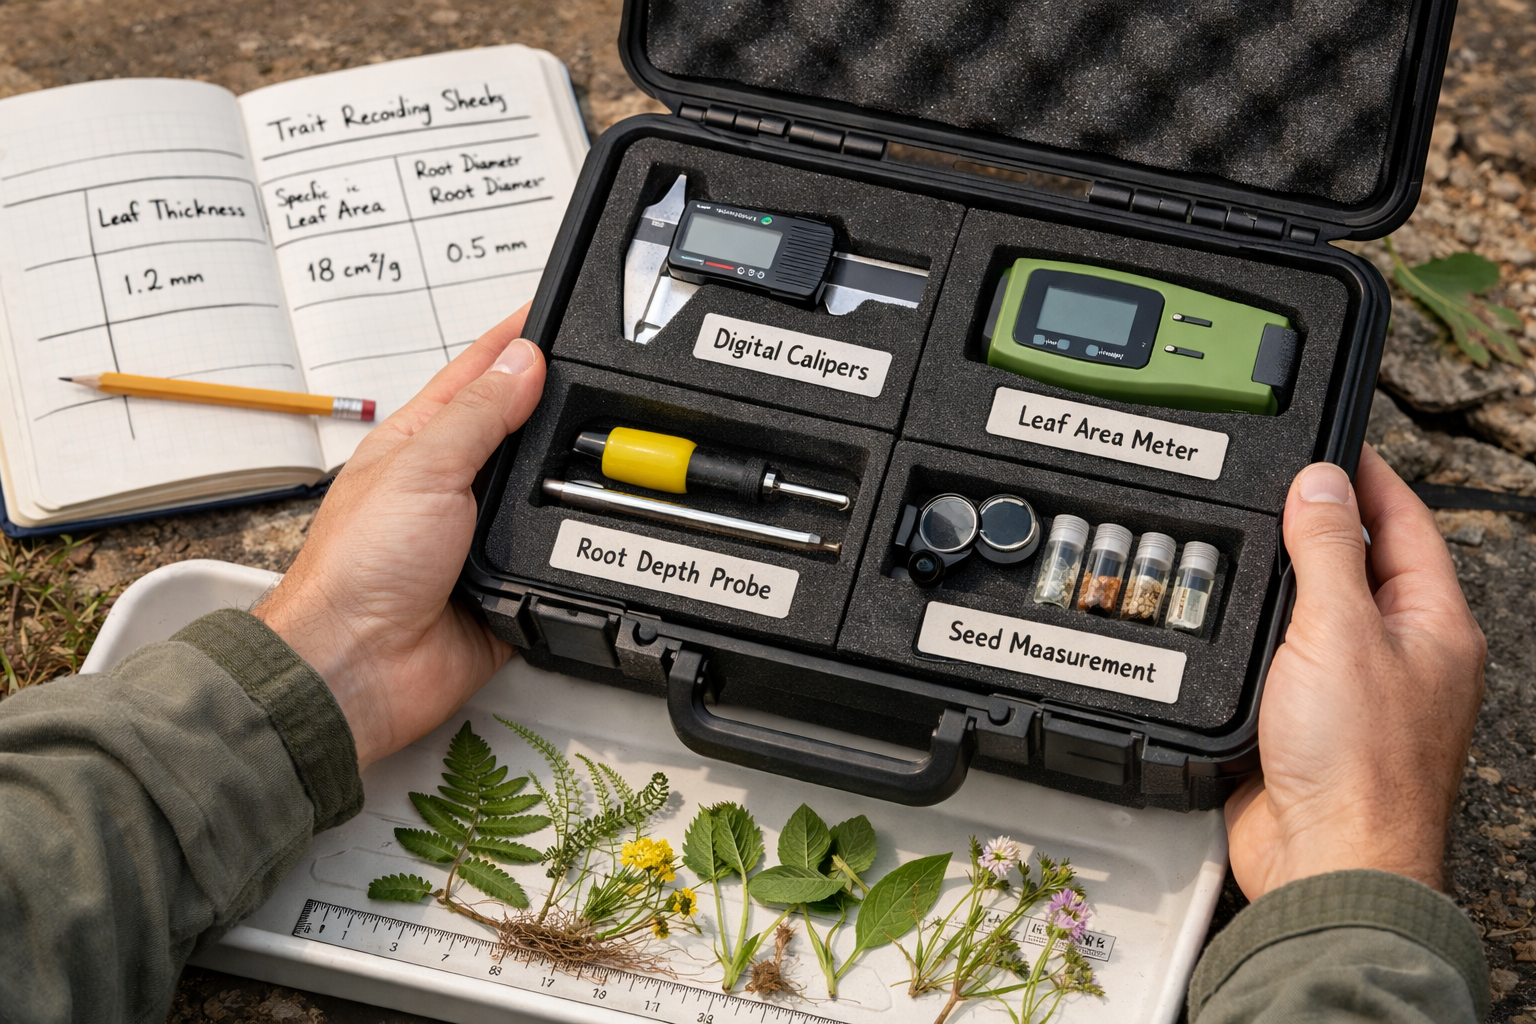
Essential Field Equipment and Measurement Kits
Modern trait-based surveys require specialized equipment beyond traditional identification guides. A comprehensive field kit for Functional Trait Diversity in BNG Assessments: Survey Protocols Beyond Species Counts for 2026 includes:
Leaf Trait Measurement Tools:
- Digital calipers (±0.01mm precision) for leaf thickness
- Portable leaf area meters or grid-based measurement templates
- Leaf punch sets for standardized tissue sampling
- Portable SPAD chlorophyll meters for nitrogen estimation
Root Trait Assessment Equipment:
- Soil corers (minimum 30cm depth) for root sampling
- Root washing sieves (multiple mesh sizes)
- Digital microscopes or magnifying loupes for root hair assessment
- Root diameter measurement tools
Reproductive Trait Sampling:
- Seed collection envelopes with measurement scales
- Digital scales (±0.001g precision) for seed mass
- Phenology recording templates
Data Recording Systems:
- Weather-resistant tablets with specialized trait recording apps
- GPS units for precise quadrat location
- Field notebooks with standardized trait recording sheets
Standardized Sampling Protocols
The fundiversity package aids calculation of functional diversity indices in R, facilitating standardized analysis of field-collected trait data[1]. However, the quality of computational analysis depends entirely on field sampling rigor.
Recommended Sampling Framework:
-
Stratified Random Sampling: Divide assessment area into habitat types, then randomly place 1m² quadrats (minimum 10 per habitat type)
-
Within-Quadrat Trait Sampling:
- Identify all vascular plant species
- Select 3-5 individuals per species for trait measurement
- Measure traits on mature, undamaged specimens
- Record microhabitat conditions (light, moisture, disturbance)
-
Trait Measurement Timing:
- Leaf traits: Peak growing season (June-August for UK temperate species)
- Root traits: Late growing season when root systems fully developed
- Reproductive traits: Species-specific flowering/fruiting periods
-
Quality Control:
- Calibrate measurement tools daily
- Photograph specimens alongside measurement scales
- Cross-reference measurements between multiple observers
- Record weather conditions affecting trait expression
Integration with Existing BNG Metric Calculations
The UK's statutory BNG metric currently focuses on habitat condition assessments. Functional trait diversity provides complementary data that strengthens biodiversity net gain reports by:
✅ Validating condition scores: High functional diversity supports claims of "good" or "moderate" habitat condition
✅ Establishing robust baselines: Trait measurements provide quantitative pre-development data resistant to surveyor bias
✅ Monitoring post-intervention success: Trait recovery timelines indicate genuine ecological restoration versus superficial greening
✅ Identifying management thresholds: Trait-based indicators reveal when management intensity compromises ecosystem functioning
Critical Management Thresholds Revealed by Functional Trait Research
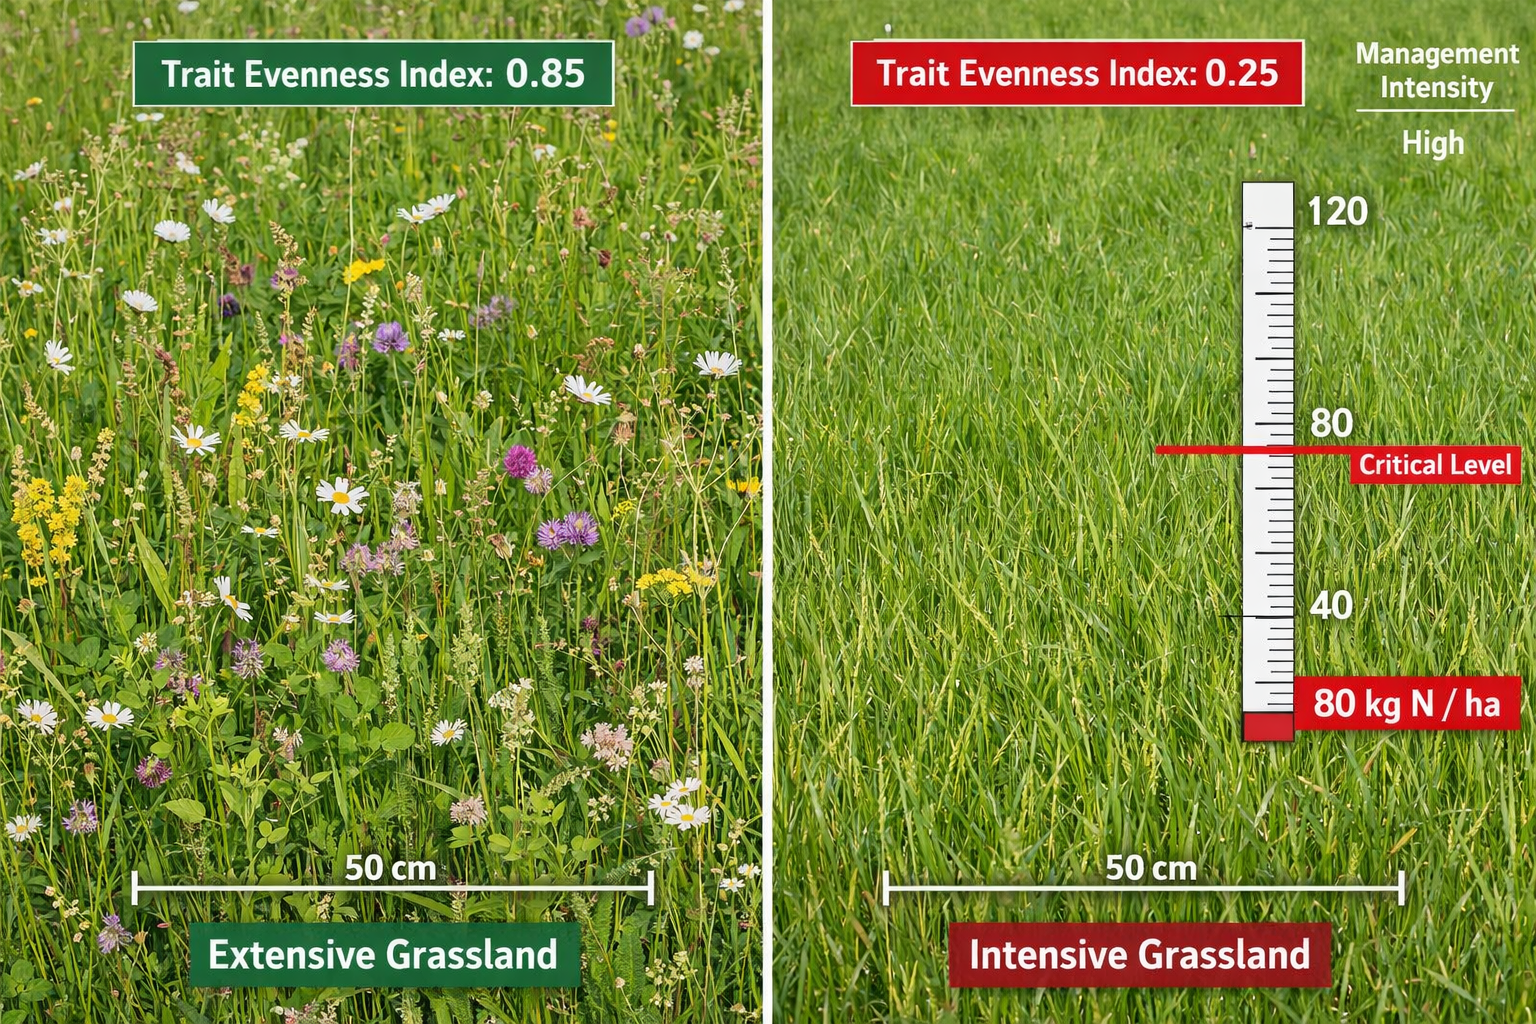
The 80 kg Nitrogen Threshold
Multi-site time series data (2008-2020) from 150 agricultural grasslands reveal two thresholds where functional structure changed dramatically: the first between unfertilized and fertilized grasslands, and the second when fertilization exceeded 80 kg N ha⁻¹ yr⁻¹ or grazing exceeded 500 livestock units days ha⁻¹ yr⁻¹[4].
Beyond these thresholds, grasslands became functionally poor and unstable regardless of species counts. This finding has immediate implications for:
- Baseline assessment: Sites with historical intensive management may show low functional diversity despite adequate species numbers
- Target setting: Achieving 10% biodiversity net gain requires functional recovery, not just species reintroduction
- Management prescriptions: Restoration plans must specify fertilization limits to maintain functional diversity
- Monitoring protocols: Post-intervention surveys should track trait evenness as a management success indicator
Trait Evenness as a Stability Indicator
Research shows that unfertilized grasslands demonstrate maximization of trait evenness, indicating persistence of plant species with diverse resource-use strategies[4]. This trait evenness provides:
- Functional redundancy: Multiple species perform similar ecological roles, creating resilience to disturbance
- Niche complementarity: Different resource-use strategies maximize ecosystem productivity
- Temporal stability: Diverse trait profiles maintain ecosystem functioning across seasons and years
For BNG practitioners, trait evenness offers a measurable target beyond species richness. Surveys should calculate:
Trait Evenness Index = Distribution of trait values across functional trait space
High evenness indicates diverse resource-use strategies; low evenness suggests functional homogenization even when species diversity appears adequate.
Scale-Dependent Assessment Considerations
Regional and global-scale analyses reveal stronger trait correlations between leaf and root characteristics, suggesting common environmental drivers promote trait convergence over large spatial gradients[5]. This scale dependency requires BNG protocols to account for geographic context.
Local Scale (< 1 hectare):
- Weak leaf-root trait correlations
- High intraspecific variability
- Management history dominates trait expression
- Requires comprehensive above- and below-ground sampling
Landscape Scale (1-100 hectares):
- Moderate trait correlations
- Habitat type influences trait distributions
- Connectivity affects trait diversity patterns
- Strategic sampling across habitat gradients
Regional Scale (> 100 hectares):
- Strong trait correlations
- Climate and soil type drive trait convergence
- Biogeographic context essential for interpretation
- Reference site selection critical for target setting
Data Analysis Workflows for Trait-Based BNG Assessments
From Field Data to Functional Diversity Indices
Converting raw trait measurements into meaningful BNG metrics requires systematic data processing:
Step 1: Data Quality Control
- Remove outliers (values > 3 standard deviations from species mean)
- Check for measurement errors (impossible values)
- Verify species identifications
- Document data gaps
Step 2: Trait Standardization
- Log-transform skewed trait distributions
- Standardize traits to mean = 0, SD = 1
- Weight traits by ecological relevance (optional)
- Account for phylogenetic relationships
Step 3: Functional Diversity Calculation
Common indices include:
| Index | What It Measures | BNG Application |
|---|---|---|
| Functional Richness | Volume of trait space occupied | Indicates functional capacity range |
| Functional Evenness | Distribution of abundance in trait space | Reflects resource-use diversity |
| Functional Divergence | Degree of trait differentiation | Shows niche differentiation |
| Community-Weighted Mean (CWM) | Dominant trait values | Indicates prevailing ecosystem strategy |
Step 4: Temporal and Spatial Comparison
- Compare baseline vs. post-intervention indices
- Benchmark against reference sites
- Calculate percentage change in functional diversity
- Assess trajectory toward target conditions
Software Tools and Computational Resources
Several R packages facilitate functional diversity analysis:
- FD package: Calculates functional diversity indices from trait matrices
- fundiversity package: Streamlined functional diversity calculations[1]
- TPD package: Trait probability density methods
- mFD package: Multidimensional functional diversity framework
For practitioners without R expertise, emerging web-based platforms provide user-friendly interfaces for uploading trait data and generating standardized reports compatible with BNG documentation requirements.
Integration with Automated BNG Assessment Tools
New automated BNG assessment tools are now available for small projects during the design stage, streamlining collaboration between ecologists, local authorities, and project stakeholders[6]. While these platforms currently focus on habitat-based metrics, integration of trait-based assessments represents the next evolution.
Forward-looking developers should consider how functional trait data can enhance biodiversity plans for building projects by:
- Providing quantitative evidence for habitat condition claims
- Demonstrating genuine ecological improvement beyond habitat creation
- Supporting long-term monitoring and adaptive management
- Justifying premium pricing for high-quality biodiversity units
Practical Implementation Challenges and Solutions
Addressing Survey Time and Cost Constraints
The primary barrier to trait-based BNG assessments is perceived complexity. Traditional species surveys require 2-4 hours per site; comprehensive trait surveys may require 6-10 hours plus laboratory processing time.
Cost-Effective Strategies:
💡 Tiered Assessment Approach: Conduct full trait surveys only for high-value or ecologically sensitive sites; use rapid trait assessment protocols for standard developments
💡 Trait Database Integration: Leverage existing trait databases (TRY Plant Trait Database, LEDA) to supplement field measurements with species-level trait values
💡 Targeted Trait Selection: Focus on 5-8 key traits with strongest ecosystem functioning relationships rather than comprehensive trait batteries
💡 Seasonal Efficiency: Schedule surveys to capture multiple trait types during single site visits (e.g., measure leaf and reproductive traits simultaneously during peak flowering)
💡 Volunteer and Citizen Science: Train community groups in standardized trait measurement protocols for ongoing monitoring
Training and Capacity Building
Implementing Functional Trait Diversity in BNG Assessments: Survey Protocols Beyond Species Counts for 2026 requires upskilling the ecological surveyor workforce. Essential competencies include:
- Trait measurement techniques and equipment operation
- Plant functional ecology principles
- Data management and statistical analysis
- Integration of trait data with statutory BNG metrics
- Communication of functional diversity concepts to non-technical stakeholders
Professional development opportunities should emphasize hands-on field training with standardized protocols, ensuring consistency across survey teams and projects.
Regulatory Recognition and Metric Integration
Current UK BNG regulations do not explicitly require functional trait assessments. However, the framework's emphasis on "measurable improvement" and "habitat condition" creates opportunities for trait-based evidence to strengthen applications.
Strategies for regulatory integration:
✅ Supplementary Documentation: Include trait diversity data as supporting evidence for habitat condition assessments
✅ Enhanced Monitoring Plans: Propose trait-based indicators for long-term monitoring requirements
✅ Innovation Pilot Projects: Collaborate with local planning authorities on demonstration projects showcasing trait-based assessment value
✅ Industry Standards Development: Participate in professional body initiatives to develop standardized trait assessment protocols
Future Directions: Trait-Based Assessments Beyond 2026
Intraspecific Variability and Climate Adaptation
The trait-based framework emphasizes that integration of intraspecific trait variability (how individuals of the same species differ) and phylogeny (evolutionary history) is critical for predicting how plant communities will respond under global warming and habitat loss[2].
This forward-looking perspective means BNG assessments in 2026 and beyond should consider:
- Climate-adapted trait profiles: Selecting species and populations with trait characteristics suited to projected future conditions
- Functional redundancy planning: Ensuring multiple species can perform critical ecosystem functions as climate shifts
- Trait plasticity assessment: Measuring capacity for trait adjustment in response to environmental change
- Assisted migration considerations: Evaluating trait suitability of non-native species for future habitat creation
Cross-Taxa Trait Assessment Expansion
Current trait-based protocols focus predominantly on vascular plants. Comprehensive ecosystem functioning assessment requires expansion to:
- Pollinator functional diversity: Body size, tongue length, flight period, nesting requirements
- Soil invertebrate traits: Feeding guilds, mobility, reproduction strategies
- Avian functional traits: Foraging strategies, nesting requirements, dispersal capacity
- Microbial functional diversity: Nutrient cycling capabilities, symbiotic relationships
These multi-taxa approaches align with the broader goals of benefitting nature and developers through holistic ecosystem assessment.
Technology-Enabled Trait Assessment
Emerging technologies promise to reduce trait assessment costs while improving data quality:
- Hyperspectral imaging: Remote sensing of leaf chemical traits from drone or satellite platforms
- Machine learning identification: Automated species identification coupled with trait database lookup
- Root imaging systems: Non-destructive below-ground trait assessment using ground-penetrating radar or minirhizotrons
- Phenocams: Automated temporal trait monitoring (phenology, canopy structure)
As these technologies mature, trait-based BNG assessments will become increasingly practical for routine application across development projects of all scales, including small development projects.
Conclusion
The transition to Functional Trait Diversity in BNG Assessments: Survey Protocols Beyond Species Counts for 2026 represents a fundamental evolution in how ecological value is measured and protected. Traditional species inventories, while valuable, fail to capture the ecosystem functioning that determines genuine biodiversity gain. Research consistently demonstrates that functional diversity—the range of physical and physiological characteristics within communities—predicts ecological resilience, productivity, and stability more reliably than species numbers alone.
For ecological surveyors, this paradigm shift requires new skills, equipment, and analytical approaches. The three-dimensional nature of trait space, the decoupling of above-ground and below-ground traits, and the identification of critical management thresholds all demand more sophisticated assessment protocols. However, these complexities yield proportionate benefits: quantitative, defensible evidence of ecological improvement that strengthens BNG applications and supports long-term habitat management.
Actionable Next Steps
For Ecological Consultants:
- Invest in trait measurement field kits and training for survey teams
- Develop standardized trait recording templates compatible with existing BNG workflows
- Build trait databases for regionally common species to supplement field measurements
- Pilot trait-based assessments on selected projects to demonstrate value to clients
For Developers and Landowners:
5. Request trait-based evidence in biodiversity net gain reports to substantiate habitat condition claims
6. Incorporate trait diversity targets into management prescriptions for created and enhanced habitats
7. Consider trait-based monitoring as part of long-term stewardship commitments
8. Explore opportunities to market premium biodiversity units supported by functional diversity evidence
For Planning Authorities:
9. Encourage trait-based supplementary evidence in BNG applications
10. Support pilot projects demonstrating trait assessment integration with statutory metrics
11. Provide guidance on acceptable trait-based monitoring approaches
12. Facilitate knowledge exchange between ecological consultants and planning teams
The evidence is clear: ecosystems with high functional trait diversity demonstrate greater resilience to environmental change, more stable productivity, and enhanced delivery of ecosystem services. As BNG regulations mature, assessment protocols must evolve beyond simple species counts to capture these critical functional dimensions. The tools, protocols, and analytical frameworks now exist to make trait-based assessments practical for routine application. The question for 2026 is not whether functional trait diversity matters—it demonstrably does—but how quickly the industry can adopt protocols that measure what truly matters for biodiversity conservation.
References
[1] Functional Trait Diversity – https://nbshub.naturebasedsolutionsinitiative.org/mon_metrics/functional-trait-diversity
[2] eurekalert – https://www.eurekalert.org/news-releases/1111721
[4] pubmed.ncbi.nlm.nih.gov – https://pubmed.ncbi.nlm.nih.gov/40461812/
[5] Exploring Functional Diversity Through Traits – https://research.reading.ac.uk/lemontree/exploring-functional-diversity-through-traits/
[6] Watch – https://www.youtube.com/watch?v=lucVHr-5MBE
